Swap variable using tuple :
This is a Pythonic and efficient way to swap values without using a temporary variable. a, b = b, a
#PythonTips #OneLinerPython #PythonTricks #CleanCode #LearnPython #CodeSnippet #100DaysOfCode #DevLife #Pythonista #codingmadeeasy
#pythonista
I'm in need of a #pythonista to tell me why this code is throwing the error "NameError: local variable referenced before assignment"
Still en route home from #PyConUS sprints.. Looking forward to decompressing in several hours, even though all the intense interactions were inspiring and meaningful. I'm so privileged to have so many #pythonista friends in my life 🫶 #Python
@mrola Tengo meses usando #DeepSeek para generar código, y es mucho más eficiente, limpio y bien documentado, que otras herramientas similares. He podido generar scripts incluso para herramientas en iOS, como #Pythonista o #Scriptable con facilidad.
@ambv pdb -p
???
REALLY?
I think I just died and went to #pythonista heaven :)
(Also WOW do I wish I had that feature when I worked at AMZN. Can't tell you how many times I had to try and debug a deeply embedded process running positively GNARLY enterprise Python code!)
We’re very excited to be kicking off 2025 with an exciting announcement… PyCon UK is back, and we’re moving to a brand-new location!
After several fantastic years in Cardiff, the 2025 conference is heading up north. We’re thrilled to announce that PyCon UK 2025 will be held in Manchester from the 19th to the 22nd of September 🗓️
Expect a full program of talks, workshops, and sprints for all Pythonistas. We look forward to seeing you there! 🐍
I just stumbled on the following #Python code
if not (3 <= len(sys.argv) <= 4):
Which I find quite confusing (or even revolting)
Additionally I think it is wrong as the program takes exactly 2 arguments.
So
if ( len(sys.argv) != 3):
would have been far easier to understand.
Nevertheless, can a #Pythonista please explain me the pattern?
From other programming languages I would have expected it to fail miserably because the evaluation order would have created something like
(3 <= len(sys.argv) )<= 4)
where the first part would evaluate to true or false which both are likely smaller than 4
Hello Pythonistas,
Hope to see you all in meet up again!
Our next meet-up will be on Wednesday, November 6,2024.
Join us, have a chat, and learn more featutes of aider.chat by Jane Ooi & Timothy Downs and arithmetic trading in Python by Adolfo Villalobos.
Book your spot at https://www.meetup.com/melbourne-python-user-group/events/304091942/?utm_medium=referral&utm_campaign=announceModal_savedevents_share_modal&utm_source=link and join us at 5:30 pm on Wednesday, November 6 at Judo Bank, in the Queen and Collins Building, Level 26/376-390 Collins St, Melbourne VIC 3000, Australia.
#Python #Pythonmeet-up #Pythonista
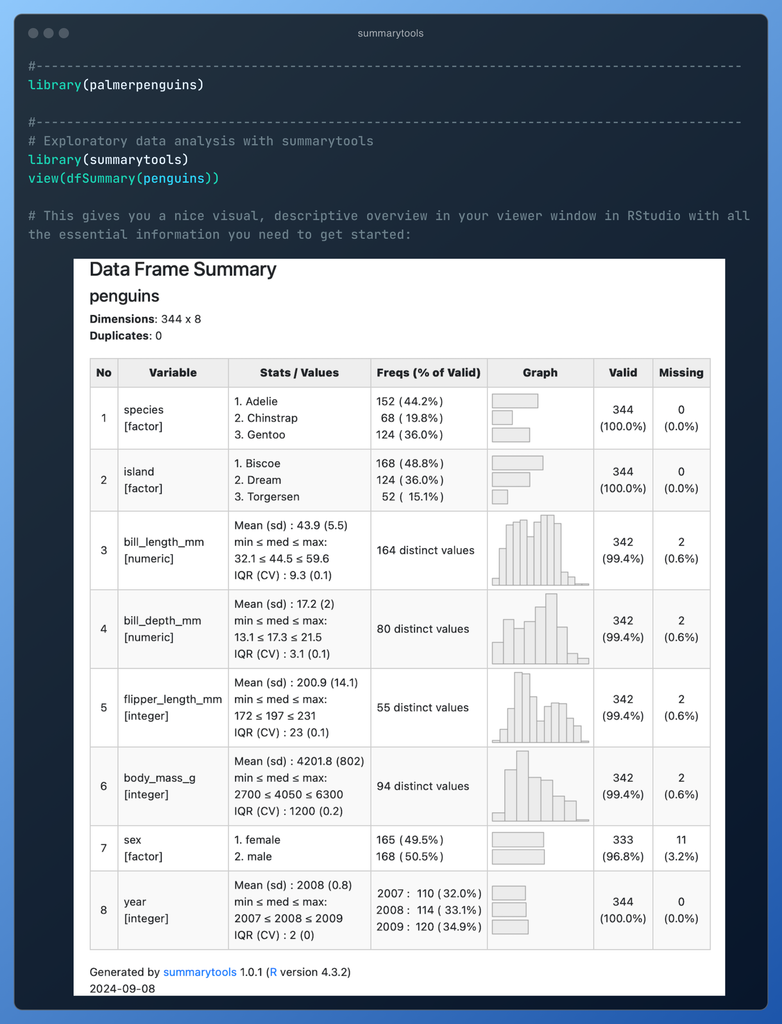
The last tool on the list is another allrounder 🚀
📦 summarytools (by Dominic Comtois)
I’m a visual person and I like to “see” my data. With a combination of two commands from {summarytools} that’s easy and you get a descriptive overview in your viewer pane in your IDE.
🔗 https://github.com/dcomtois/summarytools
---------------------
Looking for more #rstats packages for #EDA? Check out this blog post: https://bit.ly/eda-in-rstats
#pythonista? A series is coming soon!
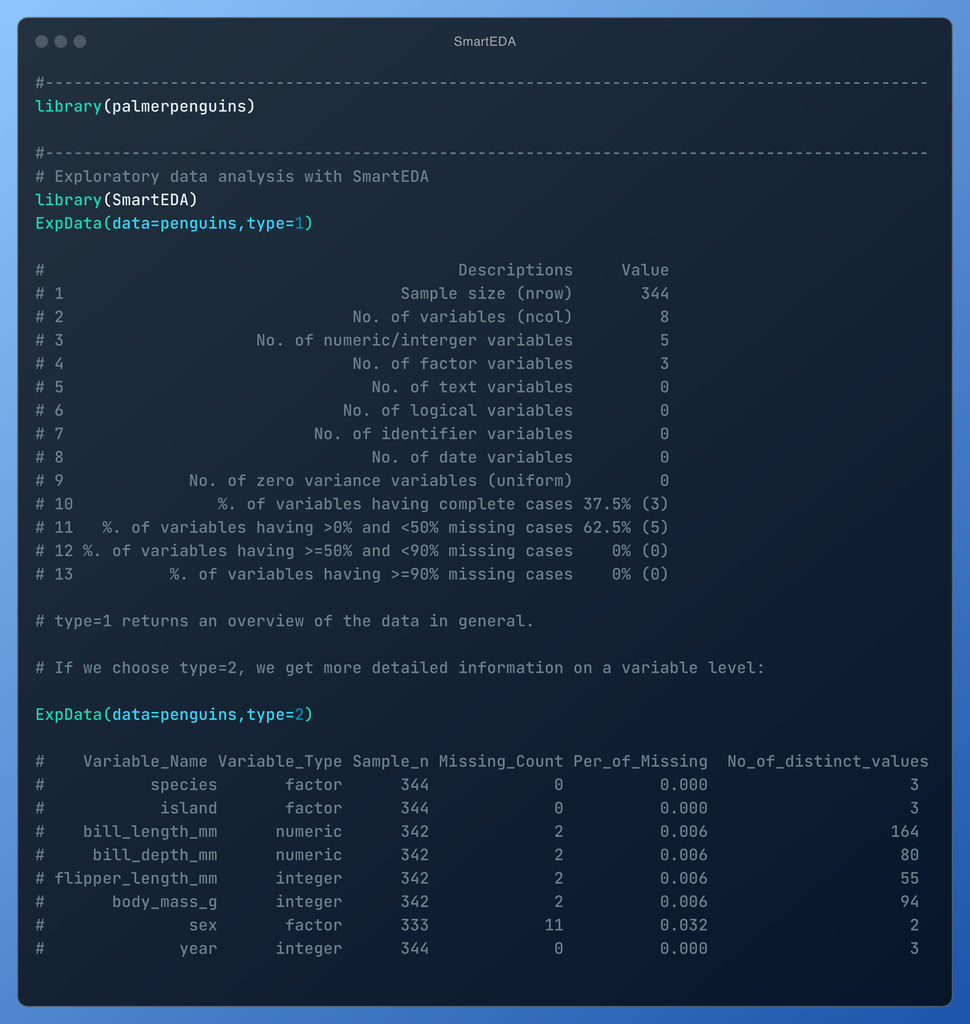
The next #rstats package comes with a full suite of functions to wrangle your data 🛠️
📦 SmartEDA (by Dayanand Ubrangala and others)
I like to use a powerful function to get a brief overview of the data - if you’re looking for more, it can also generate a standardized #HTML report for you.
🔗 https://daya6489.github.io/SmartEDA/
---------------------
Looking for more #rstats packages for #EDA? Check out this blog post: https://bit.ly/eda-in-rstats
#pythonista? A series is coming soon!
Hello Pythonistas,
Hope to see you all in meet up again!
Our next meet-up will be on Wednesday, October 2.
Join us, have a chat, and learn more about migrating COBOL data to PostgreSQL using Python and Django by Alan and Knowledge Graphs and GNNs by Mohammad.
👉 Book your spot-https://www.meetup.com/melbourne-python-user-group/events/303495628/?eventOrigin=group_upcoming_events and join us at 5:30 pm on Wednesday, October 2 at Judo Bank, in the Queen and Collins Building, Level 26/376-390 Collins St, Melbourne VIC 3000, Australia.
#Python #Pythonmeet-up #Pythonista
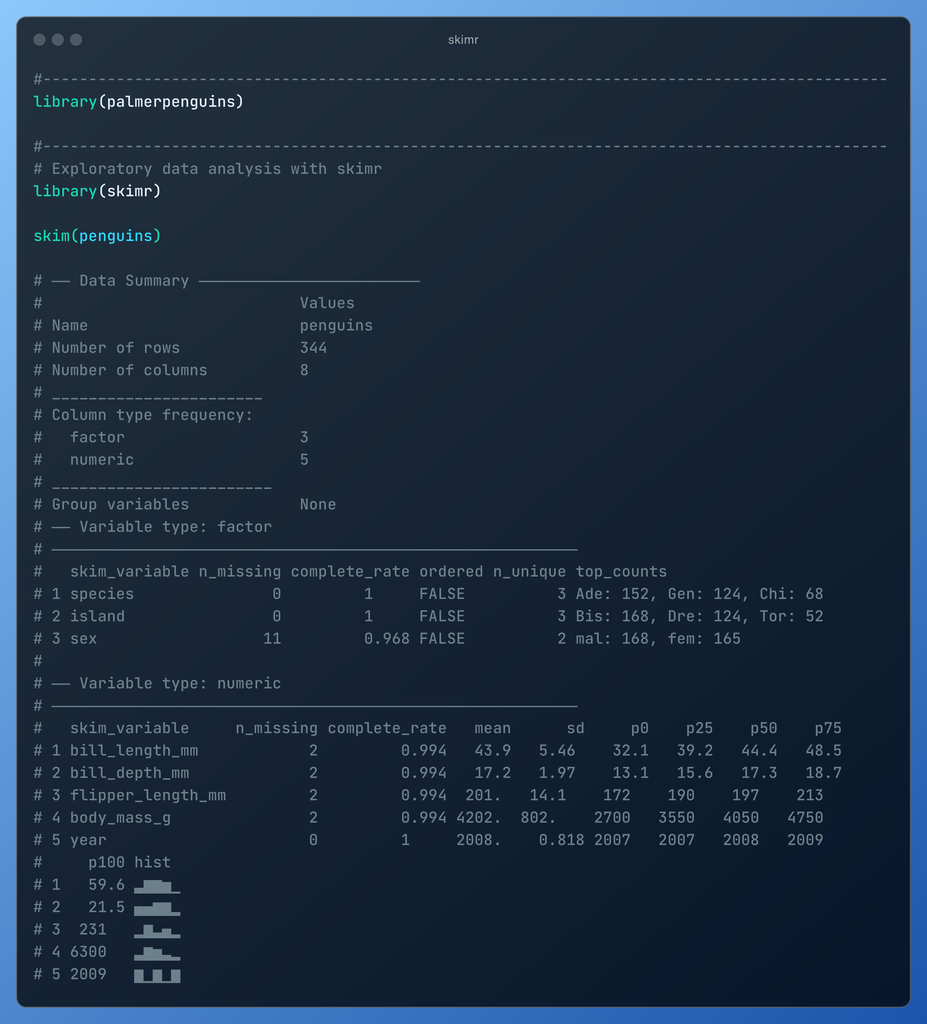
I like the next one because without creating full-blown plots, you get visuals. How cool is that?
📦 skimr (by Elin Waring and others)
As you can see in the screenshot, calling skimr::skim() gives you a wealth of descriptive statistics - all readily accessible in your console.
🔗 https://docs.ropensci.org/skimr/
---------------------
Looking for more #rstats packages for #EDA? Check out this blog post: https://bit.ly/eda-in-rstats
#pythonista? A series is coming soon!
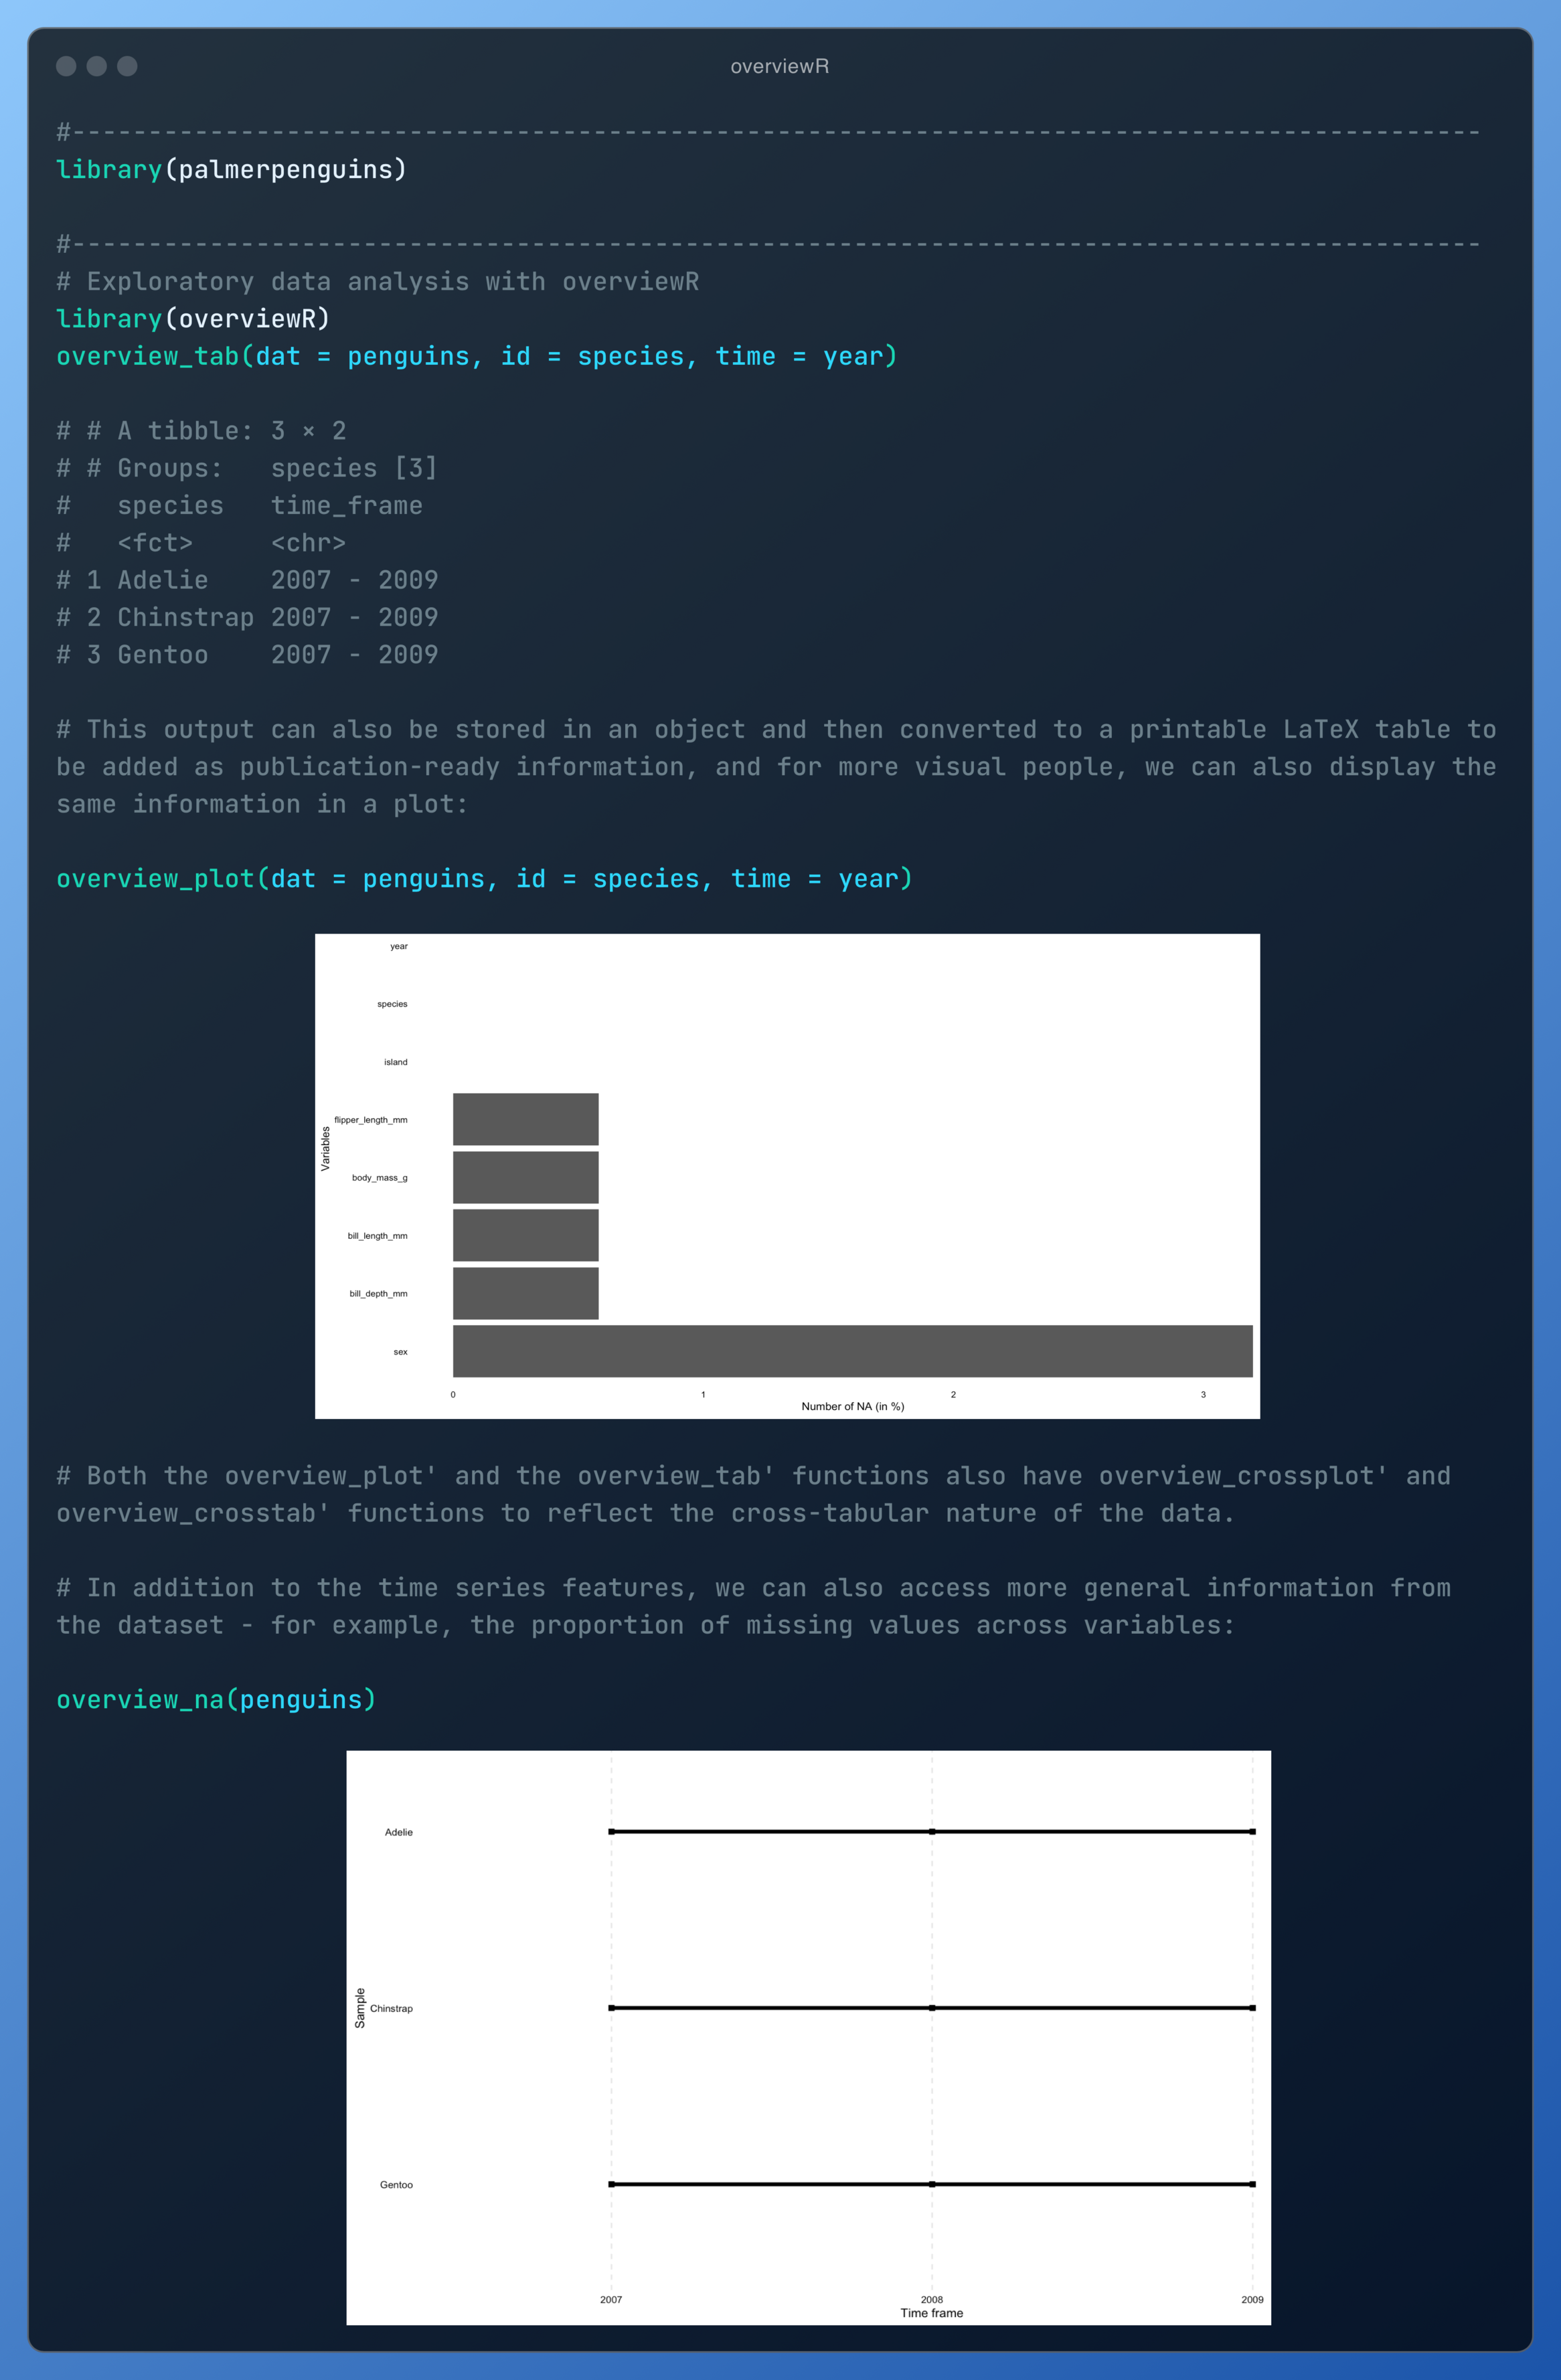
I can't present today's package without bias—it was my first #rstats package and taught me a lot about #softwaredevelopment.
📦 overviewR (by Cosima Meyer & Dennis Hammerschmidt)
It’s designed for time-series cross-sectional data but works for a range of datasets in your #EDA.
🔗 https://cosimameyer.github.io/overviewR/
---------------------
Looking for more #rstats packages for #EDA? Check out this post: https://bit.ly/eda-in-rstats
#pythonista? Series coming soon!
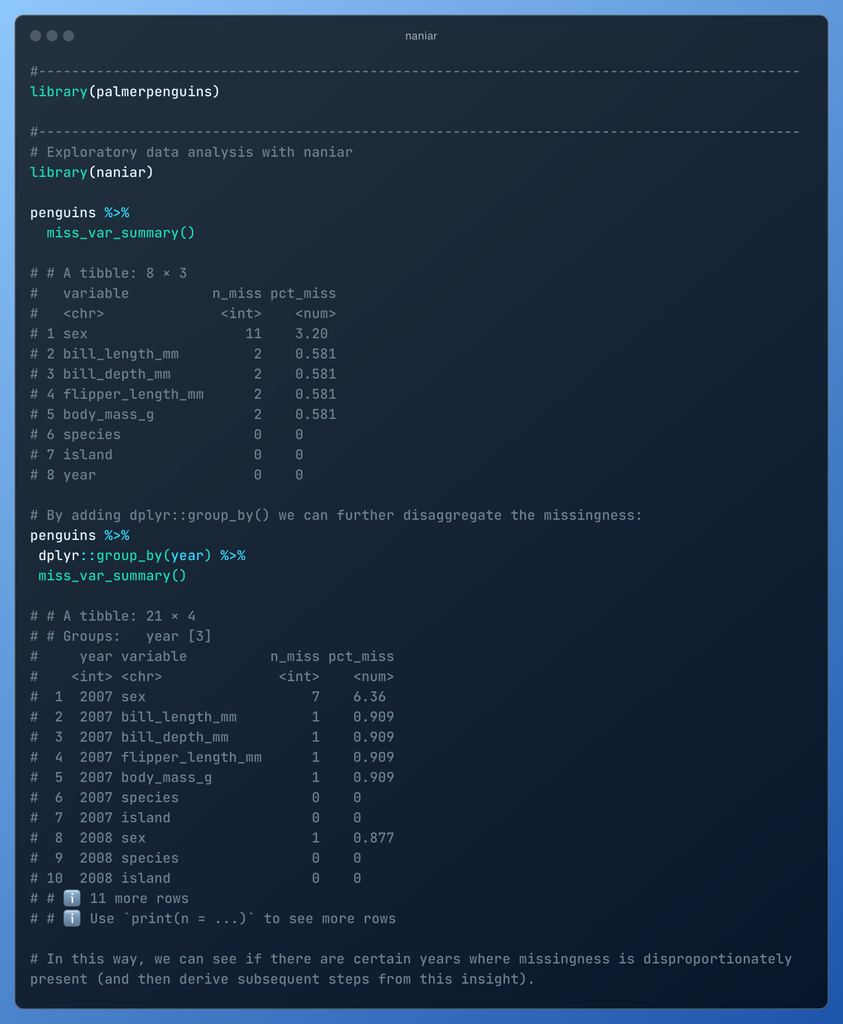
The next package sheds light on your missing data 💡
📦 naniar (by @njtierney, @visnut, @milesmcbain, @colinfay and others)
It's all about highlighting and dealing with missing data 🕵🏼♀️ (and I love the hex-logo - it tells the story so nicely!)
🔗 https://naniar.njtierney.com
---------------------
Looking for more #rstats packages for #EDA? Check out this blog post: https://bit.ly/eda-in-rstats
#pythonista? A series is coming soon!
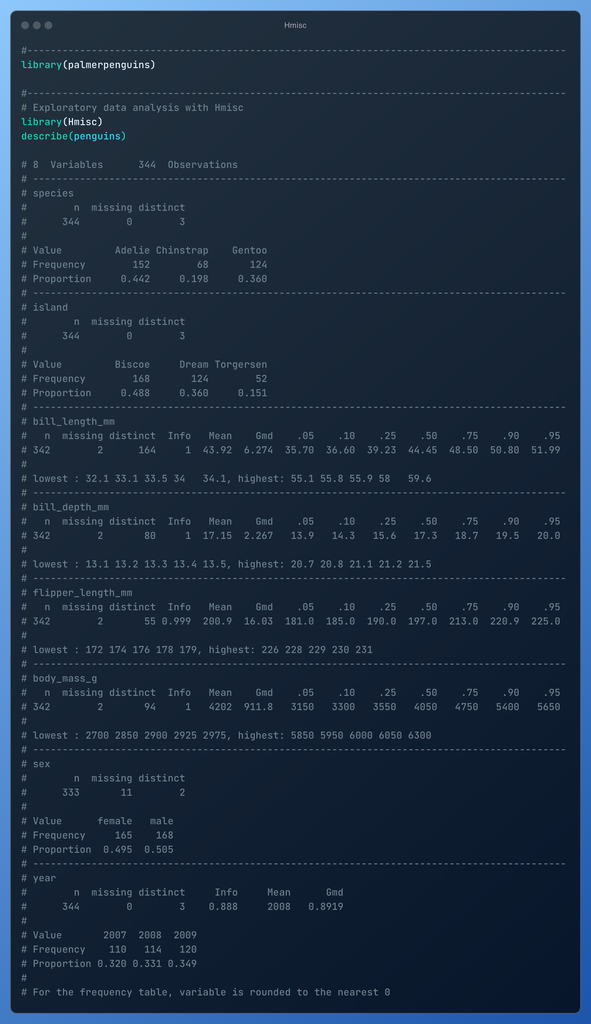
The next package for #EDA is
📦 Hmisc (by Frank Harrell & Charles Dupont).
I'm just scratching the surface, but Hmisc::describe() is my go-to for a great tabular overview of descriptive stats.
🔗 https://hbiostat.org/r/hmisc/ 🔗 https://hbiostat.org/r/hmisc/#package-usage-and-examples (workflows)
---------------------
Looking for more #rstats packages for #EDA? Check out this post: https://bit.ly/eda-in-rstats
#pythonista? Series coming soon!
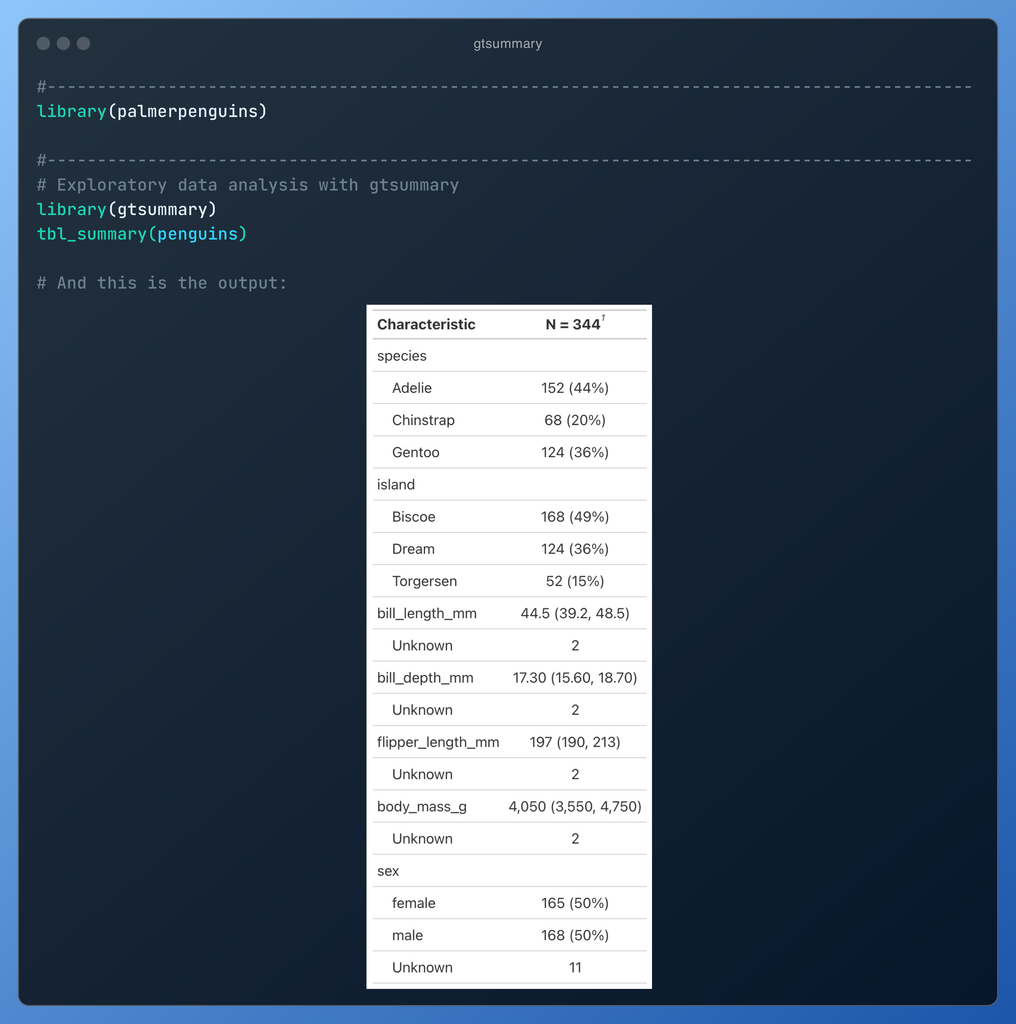
Let's welcome another good friend in #EDA in #rstats
📦 gtsummary (by Daniel Sjoberg (creator and maintainer) as well as contributors)
It gives you nice, publication-ready tables (and goes beyond #EDA here - if you are looking for a way to present regression tables nicely, this one has it for you too!)
🔗 https://www.danieldsjoberg.com/gtsummary/
------------------
Looking for more #rstats packages for #EDA? Check out this blog post: https://bit.ly/eda-in-rstats
#pythonista? A series is coming soon!
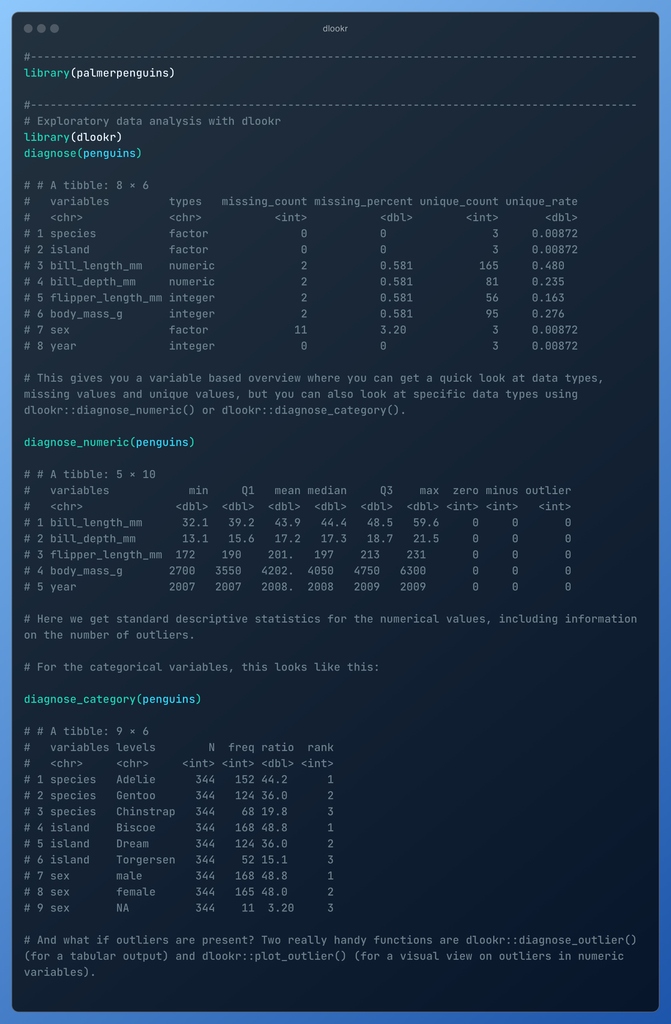
Next up is {dlookr} that you can use to support your #EDA workflow in #rstats
📦 dlookr (by Choonghyun Ryu)
It builds on its diagnose function family and gives you also specific ways how to visualize and analyze outliers.
🔗 https://choonghyunryu.github.io/dlookr/
---------------------
Looking for more #rstats packages for #EDA? Check out this blog post: https://bit.ly/eda-in-rstats
#pythonista? A series is coming soon!
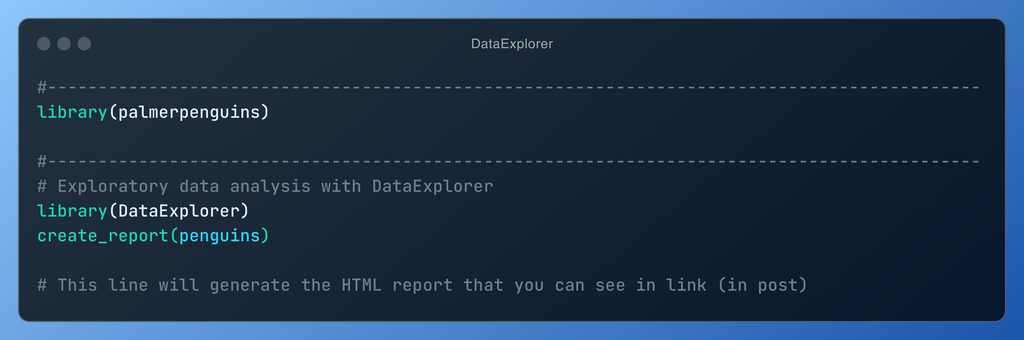
And let’s continue the #EDA series in #rstats with
📦 DataExplorer (by Boxuan Cui)
This package is rich - it comes with ready-made reports that can be generated with just one line of code: create_report(penguins). Check out the report here to see what it looks like: https://cosimameyer.com/media/report.html
🔗 https://github.com/boxuancui/DataExplorer/
---------------------
Looking for more #rstats packages for #EDA? Check out this blog post: https://bit.ly/eda-in-rstats
#pythonista? A series is coming soon!
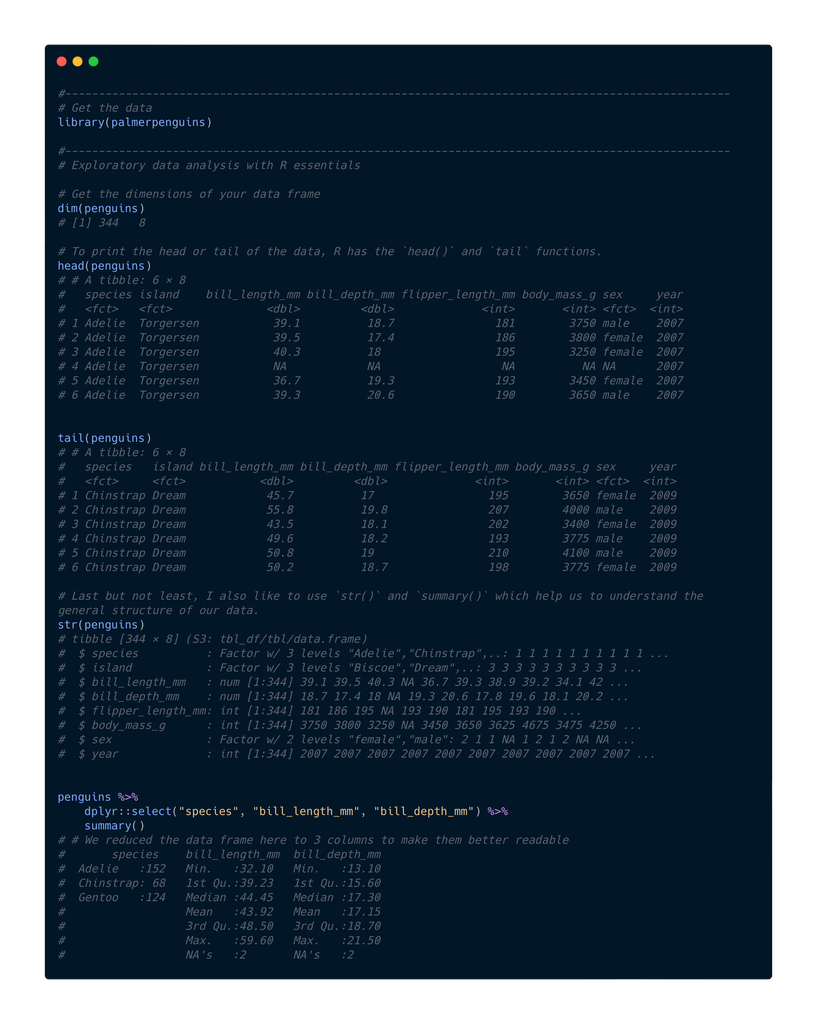
Let's talk about #EDA, a key part of any #datascience workflow. Understanding your data and spotting biases is crucial for modeling and interpreting results 🔎
Luckily, many tools can support your workflow. I'll start with #rstats 🚀
📦 R Essentials
No extra packages needed—#rstats provides built-in functions that give a data overview
---------------------
Looking for more #rstats packages for #EDA? Check out this blog post: bit.ly/eda-in-rstats
#pythonista? A series is coming soon!
I am so incredibly inspired and just a bit overwhelmed by #pyconus2024
I met so many amazing people and saw SO MANY great talks.
I'll definitely be re-watching a few while I take the time to process it all and play with some of the amazing new tools I've been exposed to.
What a truly exceptional community we have. I am very grateful for the huge team of people who clearly gave it their all and proud to be a #pythonista :)
Client Info
Server: https://mastodon.social
Version: 2025.04
Repository: https://github.com/cyevgeniy/lmst