For the #30DayChartChallenge day 4: Big or Small, I made an #rstats treemap with the 📦 #treemapify, in the same Byrne's Euclid style as for day 1. It shows that a Small number of programs each attract a Big number of students, and a Big amount of programs each attract a Small number of students.
#treemapify
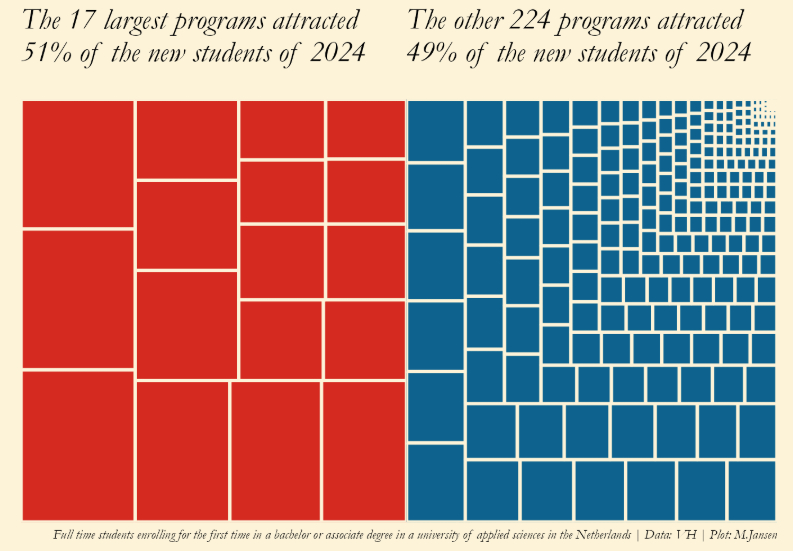
Día 4 | Comparaciones – Grande o Pequeño | #30DayChartChallenge. La visualización fue creada usando R basado en los paquetes: #ggplot2, #dplyr, #treemapify. Fuente: Sistema de Educación Superior - UNAH – 2023.
One language to rule them all, One language to find them, One language to bring them all and in the #AI bind them. 🤭 #dataviz 🌍📊 made & posted via #rstats, #bskyr, #treemapify 🚀
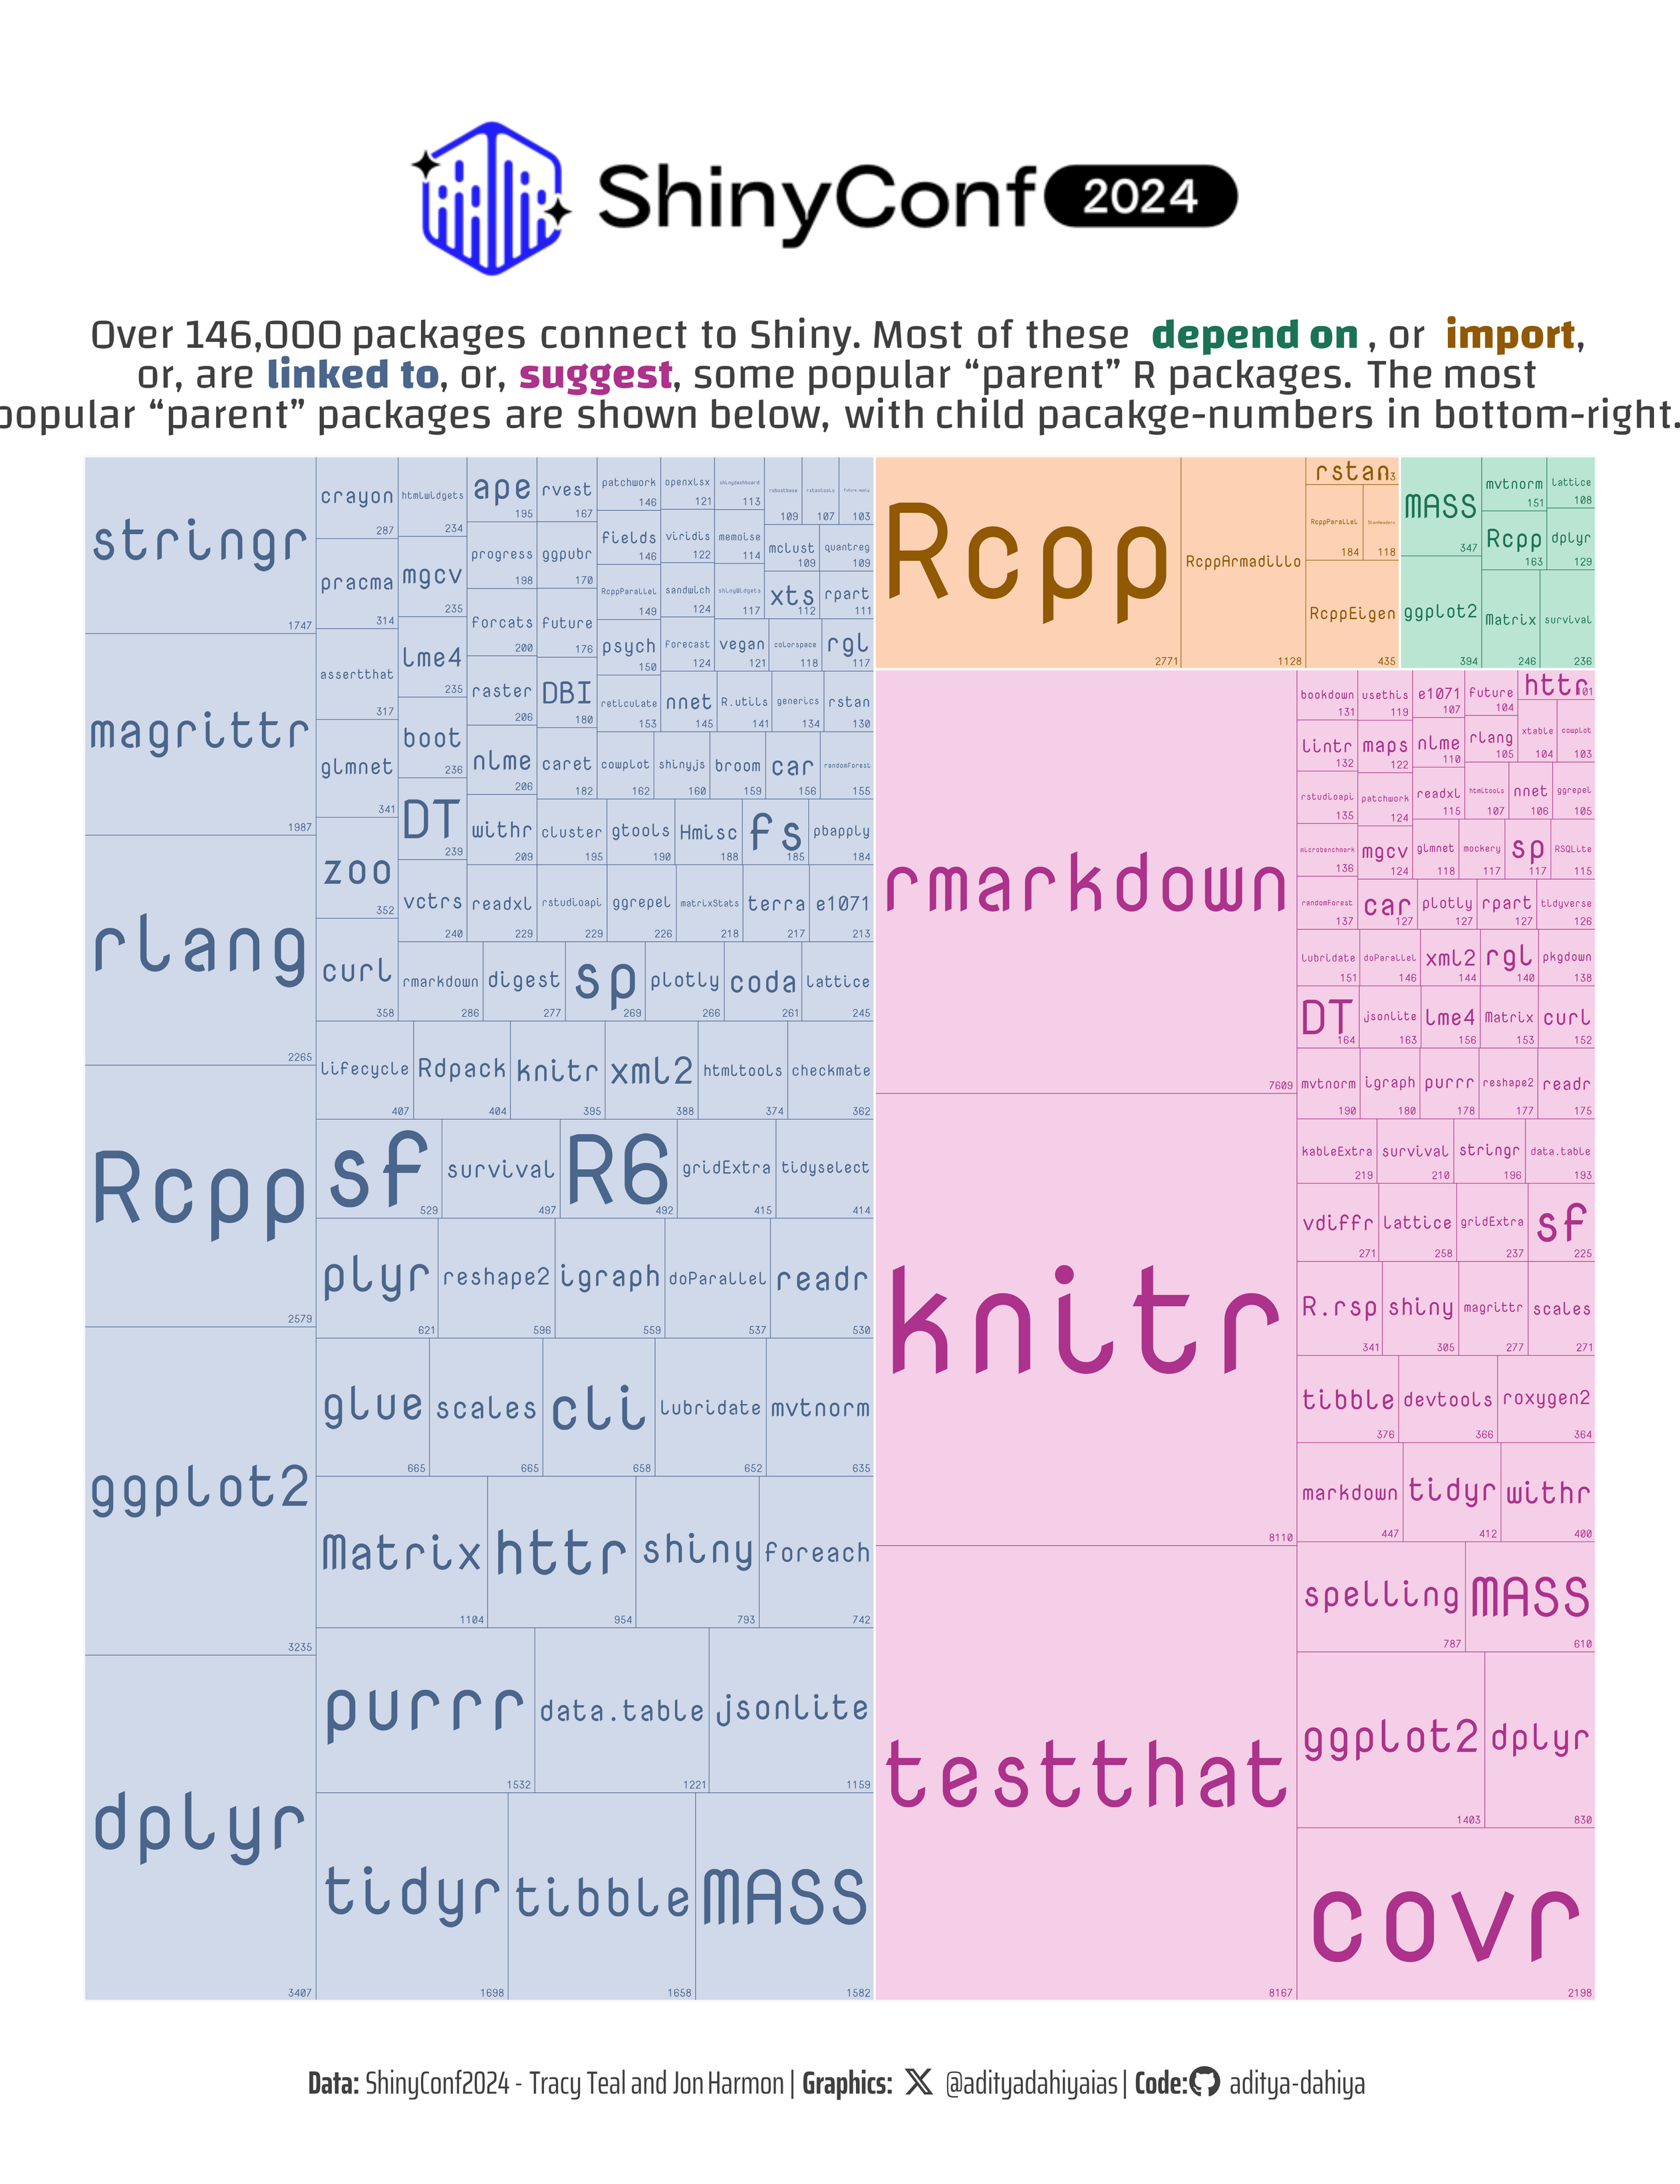
#TidyTuesday @ShinyConf How are packages linked to @Posit's {shiny}. For linked packages, the most popular imports are #dplyr & #ggplot2. Most common suggestions are #testthat, @rmarkdown and #knitr.
Data: #ShinyConf2024, @tracykteal & @jonthegeek
Code🔗https://tinyurl.com/tidy-shny
Tools: #rstats #ggplot2 #treemapify
Client Info
Server: https://mastodon.social
Version: 2025.04
Repository: https://github.com/cyevgeniy/lmst