I became a U.S. citizen this past Friday. I wrote a thing about it.
Justin Lind
Staff at Stanford University, interested in Data Viz, Perception, Color, and Music.
Keyboardist for the alternative rock band Midnight Bake Sale (@MidnightBakeSale)
Also a sucker for Fine Arts broadly construed. #ADHD
Justin Lind boosted:
Overall, some good #DataViz in the 2025 Summary Report on US Bicycling from PeopleForBikes
https://www.peopleforbikes.org/news/u.s.-sees-steady-progress-toward-improved-bicycling
Justin Lind boosted:
> On November 28th, 2012, Randall Munroe published an xkcd comic that was a calendar in which the size of each date was proportional to how often each date is referenced by its ordinal name (…) "In months other than September, the 11th is mentioned substantially less often than any other date. It's been that way since long before 9/11 and I have no idea why." After digging into the raw data, I believe I have figured out why.
Justin Lind boosted:
Brilliant animation for the Beethovens 5th!
#music #classicalmusic #beethoven #animation
Justin Lind boosted:
An intersection between 'Jaws' and copyright in a story that made me laugh out loud a couple times at a public service desk. This made my day.
https://ironicsans.ghost.io/how-the-jaws-shark-became-public-domain/
Justin Lind boosted:
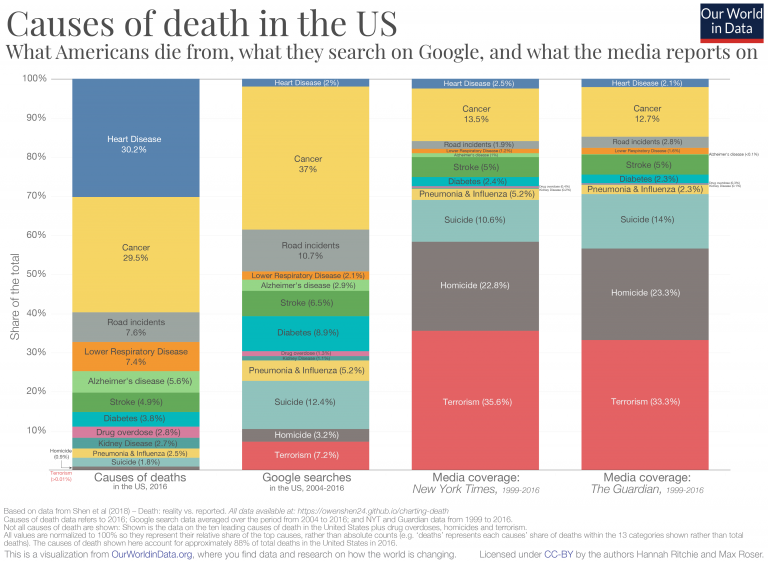
I always find this chart by Hannah Ritchie -- of Our World In Data -- deeply informative of how disjointed is our sense of personal risk
Justin Lind boosted:
This is the 100 year anniversary of humans having an idea of what the heck the sun and all the stars actually are. If you had asked a leading astronomer in 1925 what the sun was, they would say that it's basically the same as Earth, but very hot.
In Cecilia Payne's doctoral thesis she was the first to say, from spectral data, that the sun was overwhelmingly made of hydrogen and helium.
It was later described as "the most brilliant PhD thesis ever written in astronomy".
Justin Lind boosted:
The guys behind Untitled Goose Game have a new game in the works, Big Walk. This just became my most anticipated game of 2026.
House House and their publisher, @panic, are two teams that basically turn everything they touch into gold.
Justin Lind boosted:
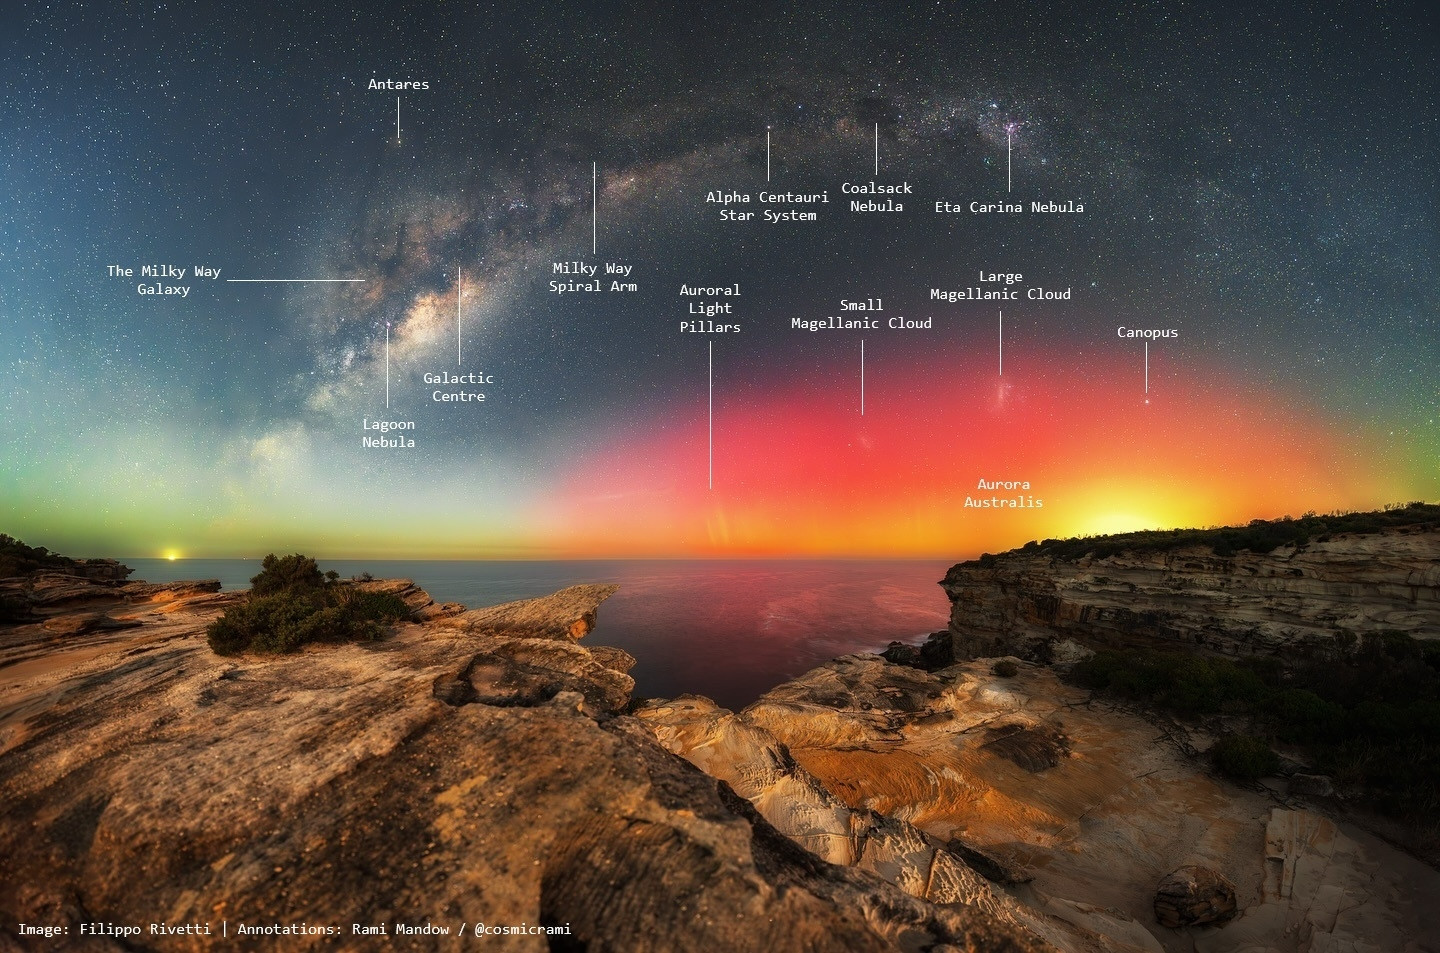
I was happy to help Filippo out and annotate the beautiful still of his image (non-annotated version sent to @apod as I really think it is worthy).
You could do so much science communication from this one image:
- galaxies (plural!)
- aurora
- stellar evolution
- nearest system
This is such a beautiful image!
Stunning work from Filippo Rivetti!
Justin Lind boosted:
Quick reminder: if you're using Google and you're tired of all the AI summaries, the `?udm=14` query param is your friend.
You can read more about it here. 👇

Justin Lind boosted:
'The Emerald Sea'
4,427 images captured by Don Pettit are processed, graded & interpolated to create this video of aurorae below ISS on April 5/6 2025 with music by Chris Zabriskie. Cropped and edited from 10m54s 4k original.
Credit: Don Pettit / ISS / NASA / ESRS / Seán Doran
@nyhan
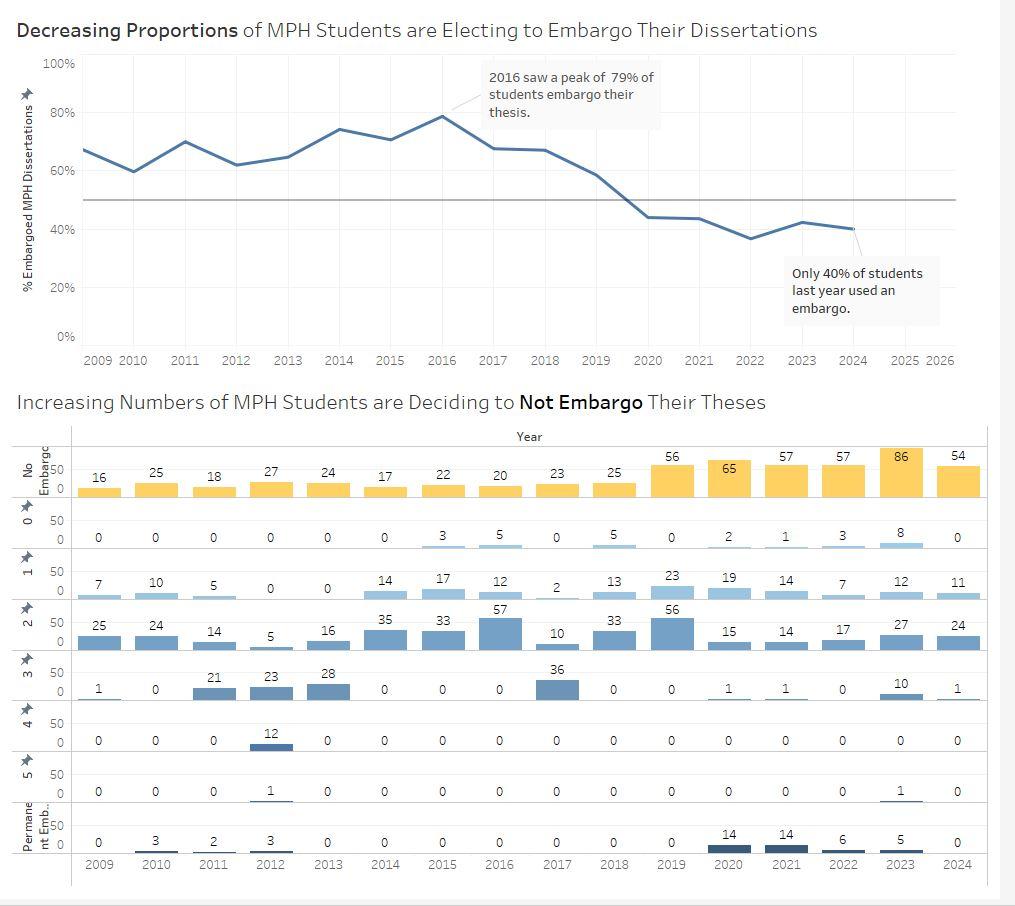
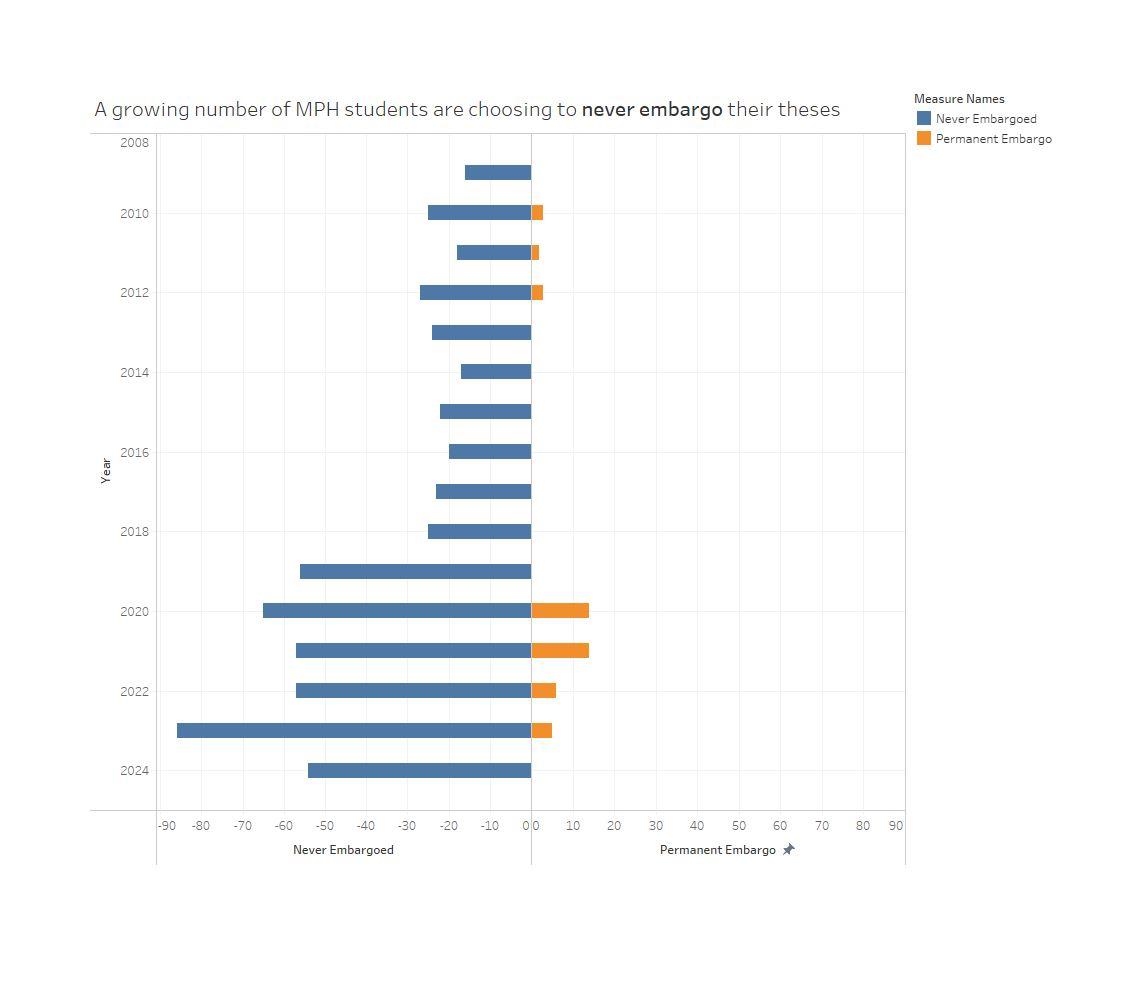
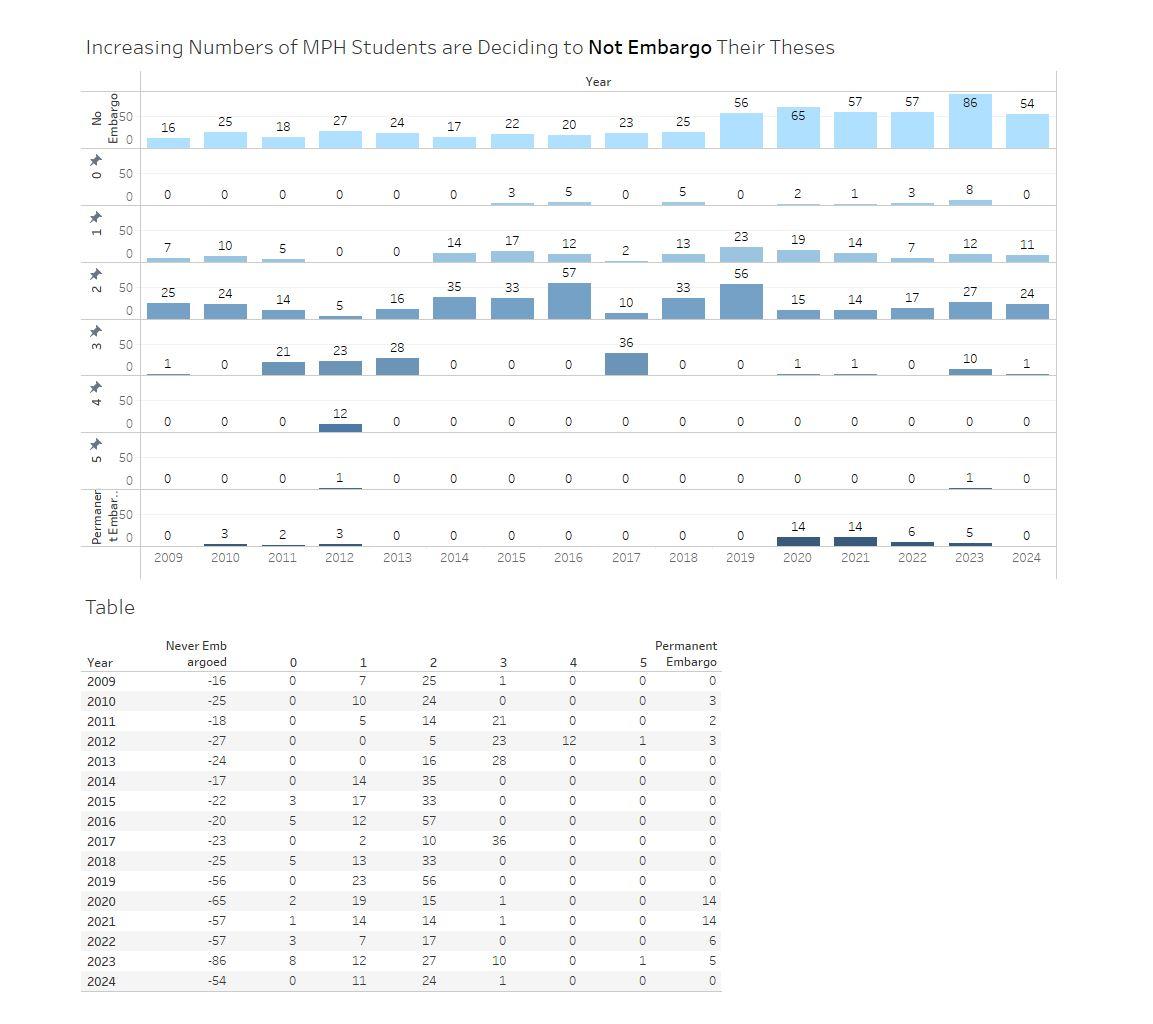
One other option would be to also add some binary "yes embargo or no embargo" data context. Because there is a strong story in the data about the proportion of students who are electing to NOT embargo their thesis at all.
@nyhan
I initially experimented with more of a vertical stacked bar chart, but I wasn't sure how to do a good job of incorporating, and showing the MAGNITUDES, of the various 1/2/3-year embargoes in between the two extremes.
I definitely think small multiples of bar charts though work better :)
@nyhan
I would definitely do some kind of small multiples...in this case, 7 bar graphs, all with the same axis, to show the amount of changes of published theses in the different years.
You could improve this with tweaking the colors more, but the basic gist of what probably works close to best is here. DM me if you want me to send you the Tableau workbook.
Justin Lind boosted:
Excellent (of course) by Jamelle Bouie.
Gift link:
Trump Is Waging War on the Future https://www.nytimes.com/2025/05/21/opinion/trump-maga-movement-future.html?unlocked_article_code=1.I08.AuJu.W7Uf5uTjEMHv&smid=tw-share
Justin Lind boosted:
A migraine is no ordinary headache. It’s a full-body experience, but it’s possible to stop an attack in its tracks – as long as you do it early enough.
https://tcnv.link/I07fBep
Justin Lind boosted:
This is what we get when the federal government FUNDS SCIENCE. These kinds of amazing advances and lifesaving technologies are what we are at risk of losing under the current administration.
Justin Lind boosted:
Mastering typefaces and fonts in #rstats has always been harder than it should.
I have tried to collect much of my relevant knowledge in this deep-dive blog post so you can spend your time picking the right typeface instead of cursing at the computer
I’ve always wanted to go to this music venue in Berlin:
https://www.konzertfluegel.com/N_konzerte.html
They regularly have truly world-class musicians, and the general atmosphere of the place seems really great as well.
Justin Lind boosted:
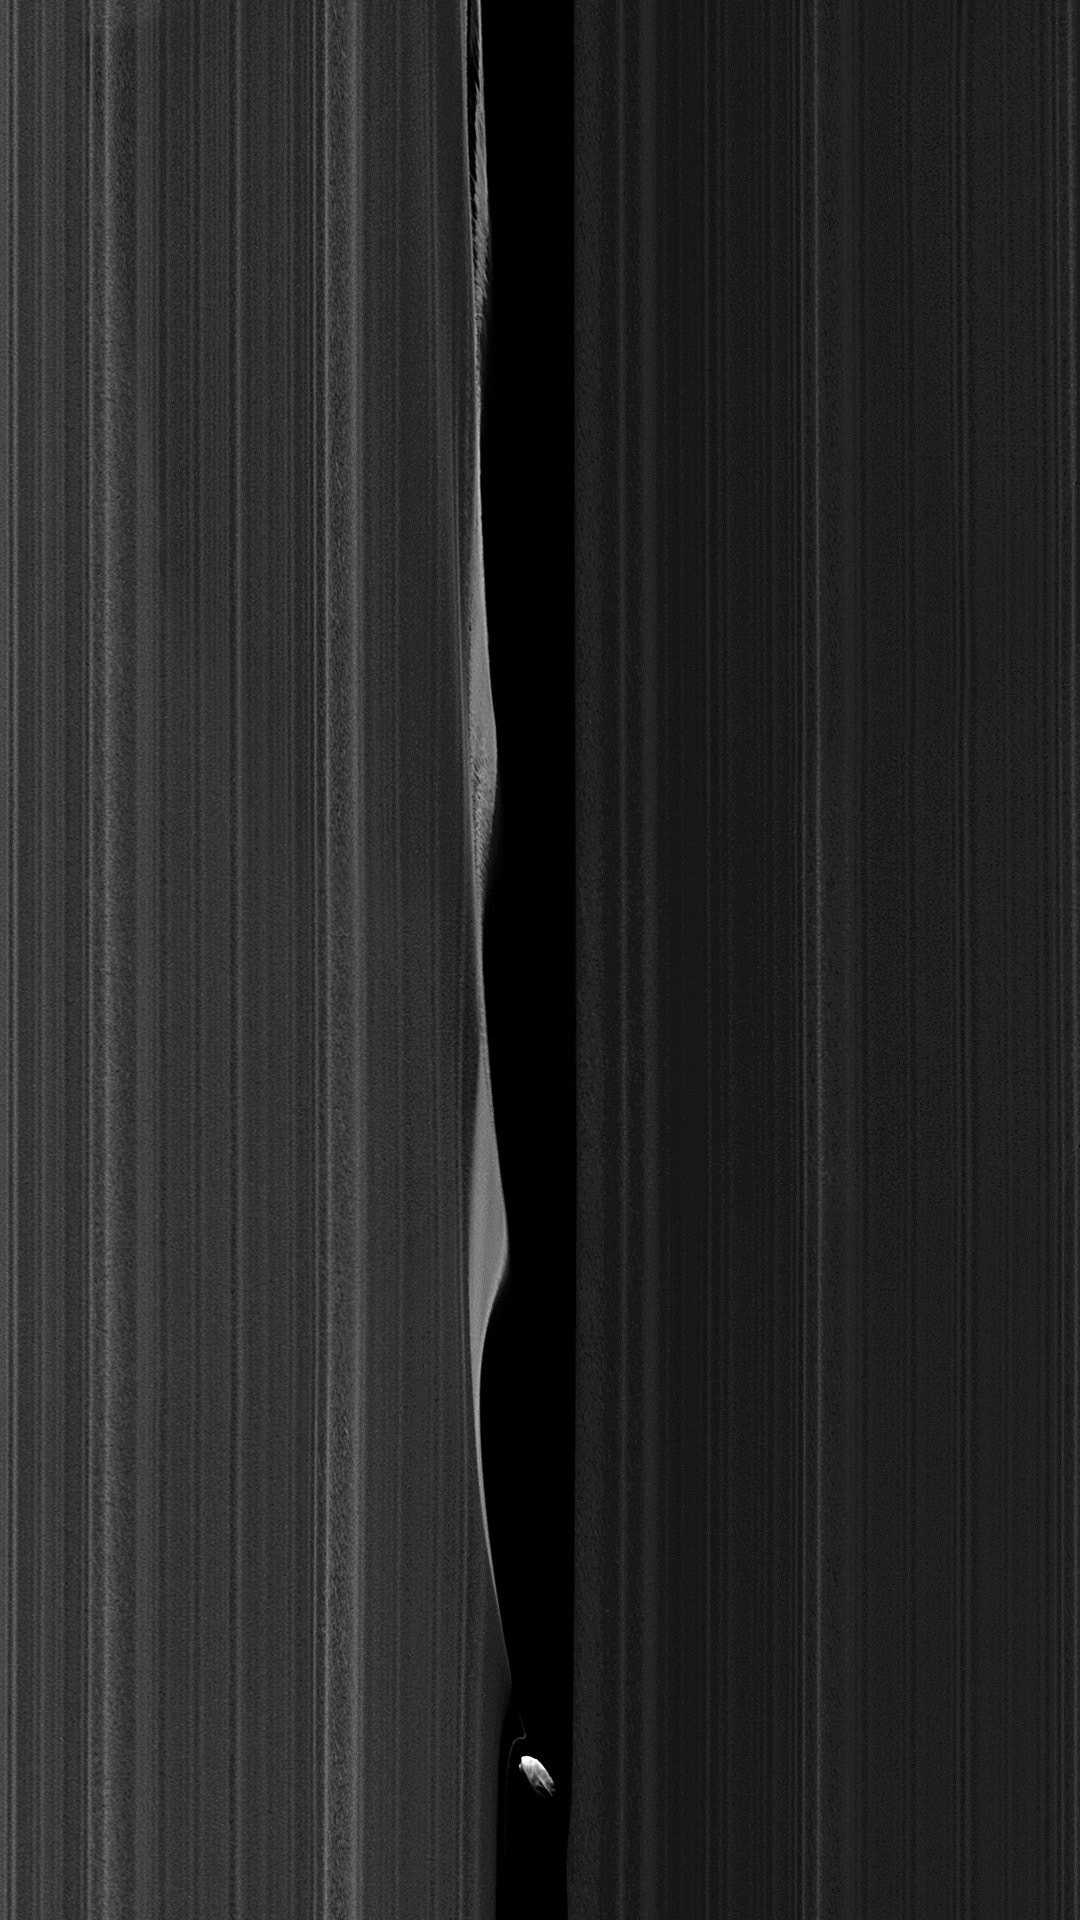
Now here is a really *great* actual photo of Daphnis and the ripples it creates in Saturn's rings!
It was taken by the Cassini probe and released in February 2017. It was taken in visible light using Cassini’s narrow-angle camera. Cassini was 28,000 kilometers away from Daphnis, and the image scale is 168 meters per pixel.
https://www.esa.int/About_Us/ESAC/Saturn_s_moon_Daphnis_in_the_Keeler_Gap
What other really good photos can we find?
(4/n)
Client Info
Server: https://mastodon.social
Version: 2025.04
Repository: https://github.com/cyevgeniy/lmst