Honeybadger.io

Honeybadger is an application health monitoring tool built by developers for developers. We give you everything you need to keep production happy—and nothing you don't.

Recently moved from ruby.social/@honeybadger

2025-05-21

Partitioning splits huge tables into smaller, more manageable chunks, reducing bloat and improving performance. Honeybadger's pg_partition_manager gem automates creating and pruning time-based partitions in Rails, so maintenance is hands-off.

Here's a walkthrough from Honeybadger co-founder Ben Curtis.

honeybadger.io/blog/pg-partiti

#Ruby #RubyOnRails #Postgres #Datebase #PostgreSQL

2025-05-15

Deploying and managing a high-availability Django app isn't easy, but Amazon's Elastic Beanstalk platform can help. Here's how to get started.

honeybadger.io/blog/deploying-

#Python #Django #AWS #ElasticBeanstalk #DevOps

2025-05-07

Mutators. Accessors. Casts. What do Laravel devs mean when they use those terms? 🧐

honeybadger.io/blog/custom-lar

#PHP #Laravel

Honeybadger.io boosted:
2025-04-30

🔥 NEW in Honeybadger: Performance monitoring for Elixir, Phoenix, and Oban

Our new automatic dashboards capture Elixir telemetry automatically while giving you direct access to transform, query, and alert on the underlying data—no black boxes, just total visibility.

honeybadger.io/blog/elixir-per

#ElixirLang #MyElixirStatus

Honeybadger.io boosted:
2025-04-28

Honeybadger proves what a small, scrappy Rails team can achieve: a profitable, developer-first company WITHOUT VC funding. 💫

Their story demonstrates the power of Rails, developer happiness, and community.

You can catch the Honeybadger team at #RailsConf 2025 in Philly this summer, where they’ll be sponsoring and celebrating with the community that helped them get started! 💙 rubycentral.org/news/company-s

Honeybadger.io boosted:
2025-04-18

"For me, the answer is no — Rails 8 doesn’t remove the value proposition of platforms. I’d rather focus on my app and let a platform like Heroku handle the infrastructure."

New article by Jeffery Morhous

honeybadger.io/blog/rails-no-p

#Ruby #RubyOnRails #DevOps #Kamal #Heroku #Deployment

2025-04-17

"For me, the answer is no — Rails 8 doesn’t remove the value proposition of platforms. I’d rather focus on my app and let a platform like Heroku handle the infrastructure."

New article by Jeffery Morhous

honeybadger.io/blog/rails-no-p

#Ruby #RubyOnRails #DevOps #Kamal #Heroku #Deployment

2025-03-28

From the changelog: Here's a quick way to find events for a specific request when exploring your data in Honeybadger.

honeybadger.io/changelog/insig

#Monitoring #Observability #DevOps #SoftwareDevelopment

2025-03-26

Every Rails app has a breaking point. Do you know yours? Learn how to load test your Rails application with Apache JMeter.

honeybadger.io/blog/rails-load

#Ruby #RubyOnRails #LoadTesting #Performance #JMeter

2025-03-21

Here's a throwback! Learn all about UUIDs in this classic article by Starr Horne.

honeybadger.io/blog/uuids-and-

#Ruby #RubyOnRails #UUID #ULID

2025-03-17

Have you ever looked at an error in your Laravel app and wished it had more context? Learn how to debug your applications faster with HB's breadcrumbs feature.

honeybadger.io/blog/laravel-br

#PHP #Laravel #Debugging #ErrorTracking

Honeybadger.io boosted:
2025-03-14

Join us on March 25, 2025 at 12 Eastern to hear from expert Career Coach and CEO Rachel Serwetz!

In this talk, Rachel Serwetz will deep dive into what networking really means and doesn’t mean, how to make it comfortable and strategic for you, who to reach out to, what to do once you connect, how to follow up, and so much more.

Bring all of your career questions for an AMA at the end!
Learn more about WOKEN here: iamwoken.com.

#online #meetup #networking #career #coach

WNB.rb logo in corner, a purple butterfly with WNB.rb to the right. Deep Dive into all things networking. Date: Tuesday, March 25th. 12 pm eastern. Rachel Serwetz. Ceo & Career Coach. iamwoken.com. Join Us! wnb-rb.dev
Honeybadger.io boosted:
2025-03-14

We added Cursor, Windsurf, and Zed to the list of supported local editors in user settings.

This allows you to open files from HB's error backtrace and jump directly to the affected line in your editor.

honeybadger.io/changelog/curso

#Monitoring #DevOps #Observability #Debugging #ErrorTracking

A user profile settings page displaying the "Local Editor Setup" configuration. The left sidebar shows various settings categories including Profile, Accounts, Authentication, and others, with "Local Editor" currently selected. The main panel shows settings for user@example.com, explaining that providing local editor details enables special links in backtraces that open files at specific lines. The "Default editor" field shows "Cursor" with a dropdown menu open displaying multiple editor options including Atom, BBEdit, Visual Studio Code, and others, with "Zed" currently checked. Below are fields for "Project" (showing "Monolith") and "Absolute Local Path" with a placeholder example. A note indicates that Sublime and Visual Studio Code require installing an app.
2025-03-13

We added Cursor, Windsurf, and Zed to the list of supported local editors in user settings.

This allows you to open files from HB's error backtrace and jump directly to the affected line in your editor.

honeybadger.io/changelog/curso

#Monitoring #DevOps #Observability #Debugging #ErrorTracking

A user profile settings page displaying the "Local Editor Setup" configuration. The left sidebar shows various settings categories including Profile, Accounts, Authentication, and others, with "Local Editor" currently selected. The main panel shows settings for user@example.com, explaining that providing local editor details enables special links in backtraces that open files at specific lines. The "Default editor" field shows "Cursor" with a dropdown menu open displaying multiple editor options including Atom, BBEdit, Visual Studio Code, and others, with "Zed" currently checked. Below are fields for "Project" (showing "Monolith") and "Absolute Local Path" with a placeholder example. A note indicates that Sublime and Visual Studio Code require installing an app.
2025-03-12

New on the HB dev blog:

By leveraging a SQL database for caching, Solid Cache enables Rails applications to store a greater volume of data for extended periods, overcoming the limitations imposed by the cost and capacity of memory storage.

Read the article: honeybadger.io/blog/solid-cach

#Ruby #RubyOnRails #SolidCache #SQL #Caching

2025-03-11

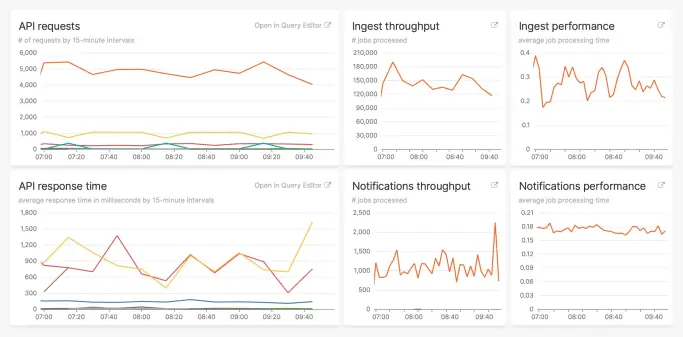
In Honeybadger, everything is an event. Application errors, logs, telemetry data? All events. While we provide simple APM-style (Application Performance Monitoring) views on top of these events, we also give you direct access through our advanced query engine in Honeybadger Insights. 2/

Six performance metric graphs for a web application: "API requests" shows stable request counts, "API response time" fluctuates with spikes, "Ingest throughput" varies with an upward trend, "Ingest performance" has peaks under 0.4 seconds, "Notifications throughput" demonstrates volatility, and "Notifications performance" maintains a steady average time around 0.18 seconds, all over 15-minute intervals. Options to edit queries suggest customizable monitoring.
2025-03-11

New feature! Introducing Insights Alarms:

Alarms bridge the gap between data and action, transforming application events into actionable alerts that notify your team. Just write a query, set a threshold, and stay ahead of issues before they impact users. 1/🧵

honeybadger.io/blog/introducin

#Monitoring #Observability #DevOps #PerformanceMonitoring #Logging #DevTools

2025-03-11

Today, we’re building on this foundation with a new feature called Insights Alarms. Alarms allow you to combine a query (“count all slow requests in the past five minutes”) with a threshold (”when count is > 2”) and trigger alerts when the query result exceeds the threshold. 5/

A monitoring dashboard titled "Slow requests" showing system performance over time. The status shows "ok" with "Checked 5 min ago - Next in < 1 min". The time range displays "1h" to "now" in PST timezone. The line graph shows no slow requests from 08:20 to 08:55, then a sharp increase at 09:00 to 1, peaking at 09:05 with a value of 3 (marked by a red dashed threshold line), then decreasing to 2 by 09:10. The timeline at the bottom shows mostly green status with a red segment around 09:05, indicating a brief period of performance issues.

Client Info

Server: https://mastodon.social
Version: 2025.04
Repository: https://github.com/cyevgeniy/lmst