#Cartogram

Stuart :progress_pride:slowe@mastodon.me.uk
2025-05-20

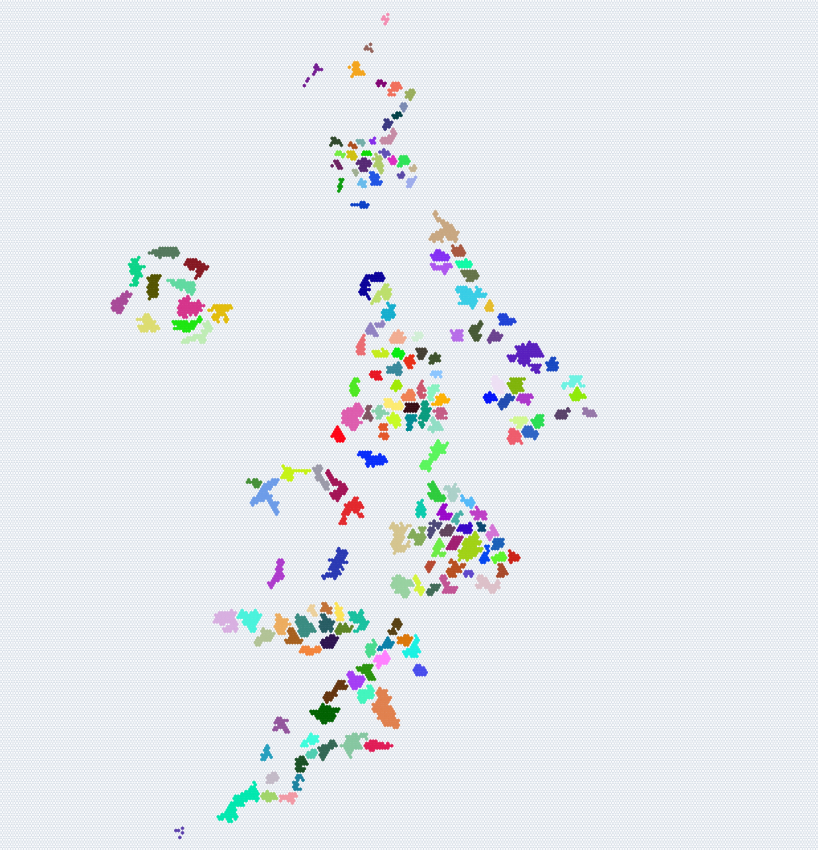
Been creating more constituency-based maps/datasets.

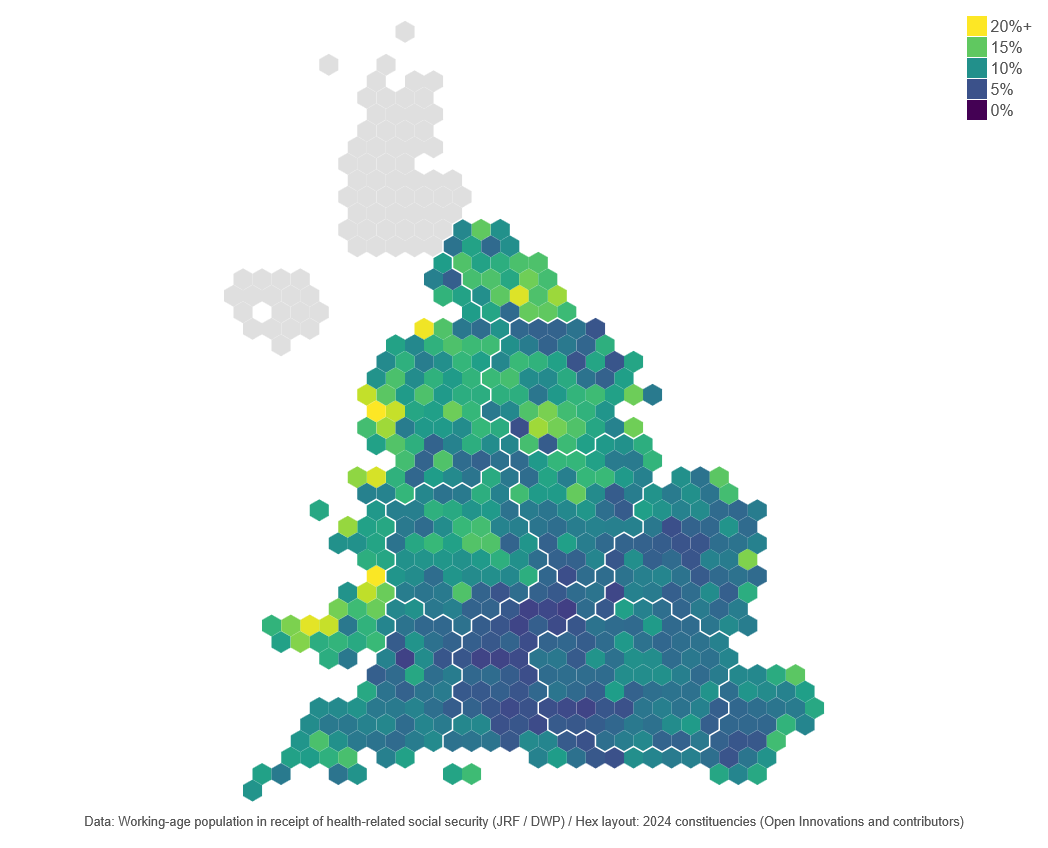
Here's the JRF's analysis of the proportion of the working-age population in receipt of health-related social security: constituencies.open-innovation

#dataviz #UKpol #cartogram

A hex cartogram of UK constituencies. The English and Welsh ones are coloured by the percentage of the working-age population in receipt of health-related social security. The scale goes up to "20%+". The parts of the country with proportions reaching 20% are in the North West, North East, Wales and bits of south Yorkshire. Exceptions in the south of England include Clacton and some other coastal constituencies.
Stuart :progress_pride:slowe@mastodon.me.uk
2025-05-08

How the unemployment rate has changed from March 2019 to March 2025: constituencies.open-innovation
#cartogram #hexmap

Hex cartogram of UK constituencies. Unemployment is generally higher everywhere other than the South East and East of England. It is highest in parts of Birmingham, then the North East, and North West. The highest rate is 8% in Birmingham Perry Barr.Hex cartogram of UK constituencies. In March 2025, unemployment has risen in most places. It is highest in Birmingham and parts of Bradford. The highest rate is 16.3% in Birmingham Perry Barr. Nine constituencies are over 10%.
Stuart :progress_pride:slowe@mastodon.me.uk
2025-05-06

I've attempted to create a hex map showing the number of NHS (equivalent) dentists by constituency for the whole of the UK: constituencies.open-innovation This adds in data for Scotland and Northern Ireland.

#cartogram #hexmap #ukpol #dentists

A hex cartogram of UK constituencies coloured by the number of NHS (or Public Health Scotland, or Health Social Care Northern Ireland) dentists. The colour scale goes from 0 to 30+. Parts of central and north west London, Northern Ireland, and Scotland have more dentists per constituency. The Cities of London and Westminster have 36 NHS dentists, Glasgow North has 33, Belfast South and Mid Down has 31. Stoke-on-Trent South, South Northamptonshir, and South Norfolk only have 5 dentists.
2025-05-03

A pair of cartograms from the 1906 UK General Election. Seen framed on the wall of Bromley House Library.

#OldMaps #Cartogram #Psephology #1906GeneralElection

A cartogram of the composition of the parliament of the United Kingdom of Great Britain and Ireland prior to the 1906 General Election ("the administration of Mr Balfour").

Each constituency is shown as a square of constant size roughly located in a geographically accurate position so that the end result is a recognisable map of Britain and Ireland.. Squares are coloured according to political party (e.g., blue for Conservative, red, apparently, for the Liberals).

Great Britain is predominantly blue hued, as is what is now Northern Ireland. Most of Ireland returned Irish Nationalosts, shown with a greenish colour.A cartogram of the composition of the parliament of the United Kingdom of Great Britain and Ireland after the 1906 General Election ("the administration of Mr Cambell-Bannermann").

Each constituency is shown as a square of constant size roughly located in a geographically accurate position so that the end result is a recognisable map of Britain and Ireland.. Squares are coloured according to political party (e.g., blue for Conservative, red, apparently, for the Liberals, yellow for Labour).

Great Britain is predominantly a mix of red and yellow, blue still dominates inis what is now Northern Ireland. Most of Ireland returned Irish Nationalists, shown with a greenish colour.
Stuart :progress_pride:slowe@mastodon.me.uk
2025-05-01

I made a hex map of dentists by constituency (England & Wales): constituencies.open-innovation

The NHS data file doesn't seem to say which of the NHS dentists are accepting new NHS patients though.

#cartogram

Stuart :progress_pride:slowe@mastodon.me.uk
2025-04-11

After doing the East of England and getting Lon-done, I've started arranging ward hexes for a few local authorities in the South East. But I'm tired.

Do any fans of wards (or cartograms) from the South East want to help by arranging some of those local authorities?

If so, here's the link for arranging hexes open-innovations.org/projects/

It can be useful to have my ward map visible on your screen too open-innovations.github.io/uk-

#hexmap #cartogram

A hex cartogram being built. Some local authorities appear as contiguous groups. The rest of the ward hexes are spread around placed relative to their geography.
Stuart :progress_pride:slowe@mastodon.me.uk
2025-04-02

I've made a hex map of candidate spending during the 2024 UK General Election using data that was published by the Electoral Commission constituencies.open-innovation

#ukpol #hexmap #cartogram

Stuart :progress_pride:slowe@mastodon.me.uk
2025-04-01

A colleague has created a constituency hex map showing transport stops (bus stops, tram/metro stops, and train stations) using NaPTAN: constituencies.open-innovation

The tram/metro visualisation is also pulling out tourist lines e.g. Snowdon mountain railway and Scarborough tramway.

#hexmap #cartogram

Stuart :progress_pride:slowe@mastodon.me.uk
2025-03-27
Stuart :progress_pride:slowe@mastodon.me.uk
2025-03-27
Nicolas Lambert 🌏neocarto@vis.social
2025-03-17

One day one map
Football

Source: Mad Maps 2019
#Cartography #Football #Cartogram

Cartographe encarté 🔻cartococo@piaille.fr
2025-03-17

Un jour une carte
Football

Source : Mad Maps 2019
#Cartographie #Football #Cartogram

Gregor Aischgka@vis.social
2025-02-28

For the German election we wanted to use a cartogram of election districts but didn't find anything good, so we created our own. Here's a little nerd thread how the final algorithm worked 🤓 🧵 #gis #cartogram #election #datavis #cartography

Cartogram of 299 German election districts
Stuart :progress_pride:slowe@mastodon.me.uk
2025-01-09

Well that's a first draft of the West Midlands ward hexes done: open-innovations.org/projects/

Anybody else fancy taking on the East Midlands, East Anglia, London, or the South West? Or just specific local authorities? github.com/open-innovations/uk
#hexmaps #cartogram #uklocalgov

Hexagons representing UK wards arranged in groups by local authority. Includes Scotland, Northern Ireland, Wales, North West, North East, Yorkshire & The Humber, West Midlands and South East with local authority groups placed roughly where they would be geographically.
Stuart :progress_pride:slowe@mastodon.me.uk
2025-01-08

If nobody else is, I guess I should look into arranging the ward hexes of the West Midlands then: github.com/open-innovations/uk
#uklocalgov #hexmaps #cartogram

Murray GM - PaperpostsPaperposts@zirk.us
2024-07-05

Disappointed with the BBC online election coverage, no auto refreshing on the results (instead kept the exit poll data front and center 🤦‍♂️ ), the app was full of endless circular navigation traps and dead ends (disorientating). Ended up using the guardian, clean, simple results site (thanks @stewf )

Checked the bbc #cartogram today. Whose seats are these? That's not the Labour red. I get that the 'soft' red is probably an accessibility issue but at least change the legend too. #dataviz

Screenshop of a cartogram map of UK election results. The background is mostly reddish hexagons, with 1 selected saying Bolton North East. In the foreground there is a key, showing the colours and the parties they stand for.
2024-07-01

Via Metadaten konnte ich diesen Artikel wiederfinden:
Die Weltpopulation größenrichtig kartiert gibt es bei #Worldmapper
worldmapper.org/the-human-plan
Das ist keine einheitliche Projektion, sondern eine #Kartenanamorphote de.m.wikipedia.org/wiki/Karten (englisch: #cartogram != DE Kartogramm) - in diesem Fall spezieller eine #Isodemografische Karte de.m.wikipedia.org/wiki/Isodem weil die Population dargestellt ist.
#GIS

Client Info

Server: https://mastodon.social
Version: 2025.04
Repository: https://github.com/cyevgeniy/lmst