#ClimateMythRebuttal

2024-06-20

"Was 1934 the hottest year on record?"

No. Even if it had been true, events we've precipitated have overtaken this old #ClimateMyth, which found its roots in a peculiar set of circumstances.

This statistic was -always- irrelevant in the big picture:

"Zooming out of the USA - making up around 2% of the world's surface - to the whole globe, however, shows that 1934 was in fact a rather chilly year."

Finito. Done and dusted.

We've revised this #ClimateMythRebuttal.
skepticalscience.com/1934-hott

Global temperature anomaly map for year 1934, showing unusual warmth over much of North America and most of the Arctic. The remainder of the planet is neutral to cool compared to the long term record. 

Source NASA.
2024-05-17

What's the difference between the Little Ice Age and anthropogenic global warming?

Why doesn't the Little Ice Age (LIA) exculpate us from our climate oops?

Key terms: "little" and "global." Climate forcings acting together can produce powerful effects, but none so muscular as us.

We've updated our #ClimateMythRebuttal for this fizzled #ClimateBunk, now with at-a-glance treatment. Does it make sense? Let us know via the conveniently provided form at the article.

skepticalscience.com/coming-ou

Screen capture of Skeptical Science climate myth rebuttal for "What ended the Little Ice Age."
2024-05-09

This week's #ClimateMythRebuttal refresh might be considered an appendix to last week's treatment of "hide the decline," a full explanation of the dendrochronological roots of the #Climategate fiasco. Critiques welcome!

There's basic irony in play here, given that recent divergence of tree growth from what's been typical for millennia seems to be our fault, while #ClimateScienceDeniers were going into a positive lather over a juicy pull-quote from stolen emails.

skepticalscience.com/Tree-ring

Screen capture of Skeptical Science article "Tree-ring proxies and the divergence problem."
2024-05-05

Sound and fury signifying nothing and called #Climategate erupted 15 years ago, back when coastal flooding was less of a nuisance, alpine glaciers were larger and old temperature records still held.

If we had perfect instrumentation we could probably measure Climategate's success in making things a bit worse today. Procrastination was always Climategate's destination-- and here we are, warmer than need be.

We've updated this #ClimateMythRebuttal; reviews welcome!

skepticalscience.com/Mikes-Nat

Skeptical Science climate myth rebuttal for "Climategate" captured as a screenshot.
2024-04-25

Like a falling calendar leaf in a vintage cinematic calendar montage, here's our weekly release of rolling #ClimateMythRebuttal revisions.

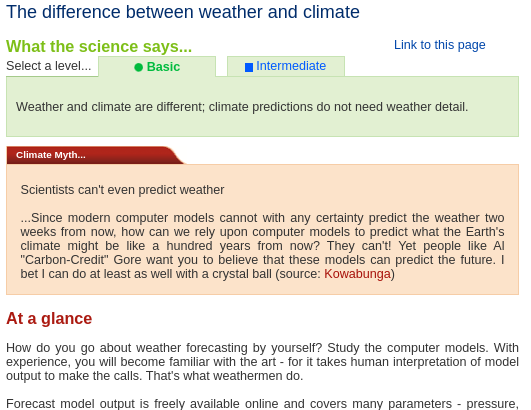
This time it's about confusing climate models with weather prediction. Despite claims to the contrary, imperfect weather prediction skill does not speak to #ClimateModel validity.

Even less helpfully for climate model detractors, with steadily increasing skills climate models are showing distinct promise with seasonal climatic prediction duties.

Screen capture of Skeptical Science climate myth rebuttal "The difference between weather and climate."
2024-04-17

Not only is human-caused #ClimateChange settled science by consensus of experts on climate itself, but signals of consilience confirming accidental climate change abound via indirectly related fields of inquiry.

Still, politicians and other "thought leaders" fall back on "science doesn't really know" when discussing our climate mess- the laziest reply.

Updated: our explanation of how science "knows" who owns climate change. Opinions solicited!

#ClimateMythRebuttal

skepticalscience.com/settled-s

Graph showing monotonic long term upward trend of Earth surface temperature since ca. 1900, via four different observational data analyses. 

From Skeptical Science rebuttal to "Science isn't settled on climate change, " captioned:

 "The latest temperature anomalies from four leading datasets, relative to a 1951-1980 baseline. The trend continues upwards and upwards. Graphic: Realclimate."
2024-04-10

The PDO, or Pacific Decadal Oscillation is not responsible for global warming, as plainly indicated by "oscillation."

Oscillations don't produce monotonic trends, one-way movement. But this hasn't stopped #ClimateScienceDeniers working on behalf of the multi-trillion dollar fossil fuel industry from trying to confuse the public with the PDO.

We've updated our #ClimateMythRebuttal on the PDO, adding our new at-a-glance treatment. As always, feedback is welcome!

skepticalscience.com/Pacific-D

Two graphs illustrating Earth surface temperature anomaly and Pacific Decadal Oscillation (PDO) index, 1880 to 2020. 

While surface temperature steadily trends upward, the PDO index wavers around a baseline, as expected of an oscillatory effect. 

From the Skeptical Science rebuttal against claims that global warming is an outcome of the PDO. 

Captioned:

"Top-panel: global temperature anomaly 1850-2023. Graphic: Realclimate. Bottom-panel: Pacific Decadal Oscillation index, 1880-2023. Smoothed data (thicker black line) included. Graphic: NOAA."Two graphs illustrating Earth surface temperature anomaly and Pacific Decadal Oscillation (PDO) index, 1880 to 2020. 

While surface temperature steadily trends upward, the PDO index wavers around a baseline, as expected of an oscillatory effect. 

From the Skeptical Science rebuttal against claims that global warming is an outcome of the PDO. 

Captioned:

"Top-panel: global temperature anomaly 1850-2023. Graphic: Realclimate. Bottom-panel: Pacific Decadal Oscillation index, 1880-2023. Smoothed data (thicker black line) included. Graphic: NOAA."
2024-04-06

#ClimateChangeDenial variations on a theme of variability: "it's natural cycles."

Many cyclic influences control climate, spanning from millennia to months. Normal wavering is ideal fodder for deceiving the public.

We're seeing the combined influence of the El Niño Southern Oscillation -and- human-caused climate change right now. Which "wins?"

We've updated our #ClimateMythRebuttal on a statistical deceit for hiding the obvious secular trend of #GlobalWarming.

skepticalscience.com/el-nino-s

Graph showing annual temperature anomalies, coded by February-March El Niño Southern Oscillation (ENSO) records. 

Captioned:

"Variations in ENSO in a warming world. This plot therefore shows two independent phenomena that affect climate: the noisy ENSO and the underlying relentless upward climb in temperatures caused by our rapidly-increasing emissions of CO2 and other greenhouse gases. Temperature records typically get broken in El Nino years because the temperature is given an extra boost. 2016, a major El Nino year, held the global temperature record for a few years, but 2023 saw that record fall again. Graphic: Realclimate."
2024-04-01

Refreshed with our at-a-glance treatment: "Human fingerprints on climate change rule out natural cycles."

This #ClimateMythRebuttal addresses #ClimateDisinformation centered on "climate's always changing," misdirection leading to various inapplicable truths. Orbital forcings, ENSO and the PDO and flood basalts are a few exculpated #ClimateChange truths-- none matter now.

The "it's cycles" truth that matters in our current predicament: we've broken the carbon cycle.

skepticalscience.com/global-wa

Graph of global surface temperature anomaly and Pacific Decadal Oscillation  (PDO) index, showing a secular upward trend in global surface temperature while PDO dithers around a mean. 

From the Skeptical Science rebuttal of the climate change myth "it's only natural cycles."

Captioned: "Pacific Decadal Oscillation index (blue - University of Washington) versus Global Temperature Anomaly (Red - GISS Temp)."
2024-03-15

Taking all sources together, the long term overall trend of Earth's albedo is that of darkening, in part a positive feedback of warming.

This doesn't stop mental magicians such as the notorious Anthony Watts from inventing whatever story is necessary for confusing the public, including putting an opposite sign on albedo's trend.

In reality several factors are leading to decreased albedo.

Feedback (+ or - !) on our update of this #ClimateMythRebuttal appreciated!

skepticalscience.com/earth-alb

Graph from Skeptical Science climate myth rebuttal treating the trend of Earth albedo, the relative reflectance of Earth to incoming light at various wavelengths.

The trend of the graph is downward, indicating that Earth is reflecting less light over time and thus absorbing more energy.

Captioned: 

 Earthshine annual mean albedo anomalies 1998–2017 expressed as reflected flux in Wm. The error bars are shown as a shaded grey area and the dashed black line shows a linear fit to the Earthshine annual reflected energy flux anomalies. The CERES annual albedo anomalies 2001–2019, also expressed in Wm, are shown in blue. A linear fit to the CERES data (2001–2019) is shown with a blue dashed line. Average error bars for CERES measurements are of the order of 0.2 Wm/2. From Goode et al. 2021.
2024-03-08

Based on the proxy indicator of weekly reads, "Arctic ice melt is a natural cycle" has never been a compelling nugget of #ClimateBunk.

Perhaps this is because graphs are starkly communicative. In this case if graphs of arctic sea ice were talking loudly 15 years ago, now they're shouting-- or screaming.

We've revised this #ClimateMythRebuttal, updating and simplifying. We'd love to hear your critiques via the easy-access embedded form.

Ponder anomaly baseline data.

skepticalscience.com/Arctic-se

Graph of monthly sea ice extent anomalies (solid lines) and linear trend lines (dashed lines) for March (black) and September (red) from 1979 to 2021. The anomalies are relative to the 1981–2010 average for each month. Sourced from American Meteorological Society State of the Climate 2021.

The anomaly plots show significant decline. 

Notably but often unremarked, the anomaly baseline is computed from data including only the period of decline, minimizing or hiding the true magnitude of ice loss.
2024-02-22

"Was Greenland really green?" It's not exactly uppermost in everybody's minds but even so our explanation of what _really_ happened in Greenland during the medieval warming period gets its modest share of reads each week. These metrics are a proxy indication of confusion.

Our skilled wordsmith John Mason has revised our #ClimateMythRebuttal dealing with the local and brief period of Greenland's hospitality to Viking settlers. We're always delighted hear critique!

skepticalscience.com/greenland

Global map showing reconstructed surface temperature anomalies for the Medieval Warm Period (950-1250) compared to a 1961-1990 reference period. (Source: Mann et al. 2009). 

Much of the world did not reflect any particular degree of warming during this time.

The southern portion of Greenland was particularly warm during the Medieval Warming Period, temporarily allowing European-style settlement, which fizzled as the climate returned to a more typical state. 

Latterday warming of Greenland caused by anthropogenic global warming will be less ephemeral.
2024-02-09

Let's take a journey through space to other worlds with #ClimateDeniers desperately seeking solace on lonely planets.

Confidently asserted while also claiming that we can't measure temperature trends here on Earth: "Mars and Jupiter are not warming, and anyway the sun has recently been cooling slightly."

Does this make sense? No, but it's still fair-to-middling in daily #ClimateMythRebuttal access at Skeptical Science.

Newly revised; critical review welcome!

skepticalscience.com/global-wa

Global temperatures plotted against total Solar irradiance, 1880-2020. Graphic: NASA-JPL/Caltech.

Since about 1960 total solar irradiance has trended down while Earth's temperature has climbed.
2024-01-10

"Is the CO2 effect saturated?"

"Irreducibly complex." Sometimes it seems true. Given the narrow infrared absorption bands of CO2, past a certain point how is it possible for more CO2 to increase impedance to infrared radiation passing through Earth's atmosphere? Reducing this "why and how" to a mentally portable payload is remarkably hard.

It's tough to convey how much discussion went into this revised #ClimateMythRebuttal. Does it work? Please tell us at the link!

skepticalscience.com/saturated

Illustration of infrared radiation interactions with varies species of gas, showing differing effects on net impedance of infrared radiation transfer  depending on gas species, depicting fundamentals of atmospheric greenhouse effect. 

Artwork by Skeptical Science Inc. volunteer John Garrett. CC BY 3.0 DEED Attribution 3.0 Unported.
2023-08-17

Among other ways, abrupt climate change is noticeable to us as "extreme weather events," called so because they're far outside of our statistical norms-- and common understanding of how normal weather should appear.

Arguments to the contrary of our scientific expectations of increasing extreme weather are being swamped by reality. Hence we've updated our coverage of a fading climate controversy. How's our new treatment? Visit, read, let us know!

#ClimateMythRebuttal
skepticalscience.com/extreme-w

Screenshot of Carbon Brief's interactive map of extreme events. A map shows global occurrences. Red icons indicate that human influence was found, blue icons where that is not the case, grey icons where it's inconclusive.

There are vastly more red icons on the map than others. 

The live map is available here:

https://www.carbonbrief.org/mapped-how-climate-change-affects-extreme-weather-around-the-world/
2023-08-12

This week we reached a bit of a landmark by publishing our 25th updated #ClimateMythRebuttal, at one per week.

When we started this project in late 2022, we had two aims:

1) update old rebuttals as necessary, incorporating recent science developments;

2) do so in a structured manner, so that routine maintenance becomes more sustainable.

It's all about climate bunk, dealing efficiently with "Brandolini's Law." What's that, and how are we tackling it? Follow the link!

skepticalscience.com/rebuttals

Metaphorical illustration of Skeptical Science climate myth "Rebuttals Refurbishment Factory," showing shelves of old rebuttals, a forklift transferring old rebuttals to an conveyor belt fashioned to spell "SkS" and staffed by various inspectors and workers, leading to trucks being loaded to move rebuttals to the wide world.

Artwork by professional graphics artist and wonderful Skeptical Science volunteer John Garrett.
2023-07-22

"'Empirical' is defined as something that may be actually measured and presented as a finding. Let's treat the topic as a criminal prosecution. The accused is CO2 and the accusation is that its increased levels through our emissions are warming the planet."

So begins our newly revised #ClimateMythRebuttal addressing "there's no empirical evidence" that adding CO2 to the atmosphere will result in warming.

Suggestions for improvements welcome, via an included form!

skepticalscience.com/empirical

Spectrum of the greenhouse radiation measured at the surface. Greenhouse effect from water vapour is filtered out, showing the contributions of other greenhouse gases (Evans et al. 2006, "Measurements of the Radiative Surface Forcing of Climate").

Client Info

Server: https://mastodon.social
Version: 2025.04
Repository: https://github.com/cyevgeniy/lmst