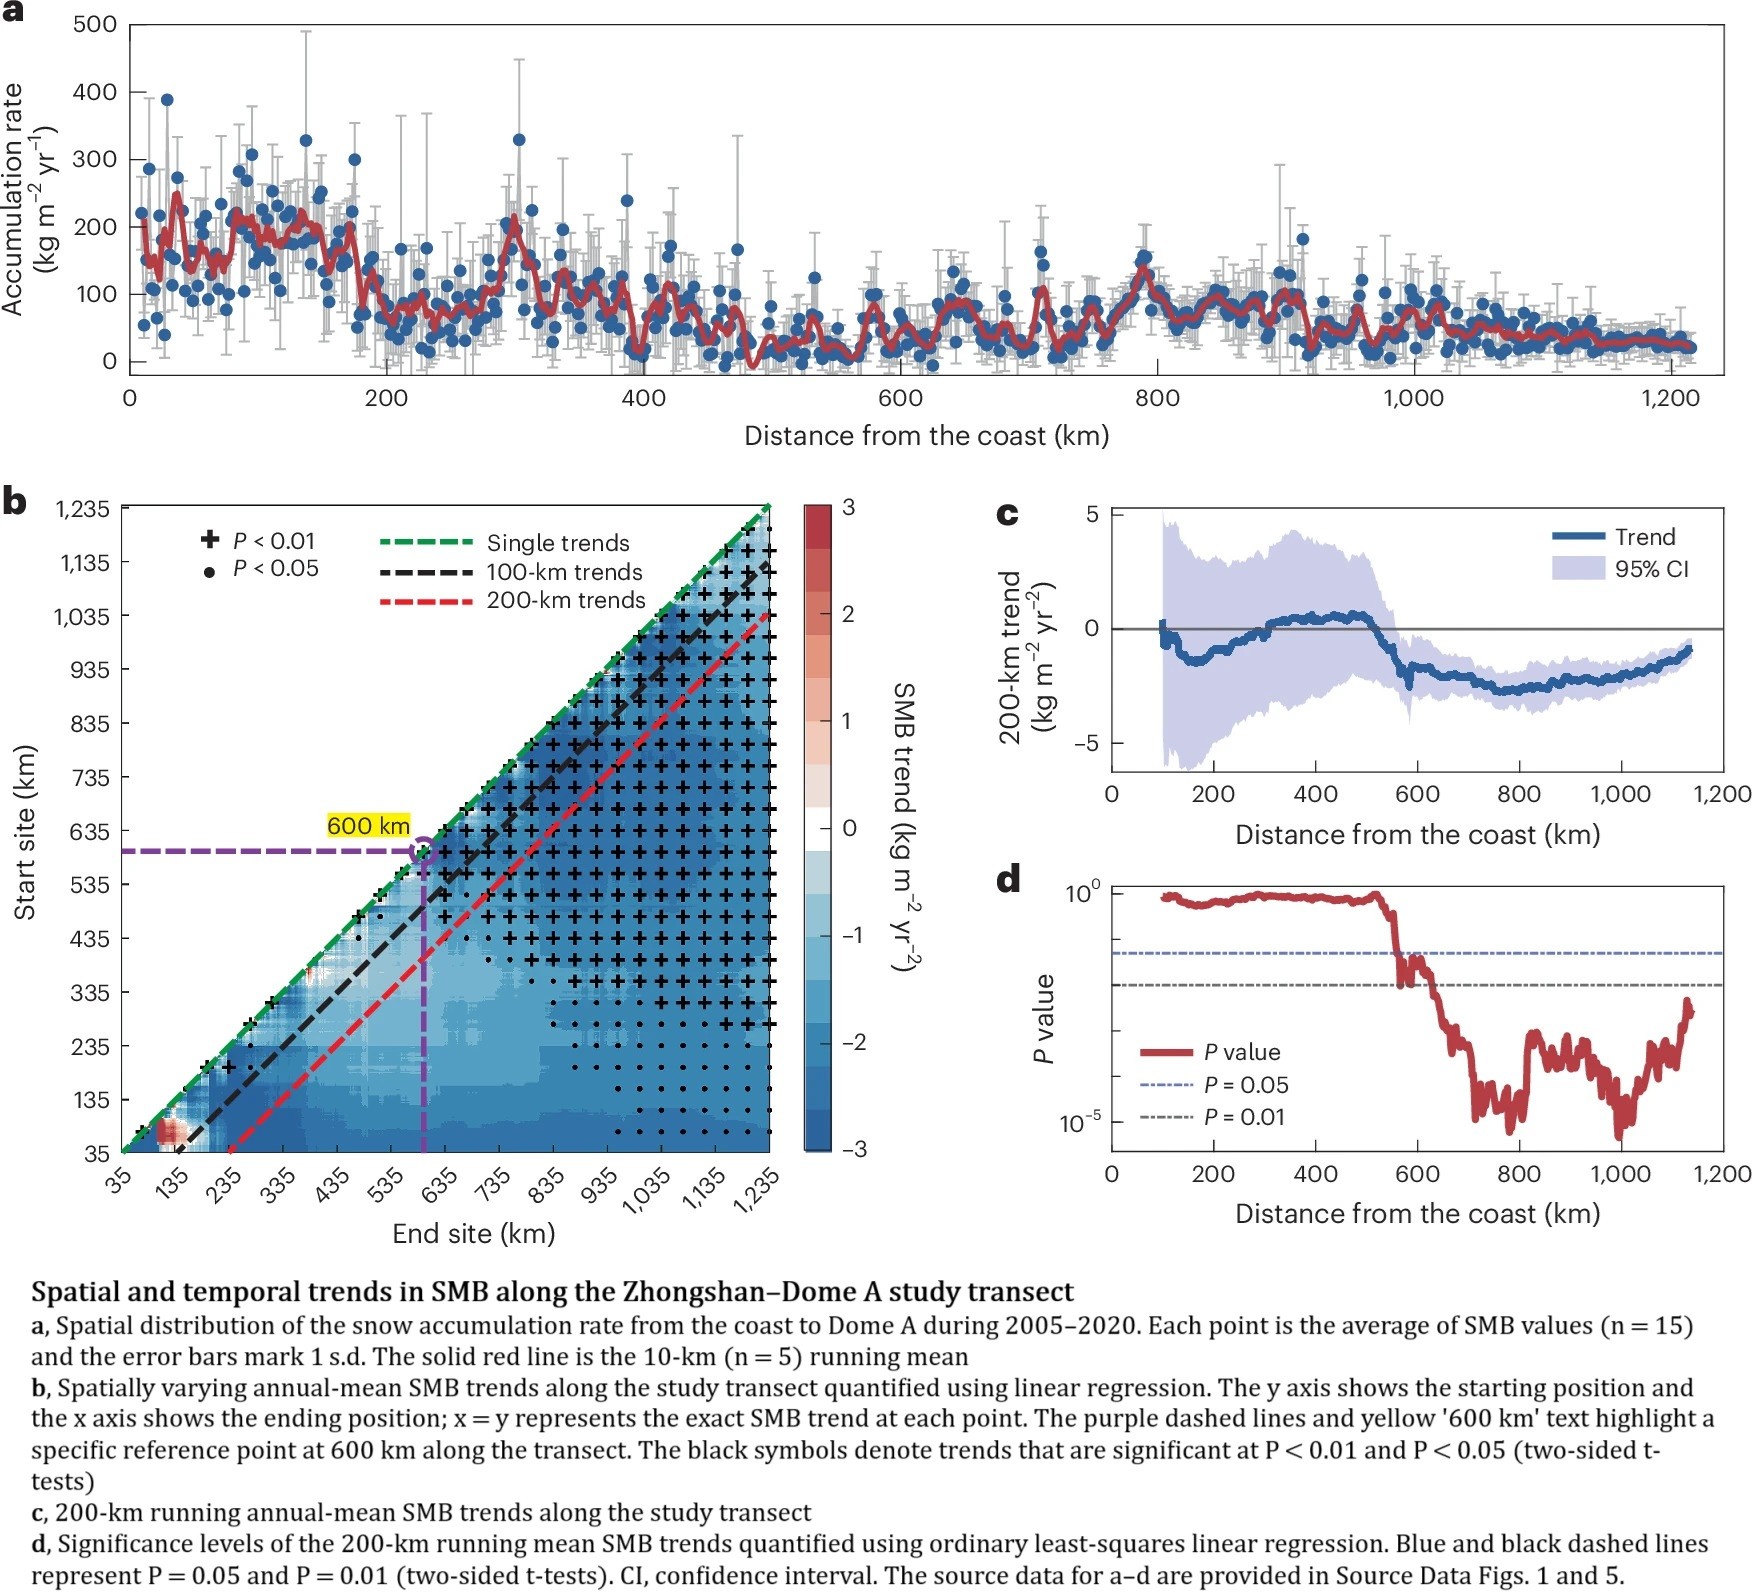
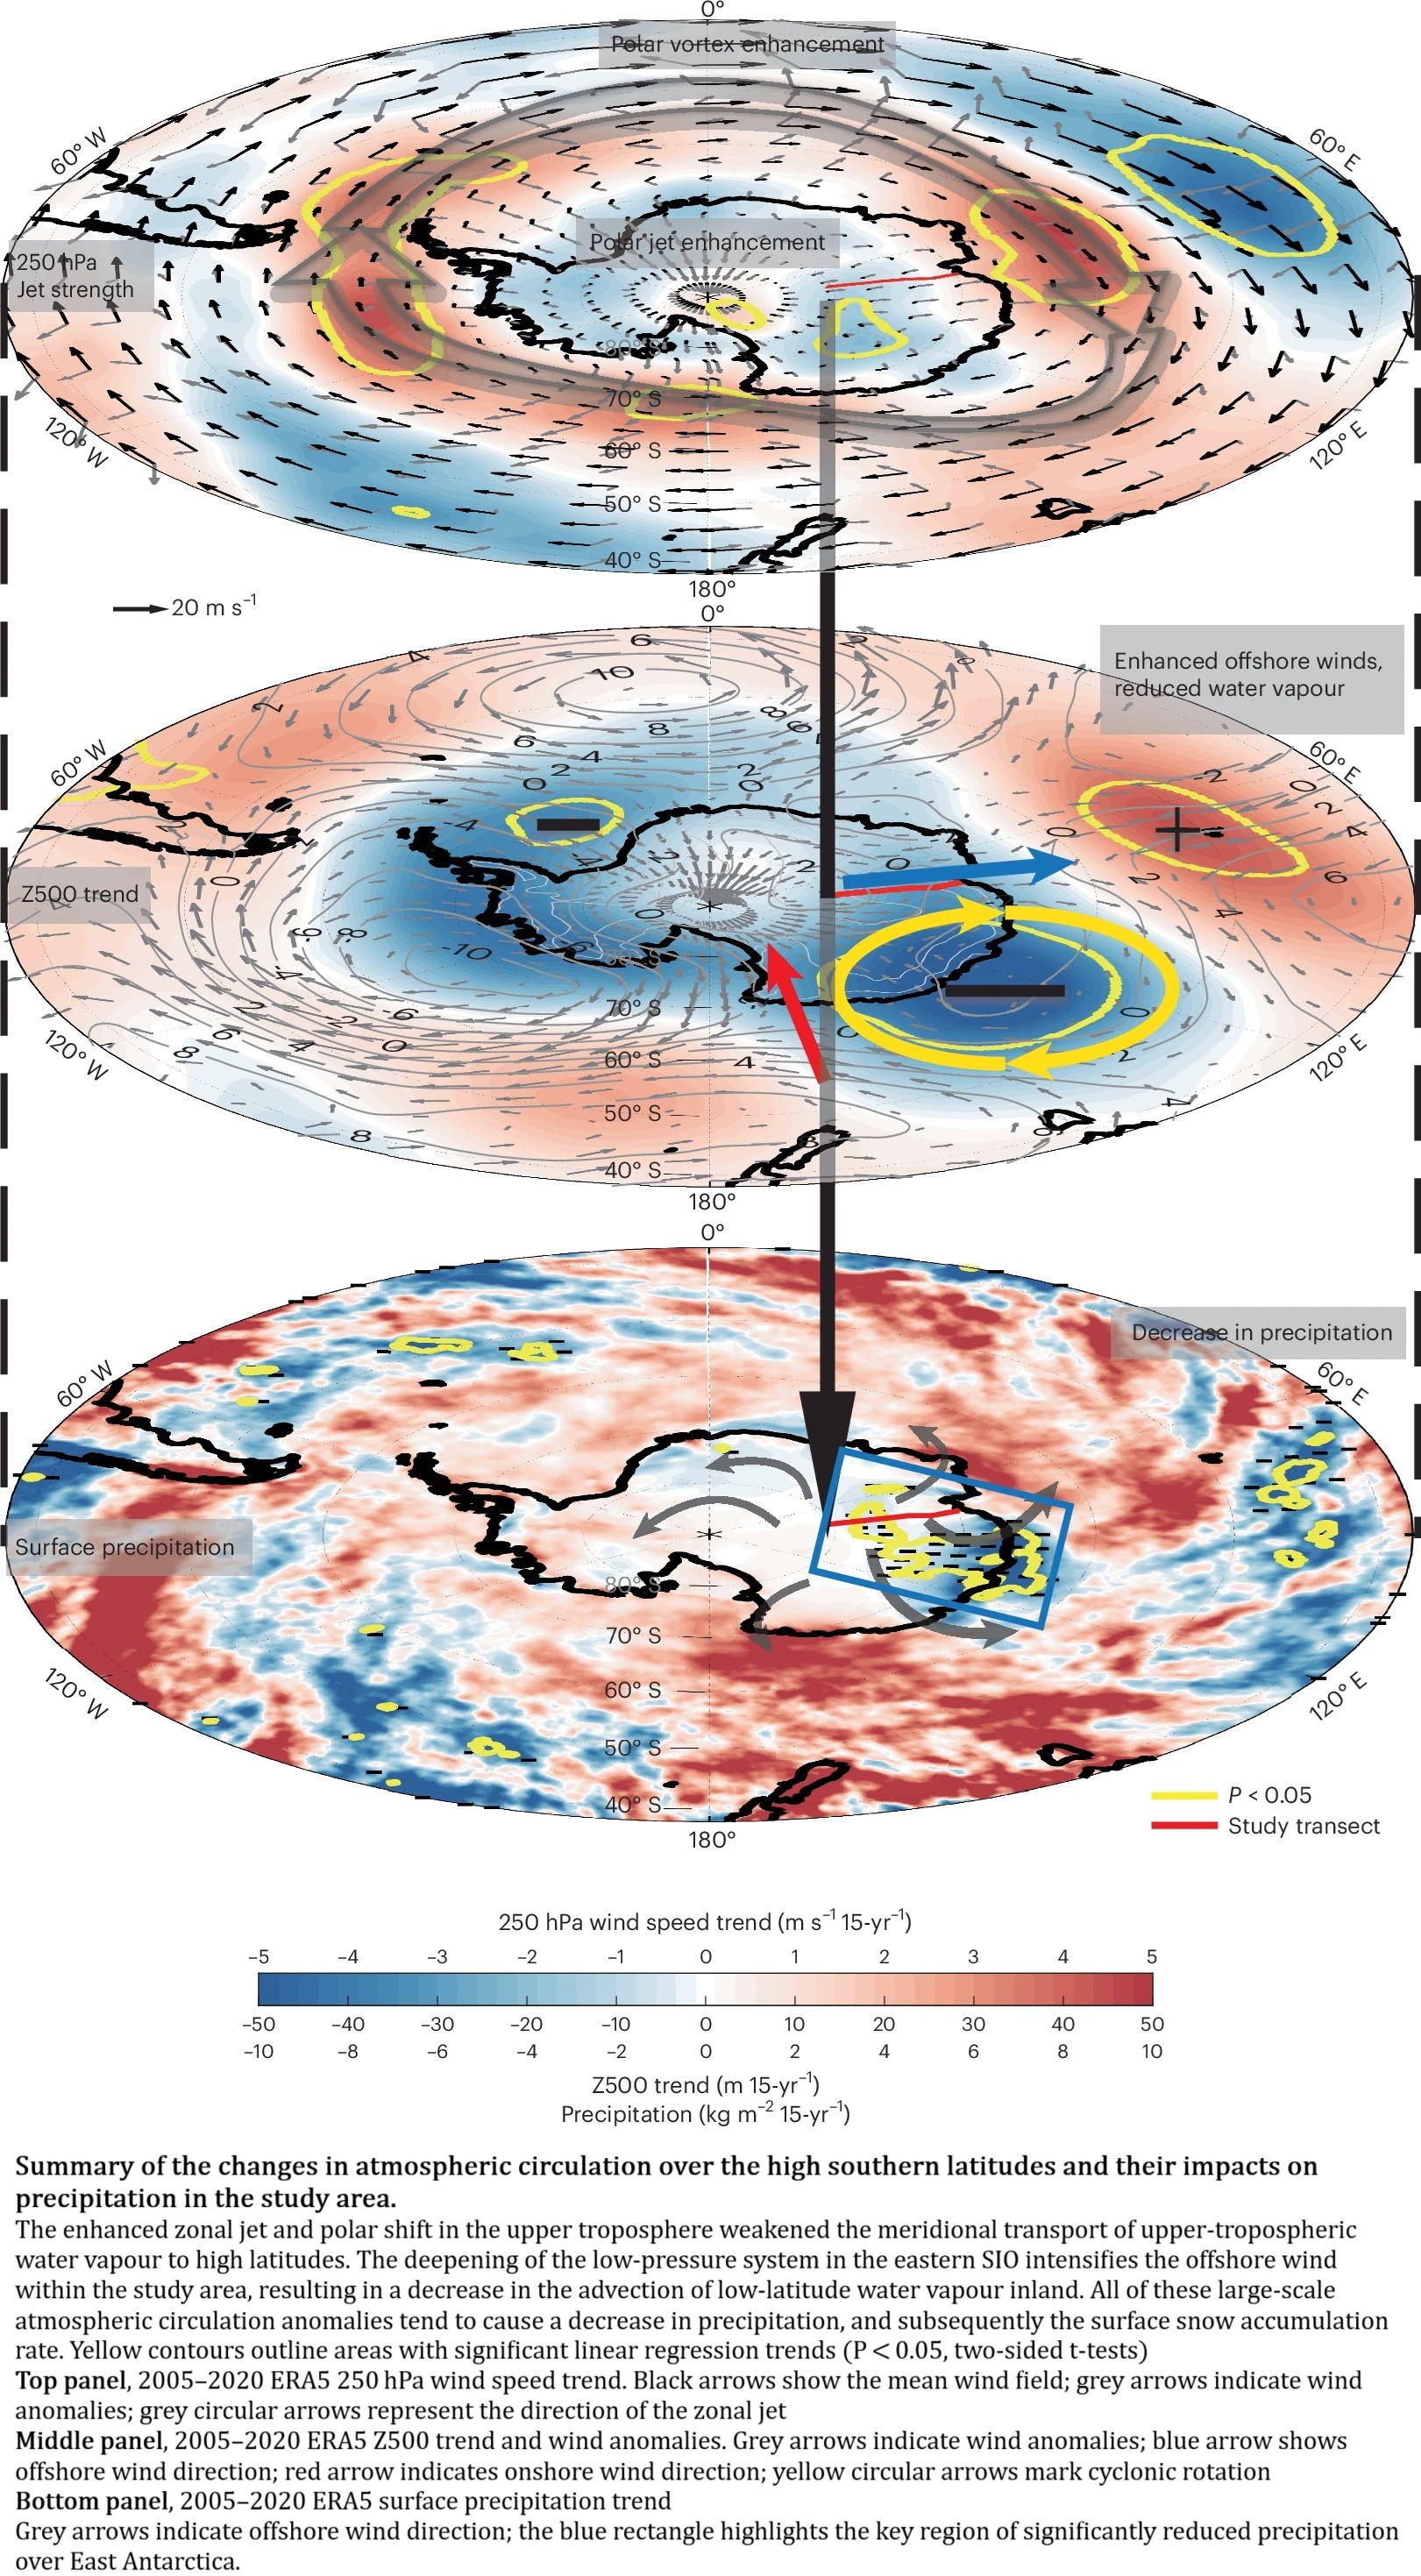
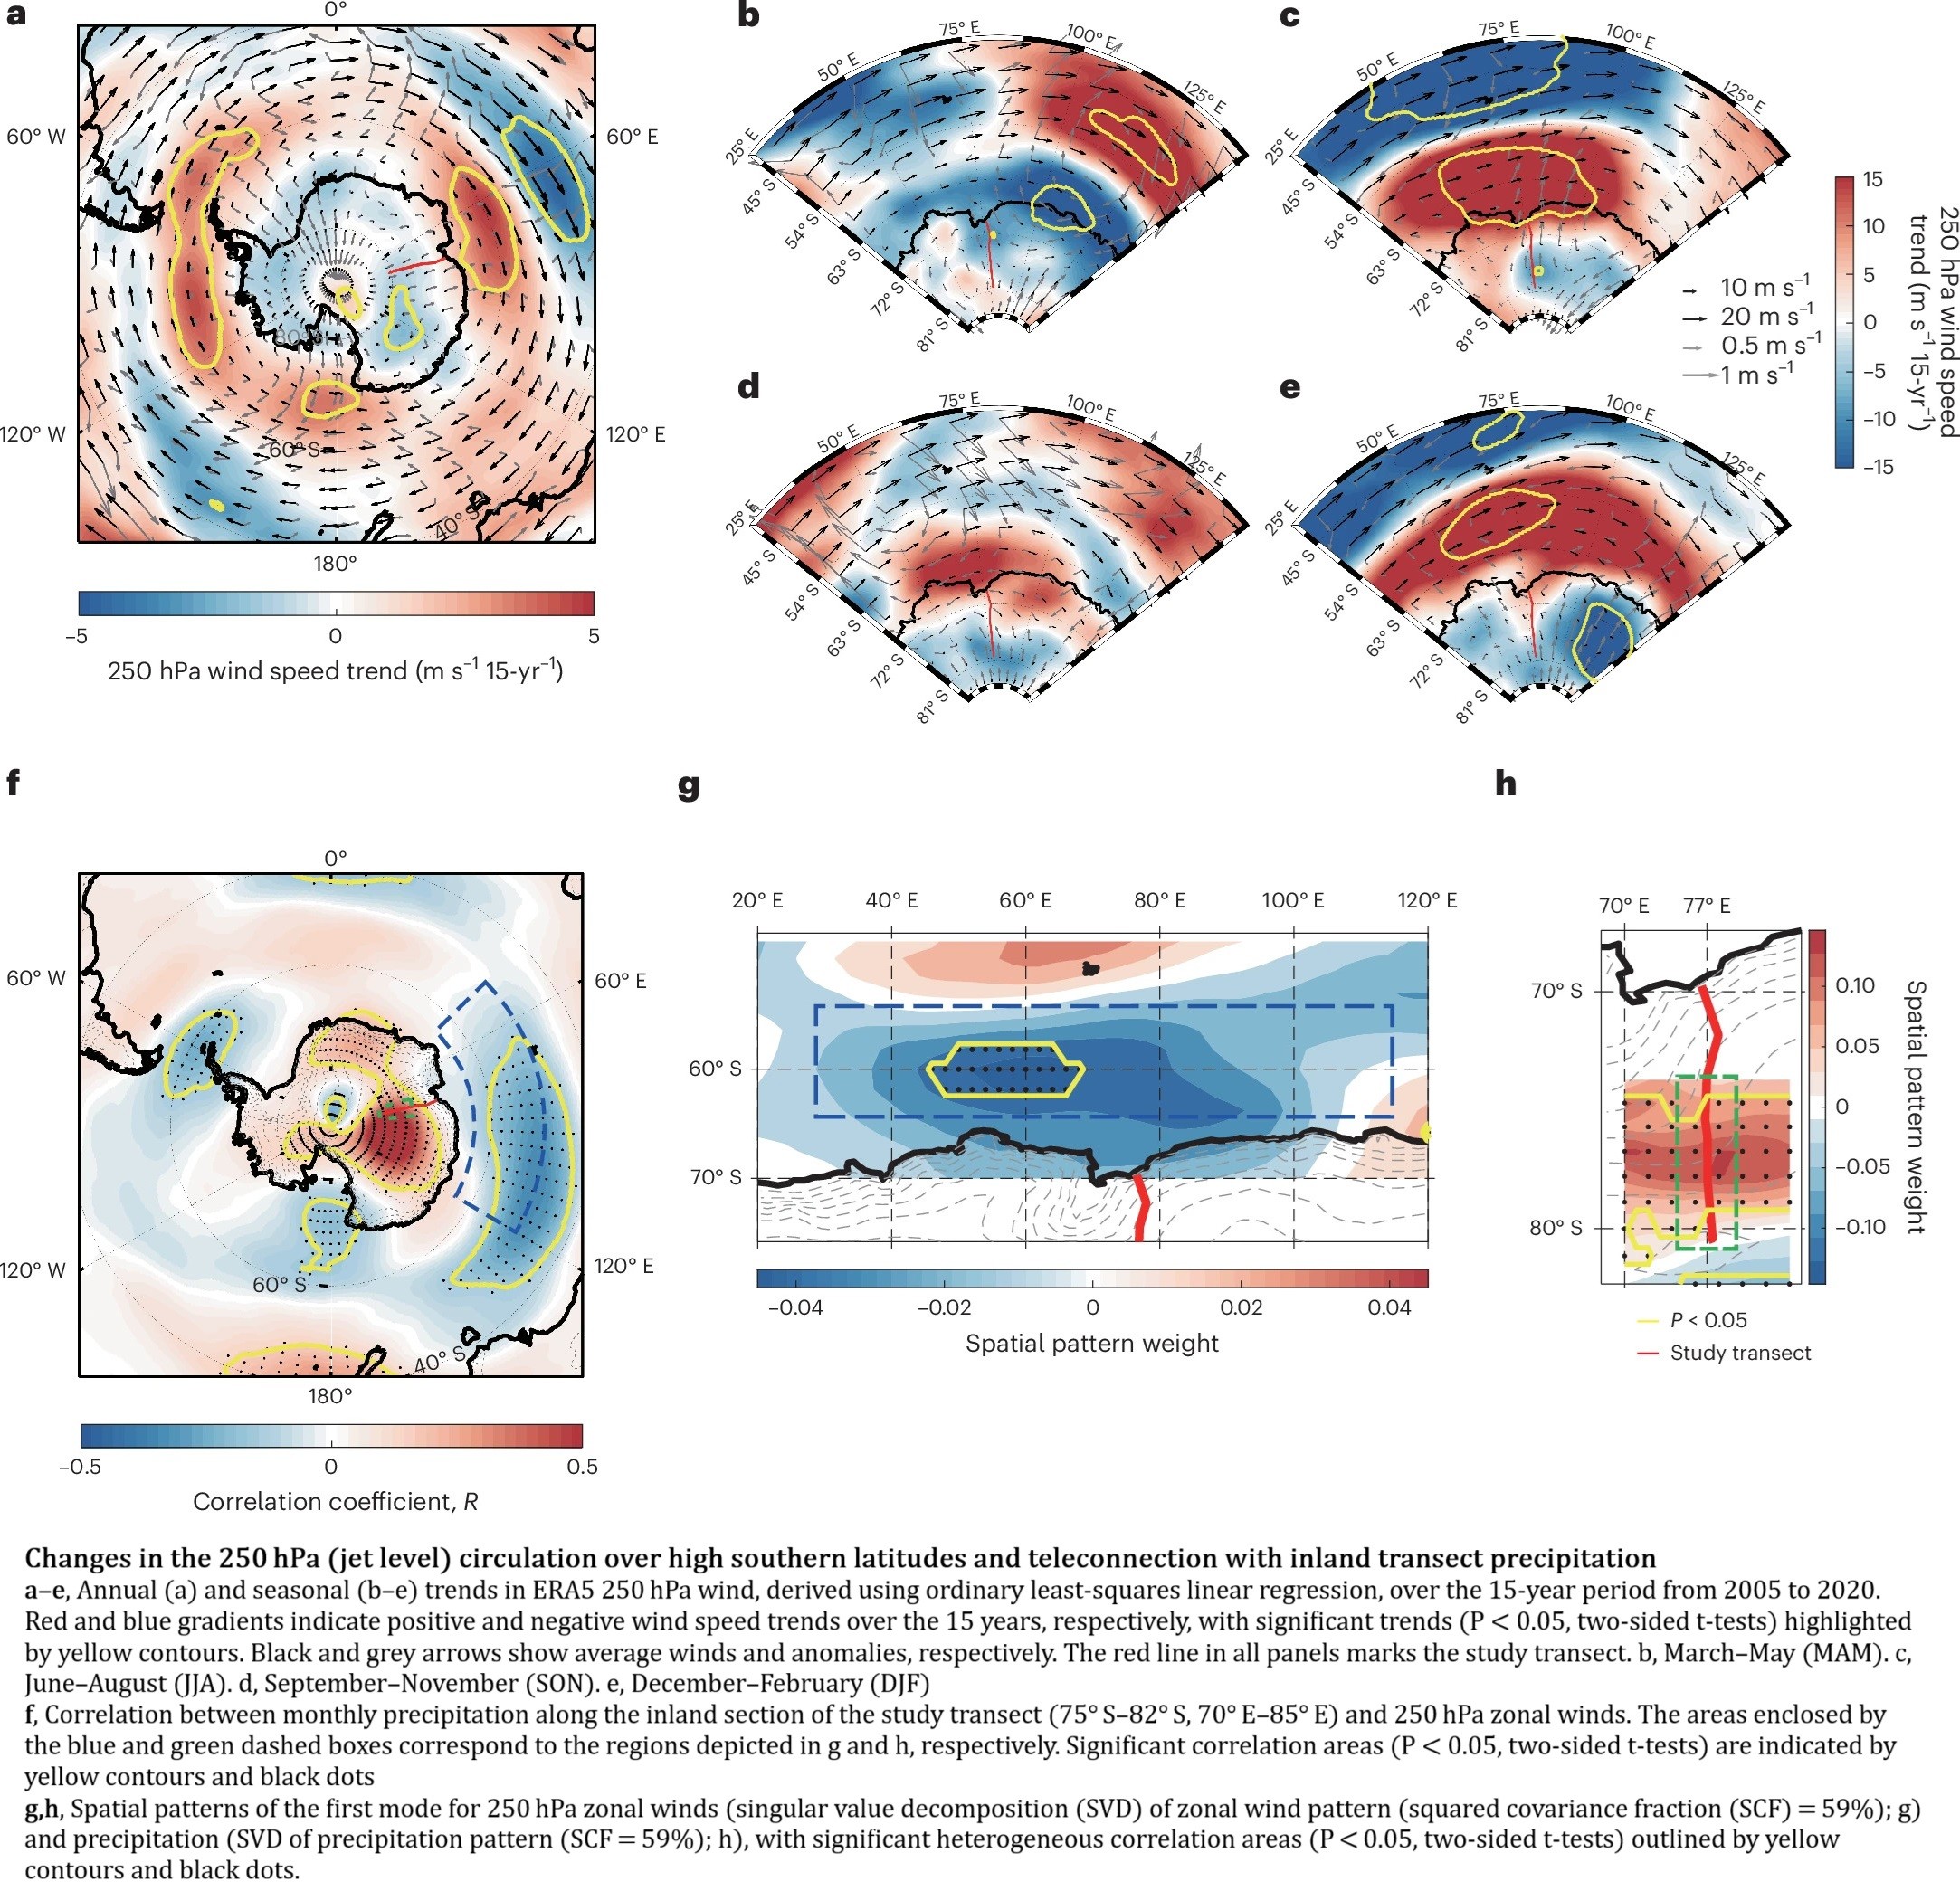
Sustained Decrease In Inland East Antarctic Surface Mass Balance Between 2005 And 2020
--
https://doi.org/10.1038/s41561-025-01699-z <-- shared paper
--
#GIS #spatial #mapping #Antarctic #EastAntarctic #icesheet #massbalance #spatialanalysis #model #modeling #spatiotemporal #water #climate #climatedynamics #monitoring #remotesensing #earthobservation #icecore #snowpit #wind #melting #water #ice #science #cryology #snow #weather #watervapour #climatemodel
#ClimateModel
https://www.oulu.fi/en/news/most-extreme-solar-storm-hit-earth-12350-bc-scientists-identify
@UniOulu Finland utilised their newly developed chemistry– #climatemodel called SOCOL:14C-Ex,…the model confirmed that the detected solar event was ~18% stronger than the notorious AD 775 event — until now the strongest solar storm ever recorded…
“Compared to the largest event of the modern satellite era — the 2005 particle storm — the ancient 12350 BC event was over 500 times more intense, according to our estimates…”
22 people in the monthly #HCLIM meeting - I remember when you could comfortably fit us all around a single home dining table - Europe's common regional #ClimateModel is taking shape nicely...
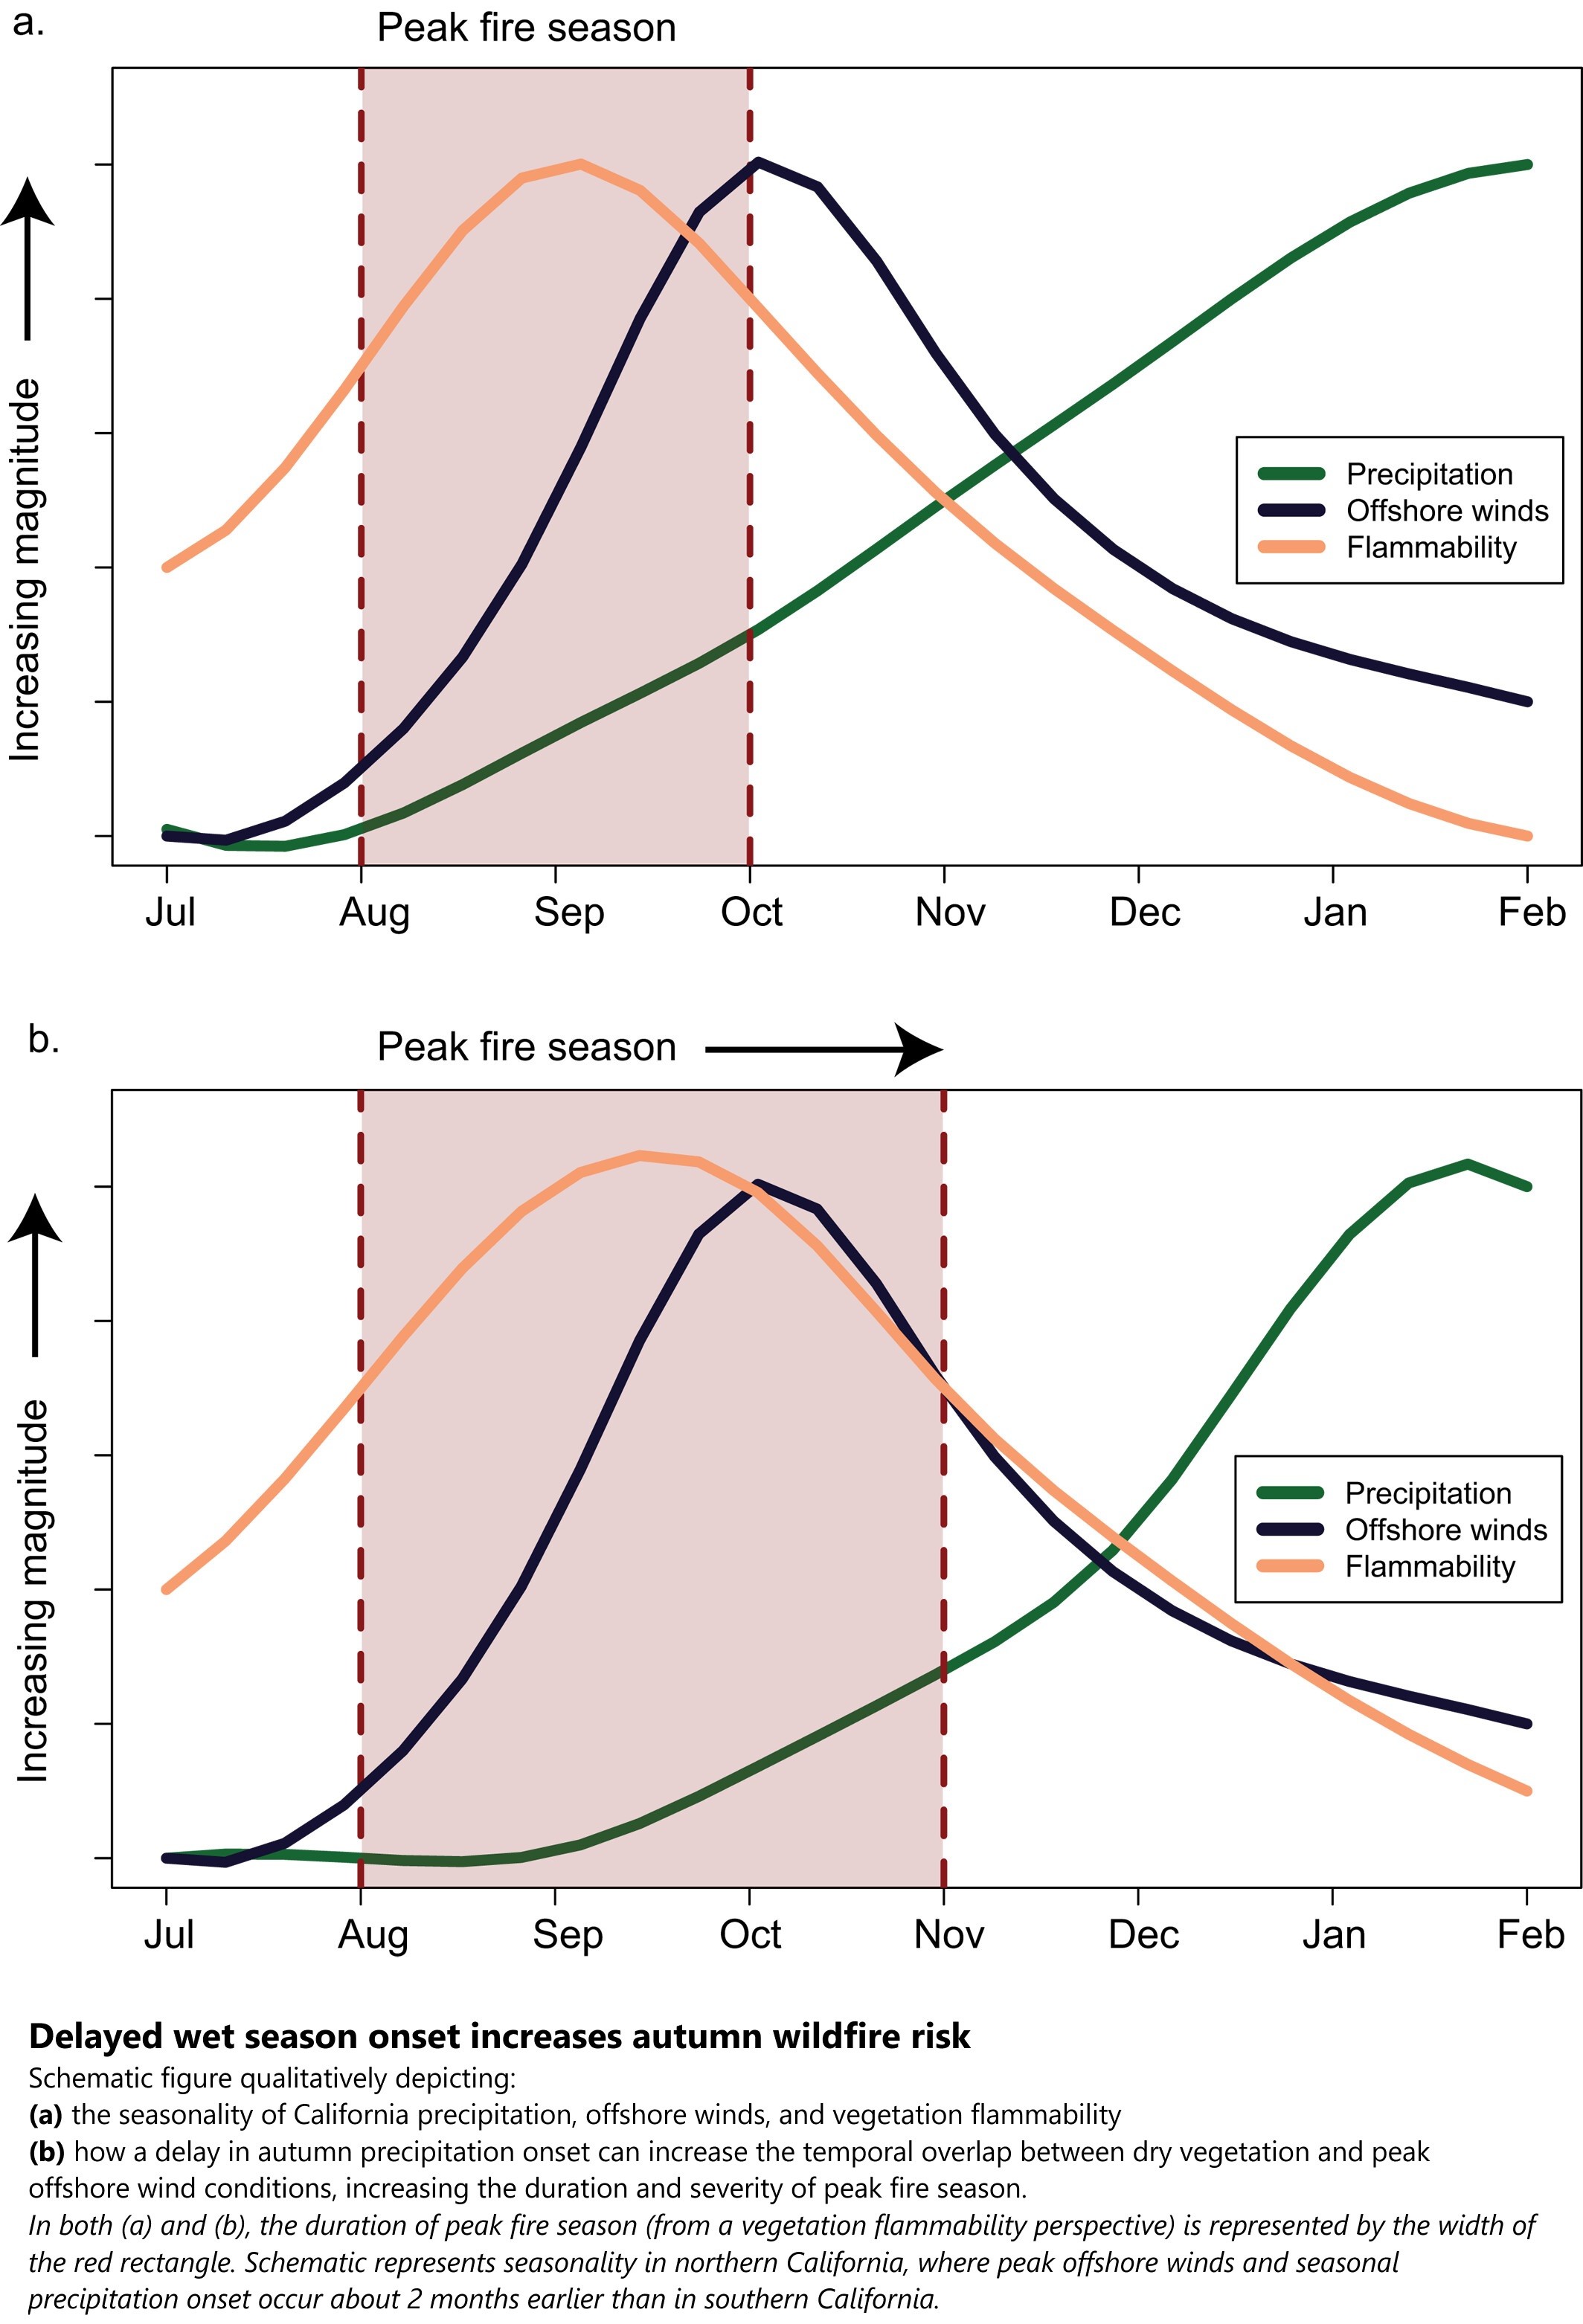
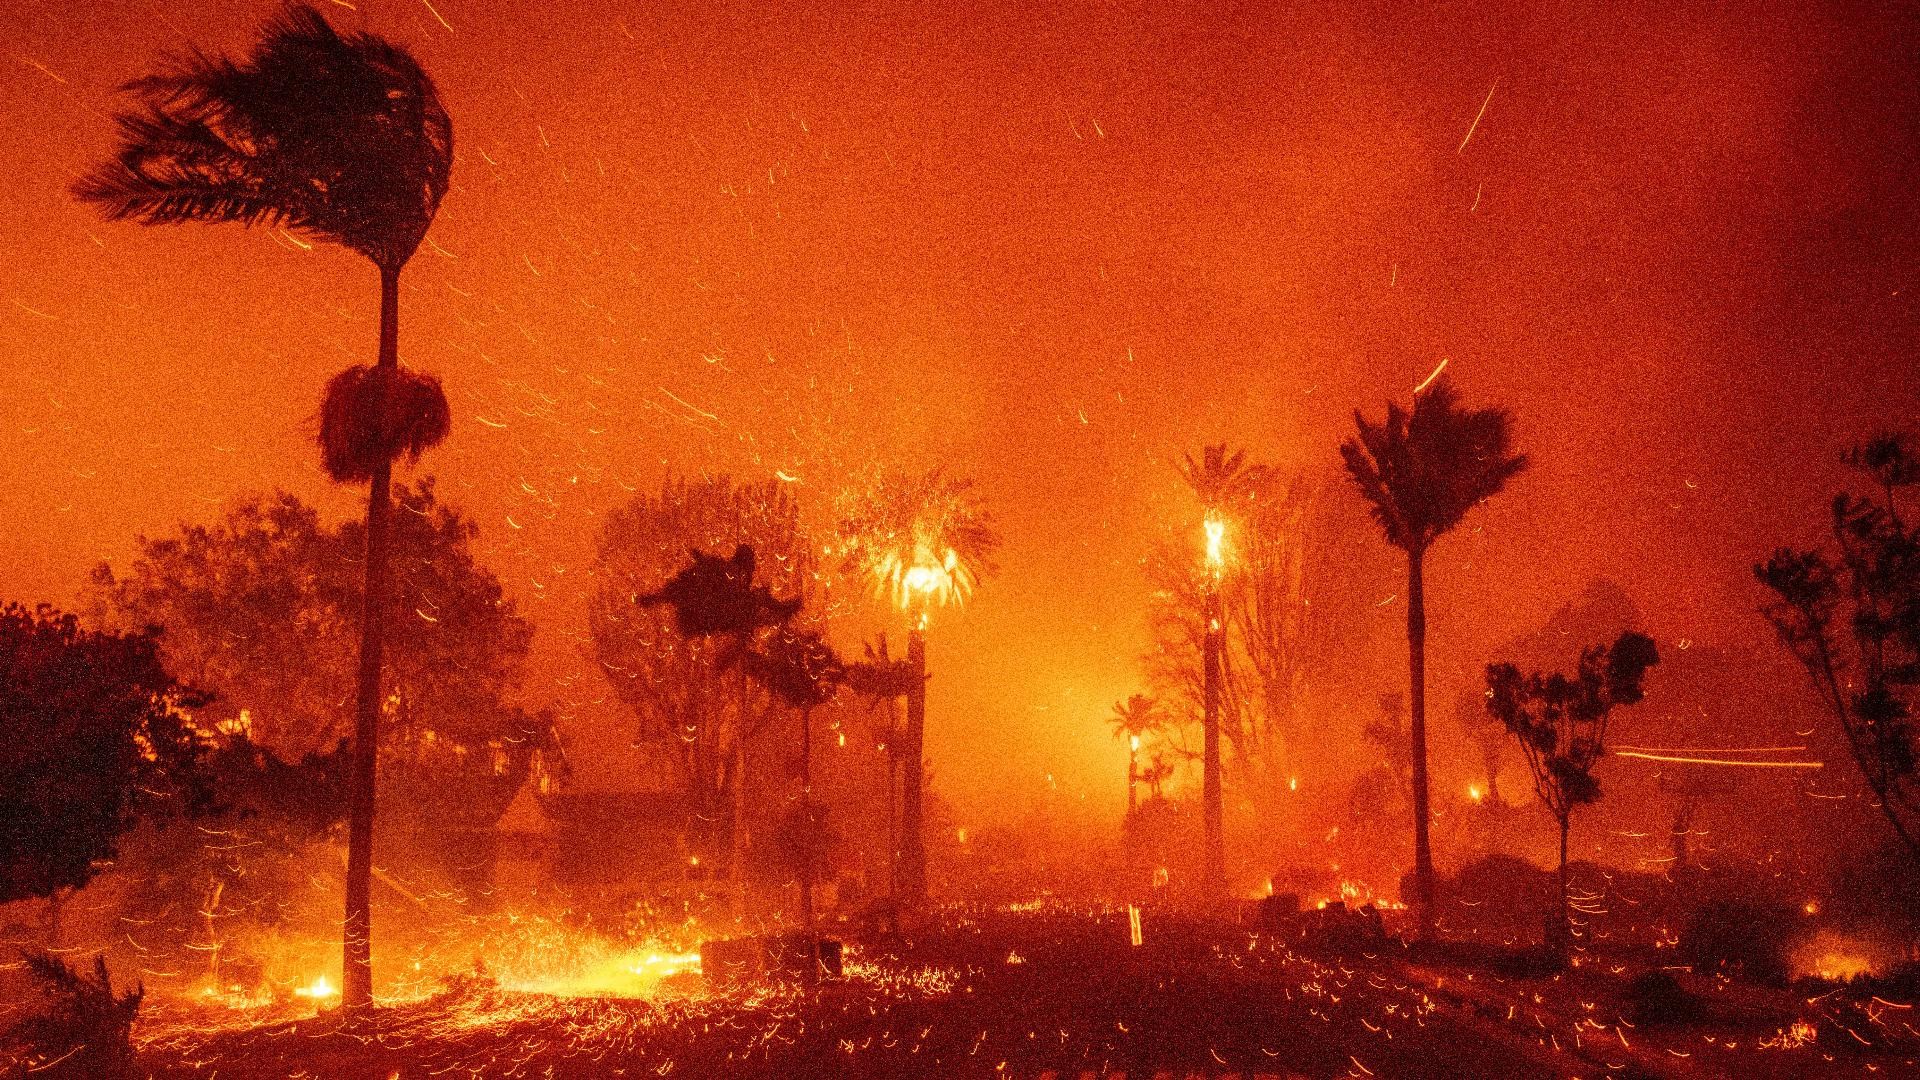
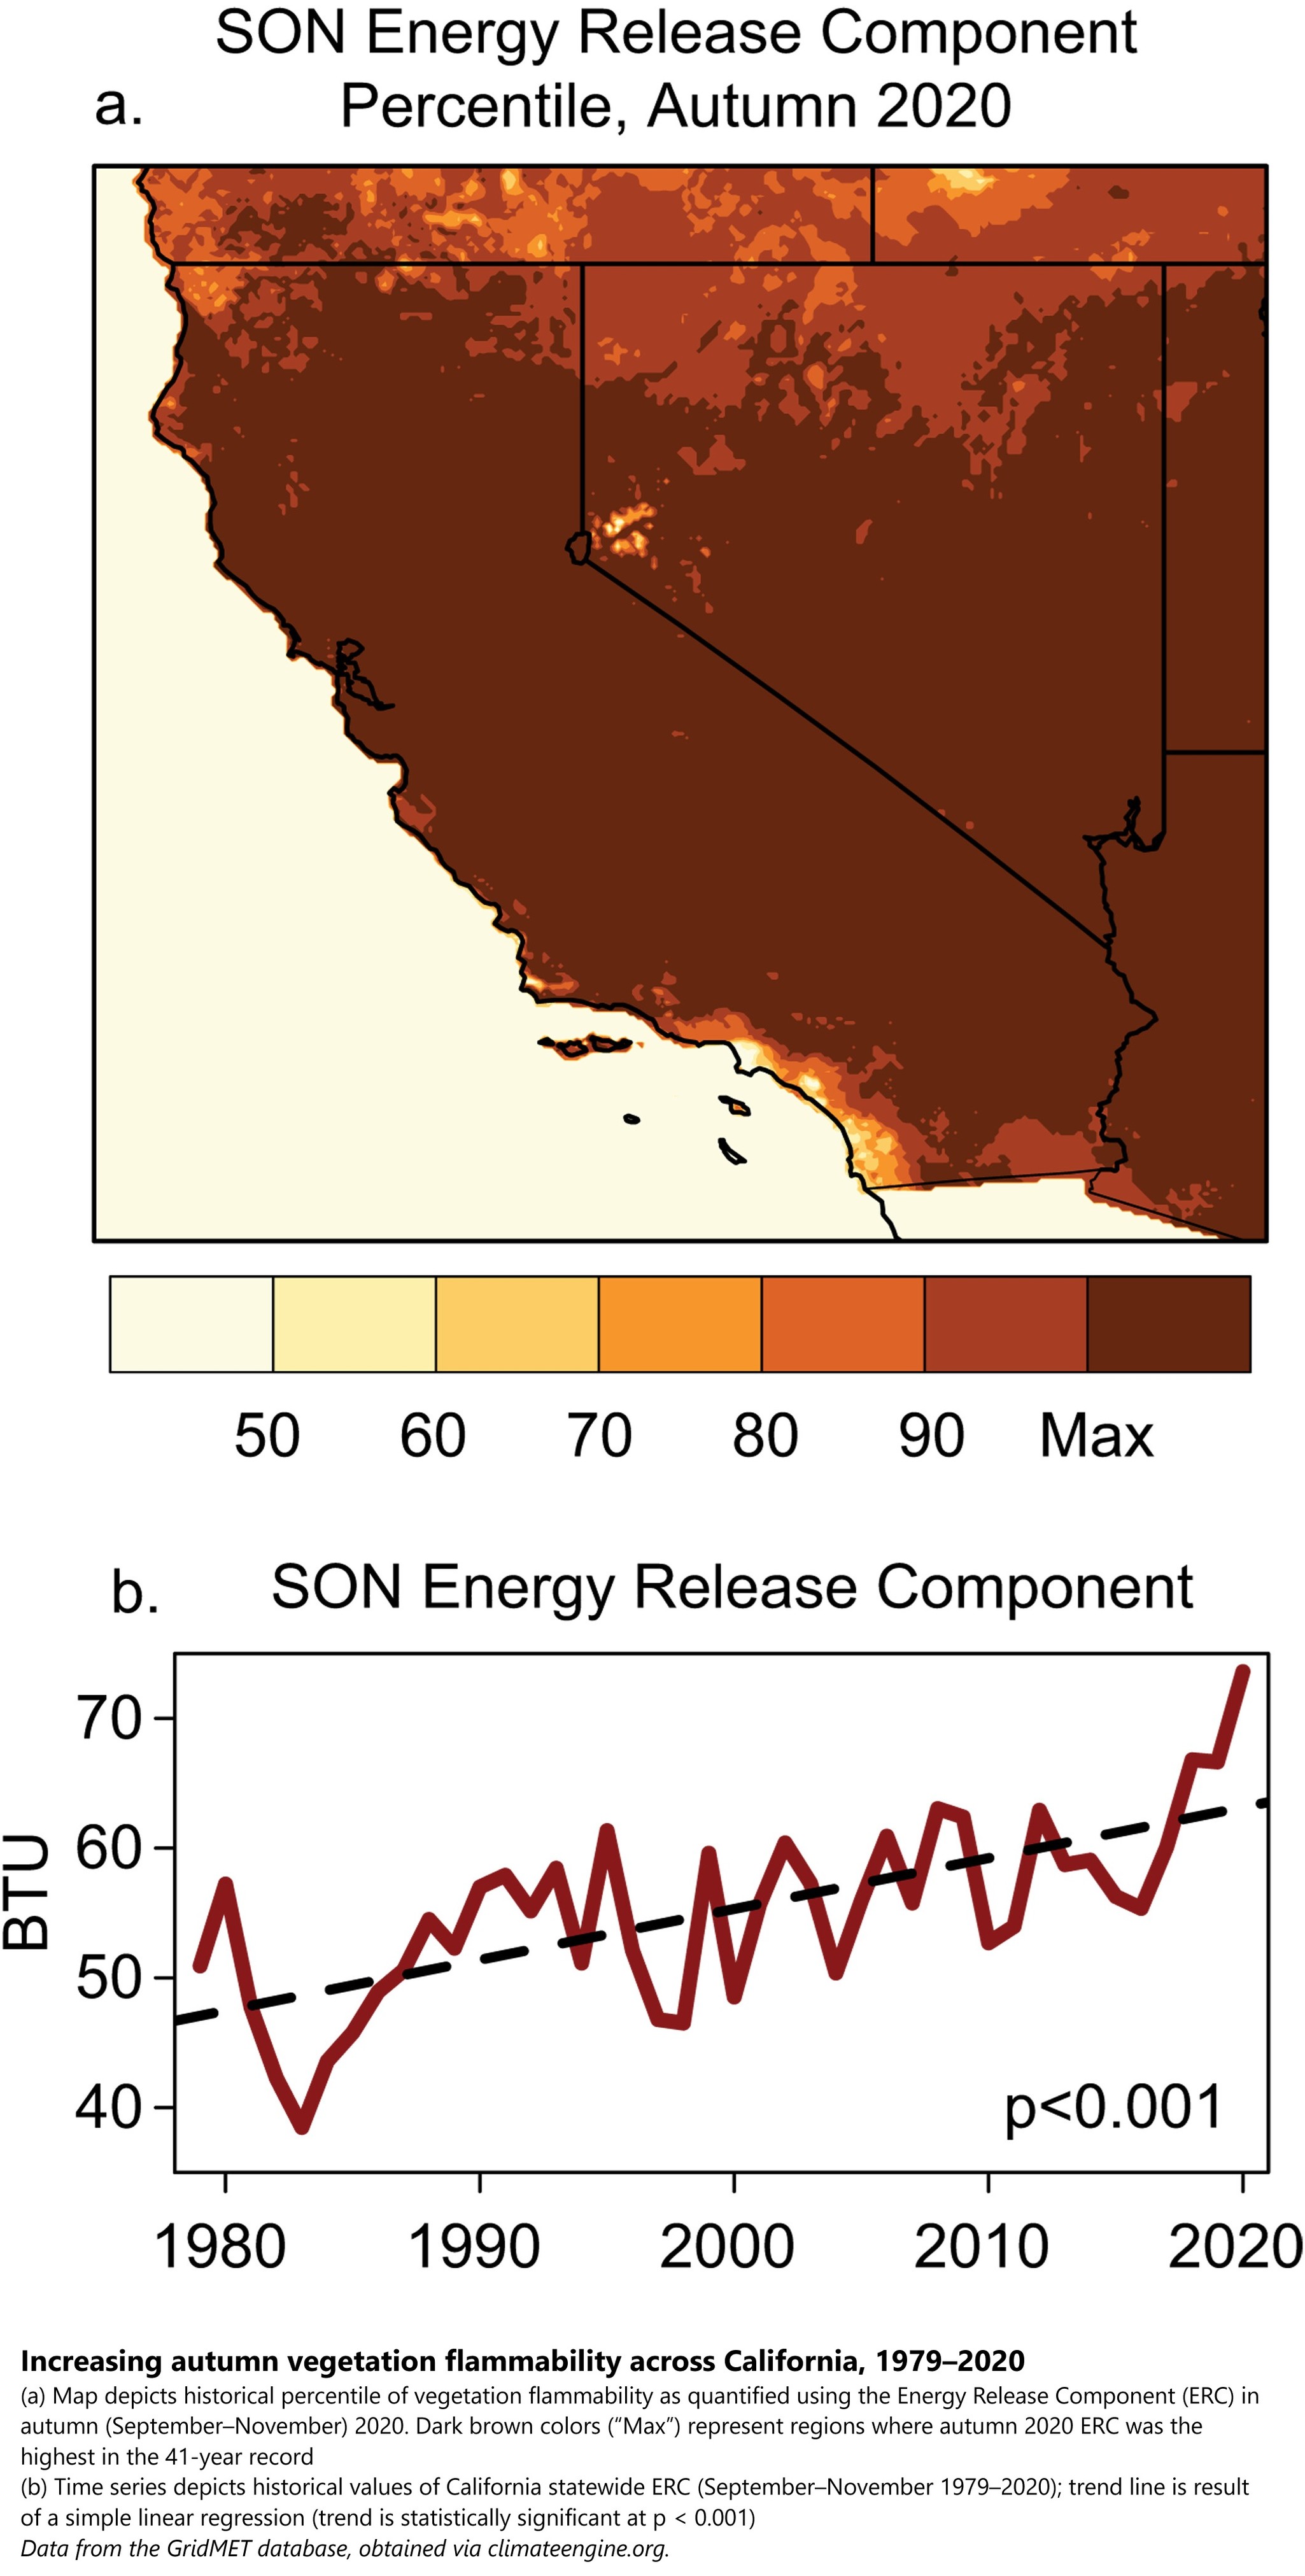
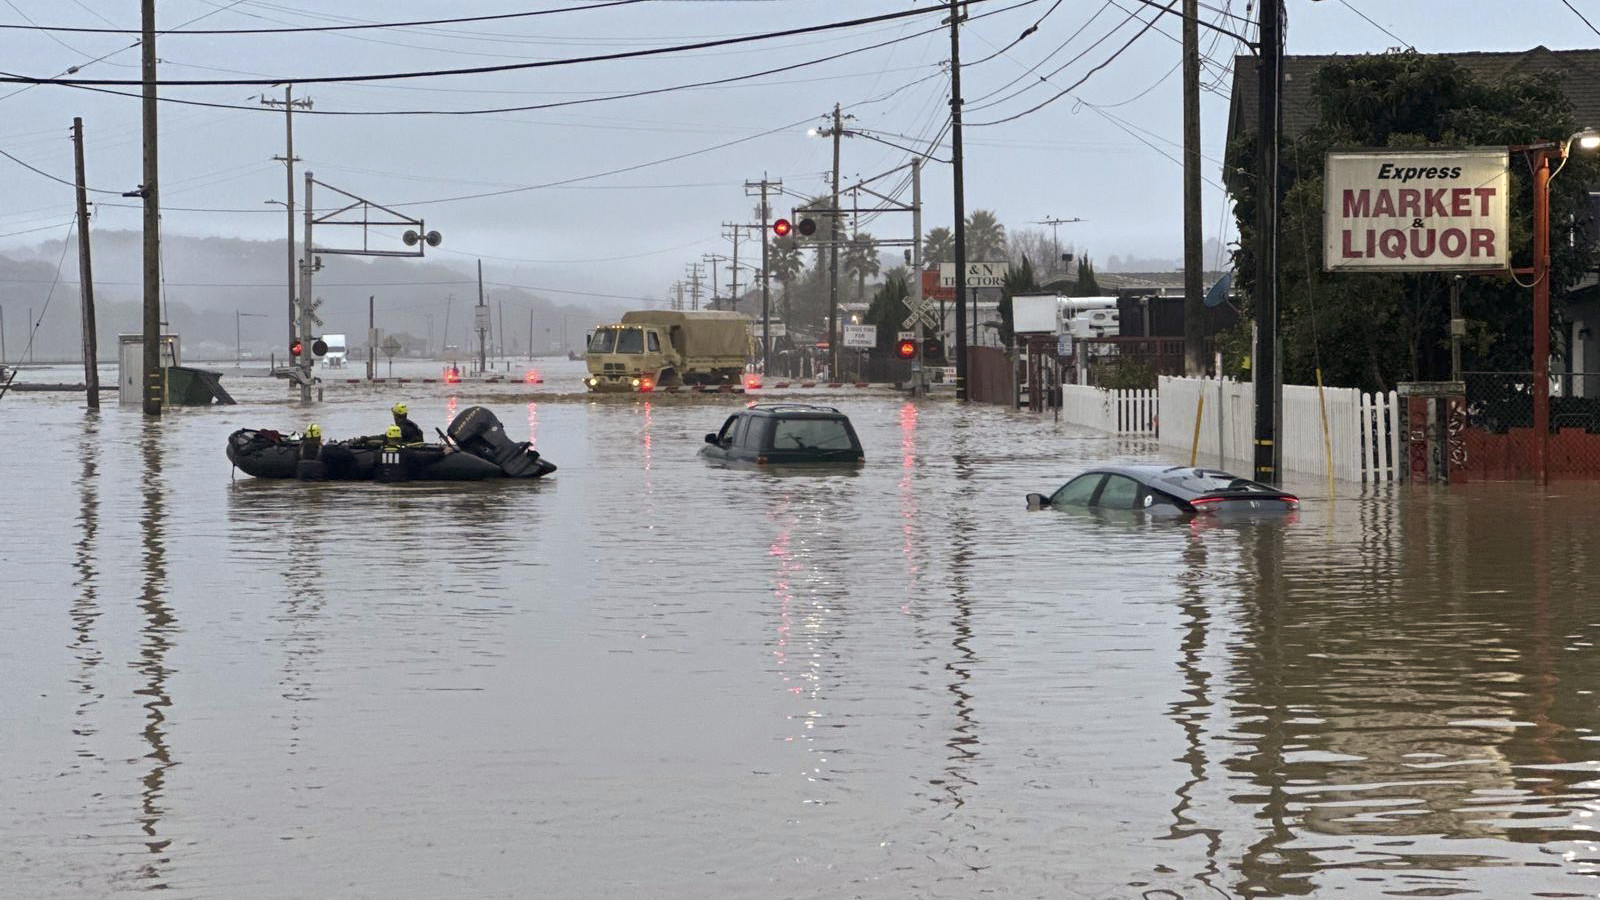
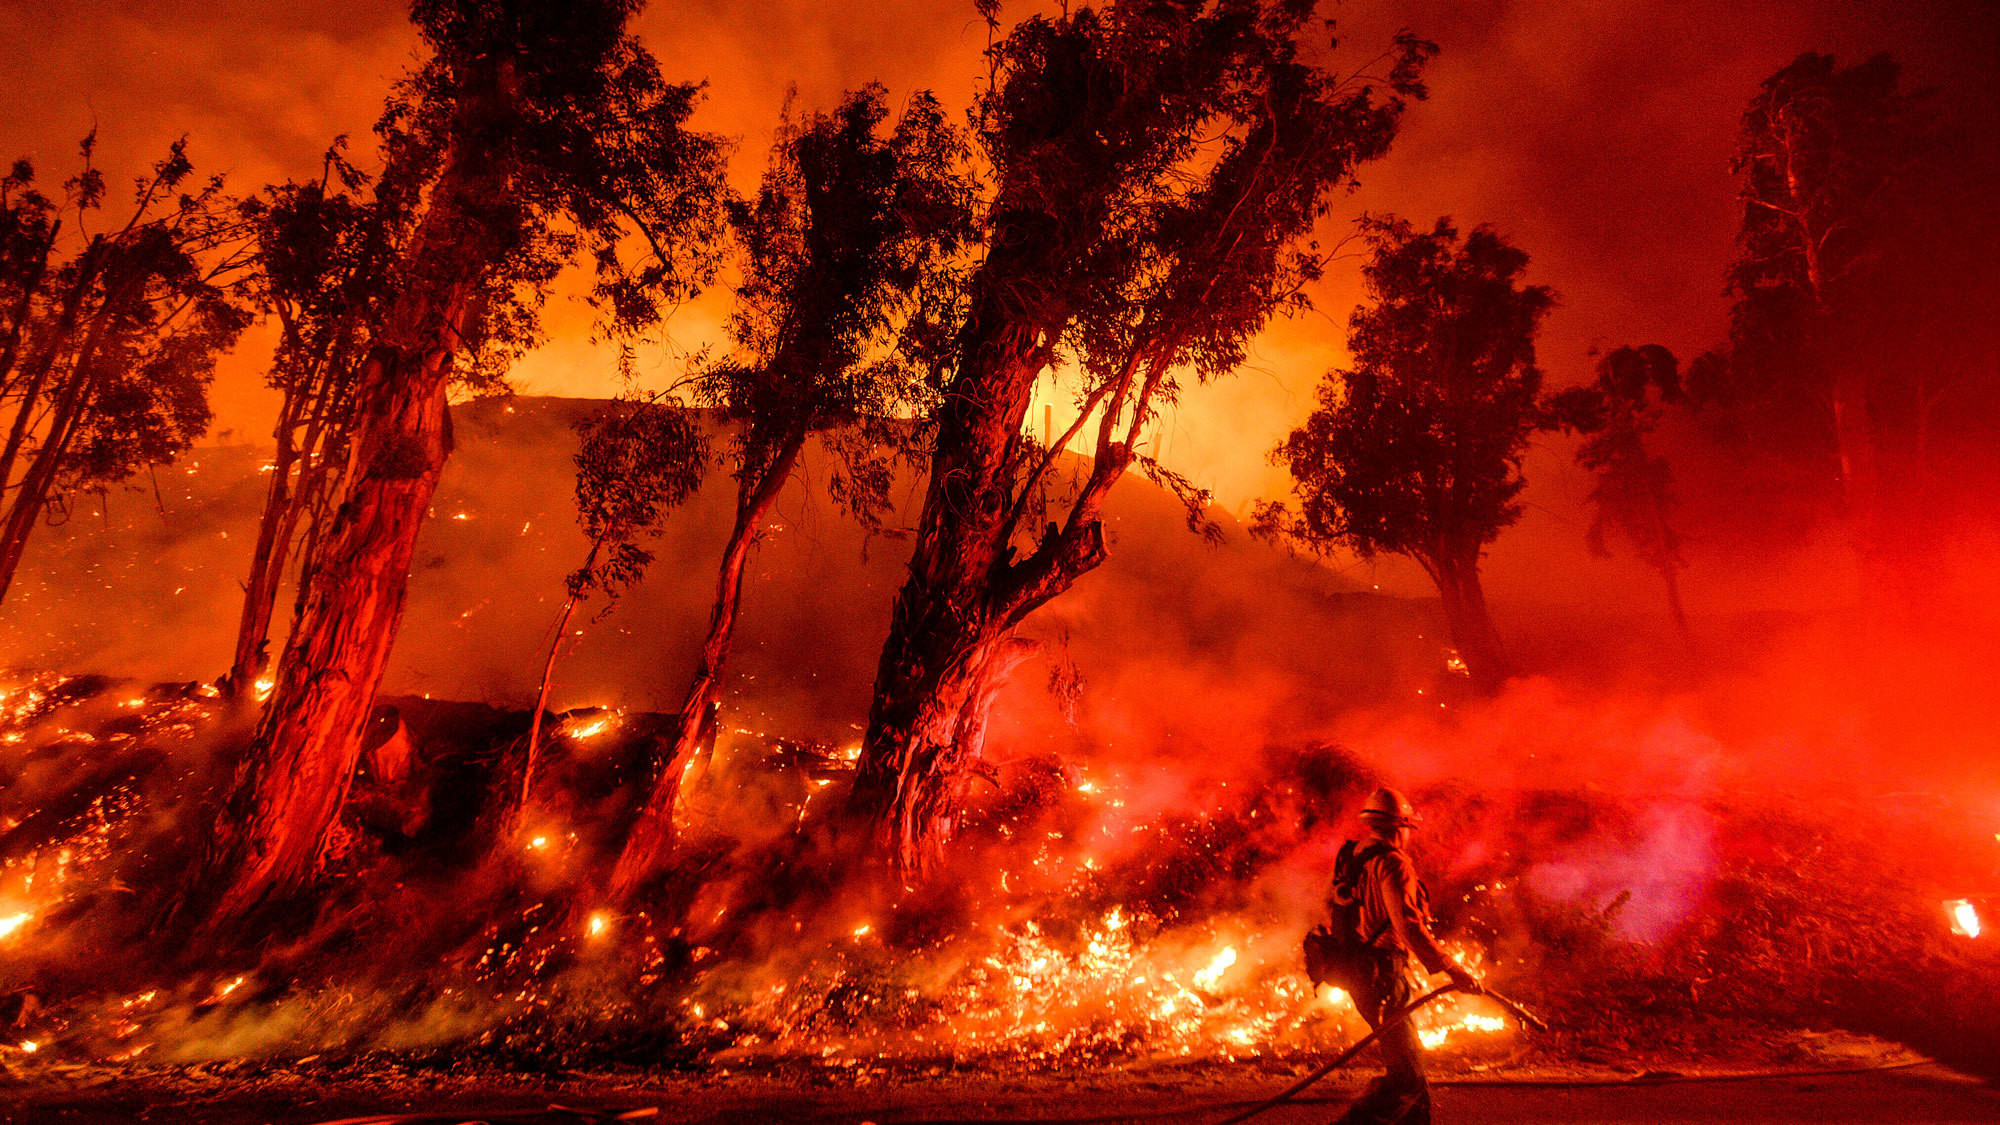
A Shorter, Sharper Rainy Season Amplifies California Wildfire Risk
--
https://doi.org/10.1029/2021GL092843 <-- shared paper
--
https://doi.org/10.1029/2020GL090350 <-- shared paper
--
[a paper from a few years ago, but very pertinent considering the horrific events in Los Angeles area in early 2025]
#GIS #spatial #mapping #spatiotemporal #spatialanalysis #precipitation #California #WestCoast #USA #LosAngeles #wildfire #LA #LosAngelesfires #losangelesfires2025 #climatechange #rainfall #precipitation #weather #wind #dry #water #hydrology #rainyseason #wildfirerisk #WildfireCrisis #risk #hazard #loss #damage #fire #house #community #publicsafety #autumn #fall #cost #economics #CaliforniaWildFires #vegetation #seasonality #model #modeling #climatemodel
¡AI Caramba!
28 Dec 2024
"Rapid progress in the use of machine learning for weather and climate models is evident almost everywhere, but can we distinguish between real advances and vaporware?"
https://www.realclimate.org/index.php/archives/2024/12/ai-caramba/
#climatechange #climatecrisis #climatemodel #machinelearning #AI
https://www.nature.com/articles/s43247-024-01907-5
Atlantic Meridional Overturning Circulation slowdown modulates wind-driven circulations in a warmer climate
Warmer climates weaken the Atlantic Meridional Overturning Circulation, causing anticyclonic surface wind anomalies in the subpolar North Atlantic, decelerating gyre circulation and affecting Atlantic western boundary currents, according to analysis of fully coupled #climatemodel experiments under #anthropogenicwarming.
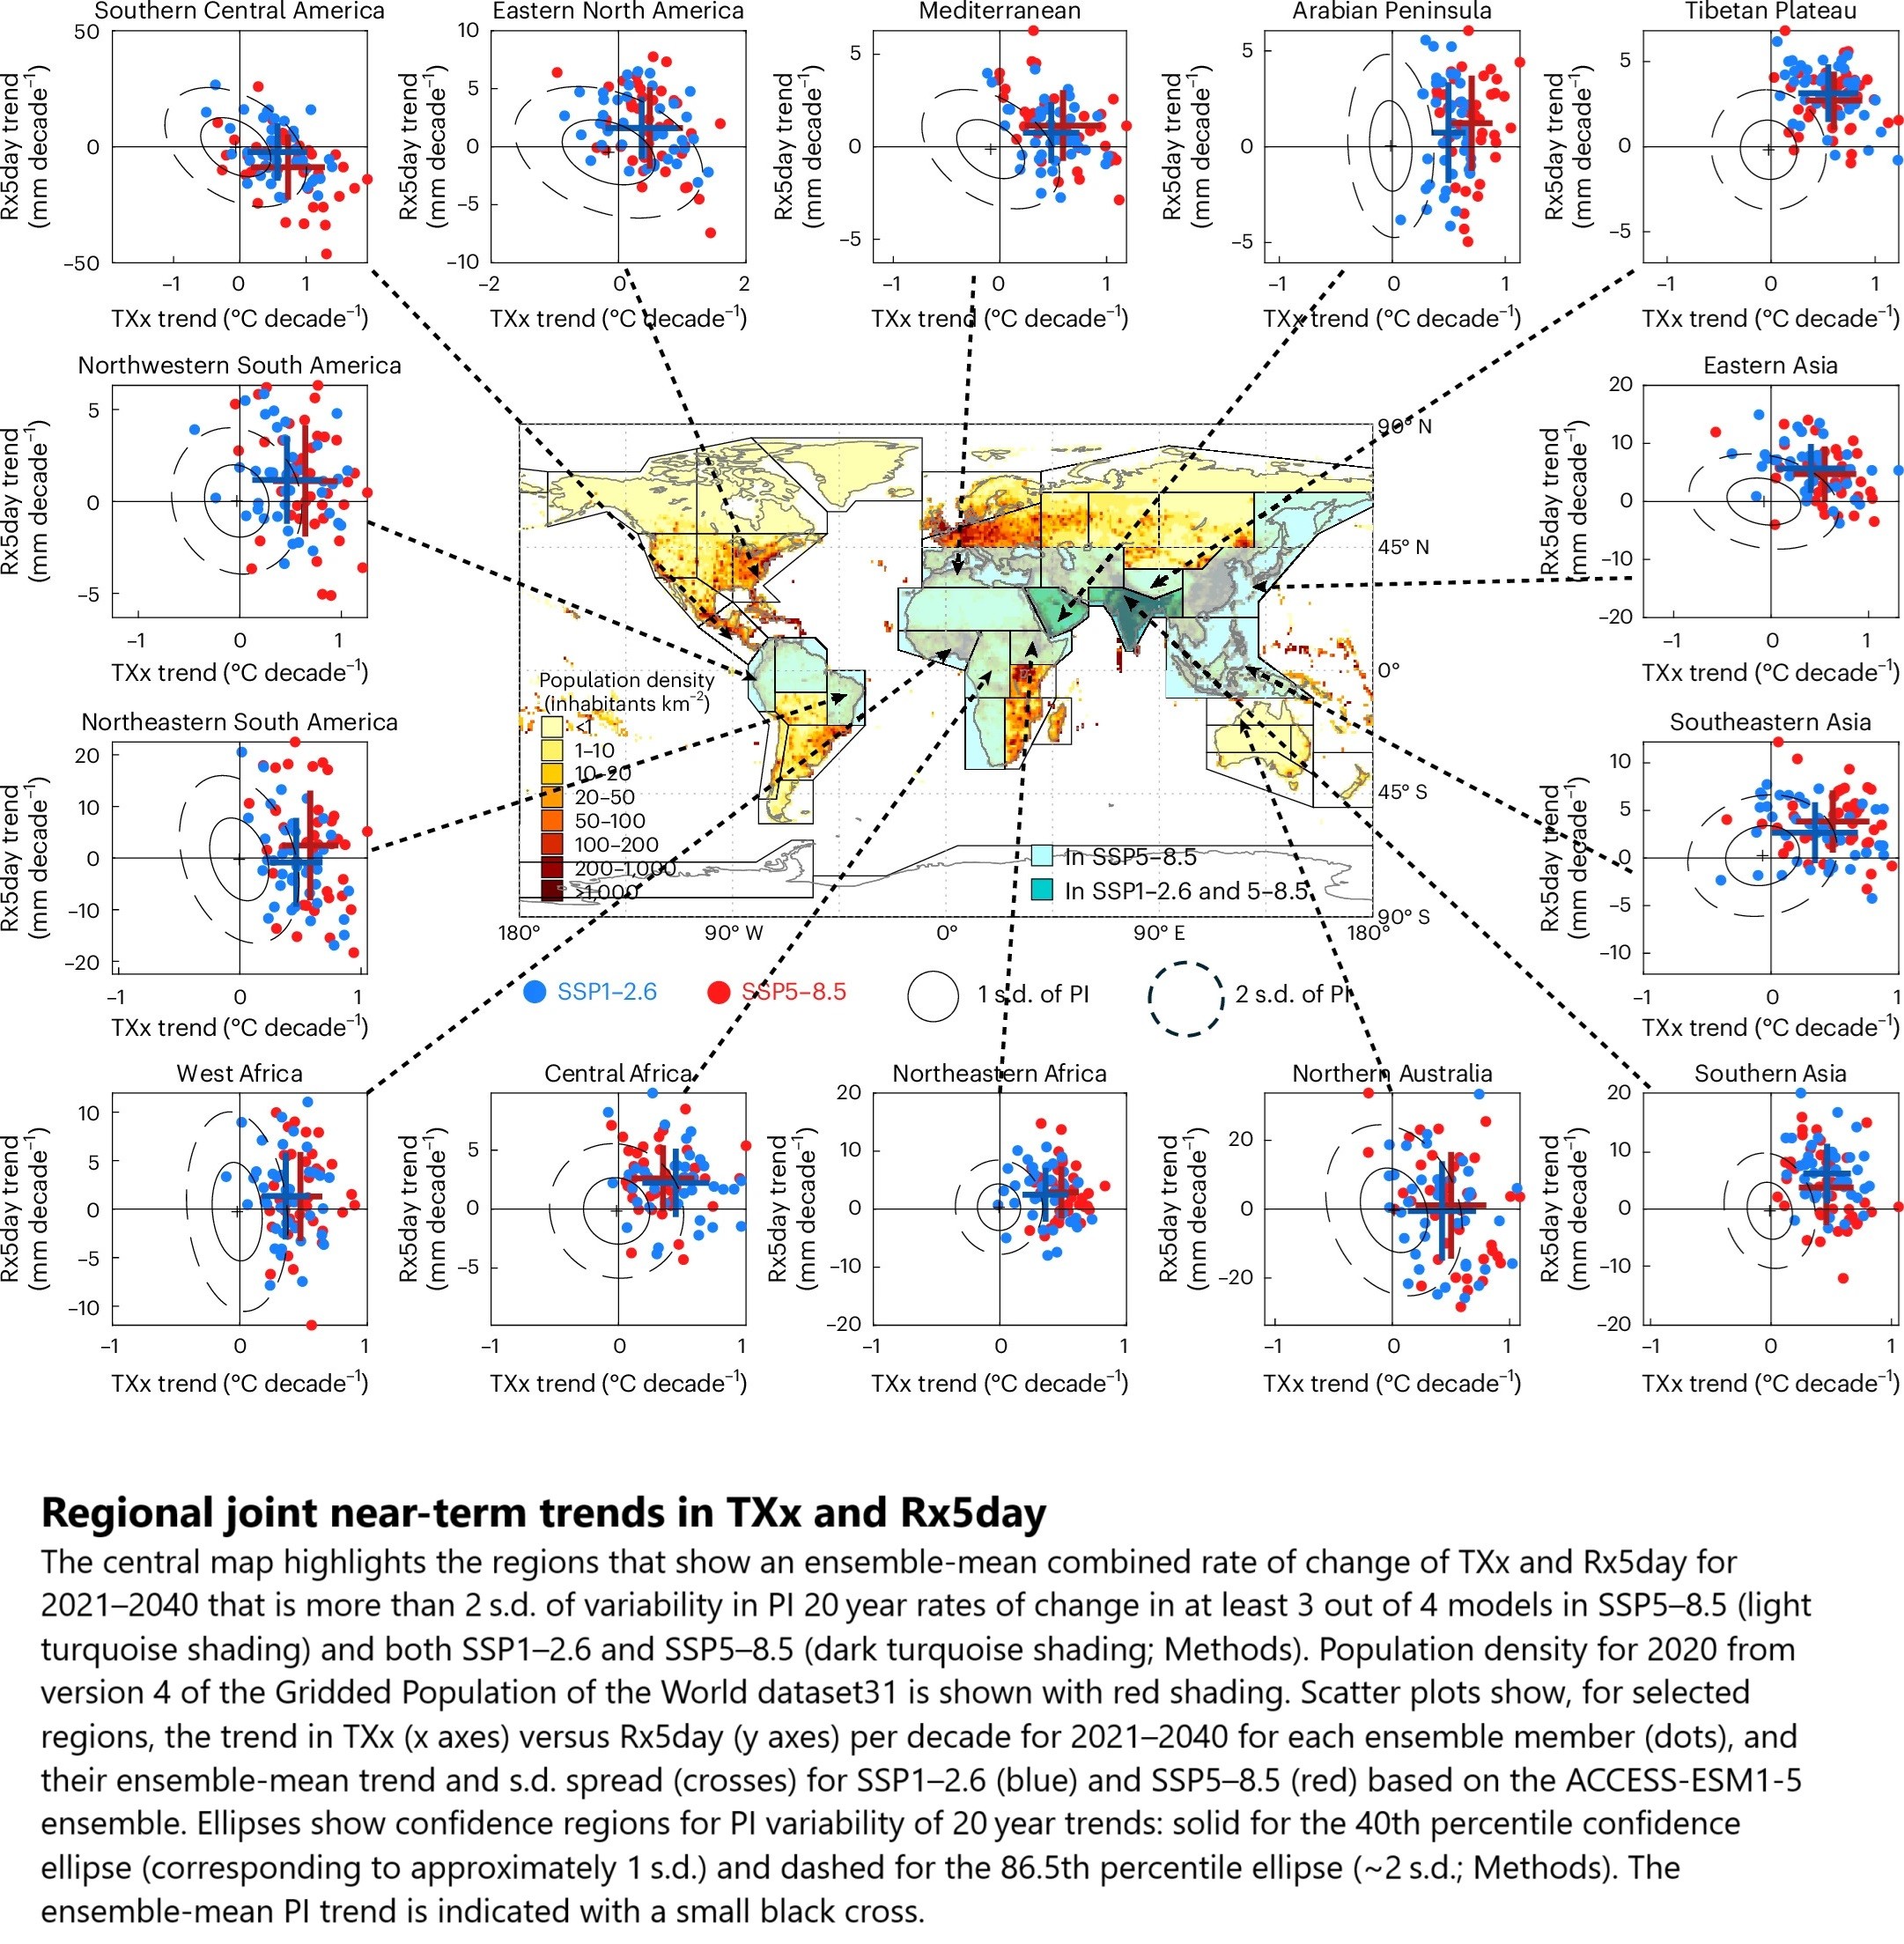
Strong Regional Trends In Extreme Weather Over The Next Two Decades Under High- And Low-Emissions Pathways
--
https://www.nature.com/articles/s41561-024-01511-4 <-- shared technical article
--
#GIS #spatial #mapping #spatialanalysis #spatiotemporal #climatechange #globalwarming #climate #extremeweather #global #regions #ratesofchange #risk #hazard #prediction #model #modeling #numericalmodeling #simulation #geostatistics #climatemodel #tropics #subtropics #emmissions #temperature #precipitation #water #rainfall #hydrology #flood #flooding #wildfire #fire #drought #storms #monsoon #typhons #hurricanes #Asia #Africa
![maps - [global] Spatial patterns of near-term joint rates of change in extremes, and their components](https://files.mastodon.social/cache/media_attachments/files/113/166/737/446/072/759/original/d052a1ae3c464b6b.jpg)
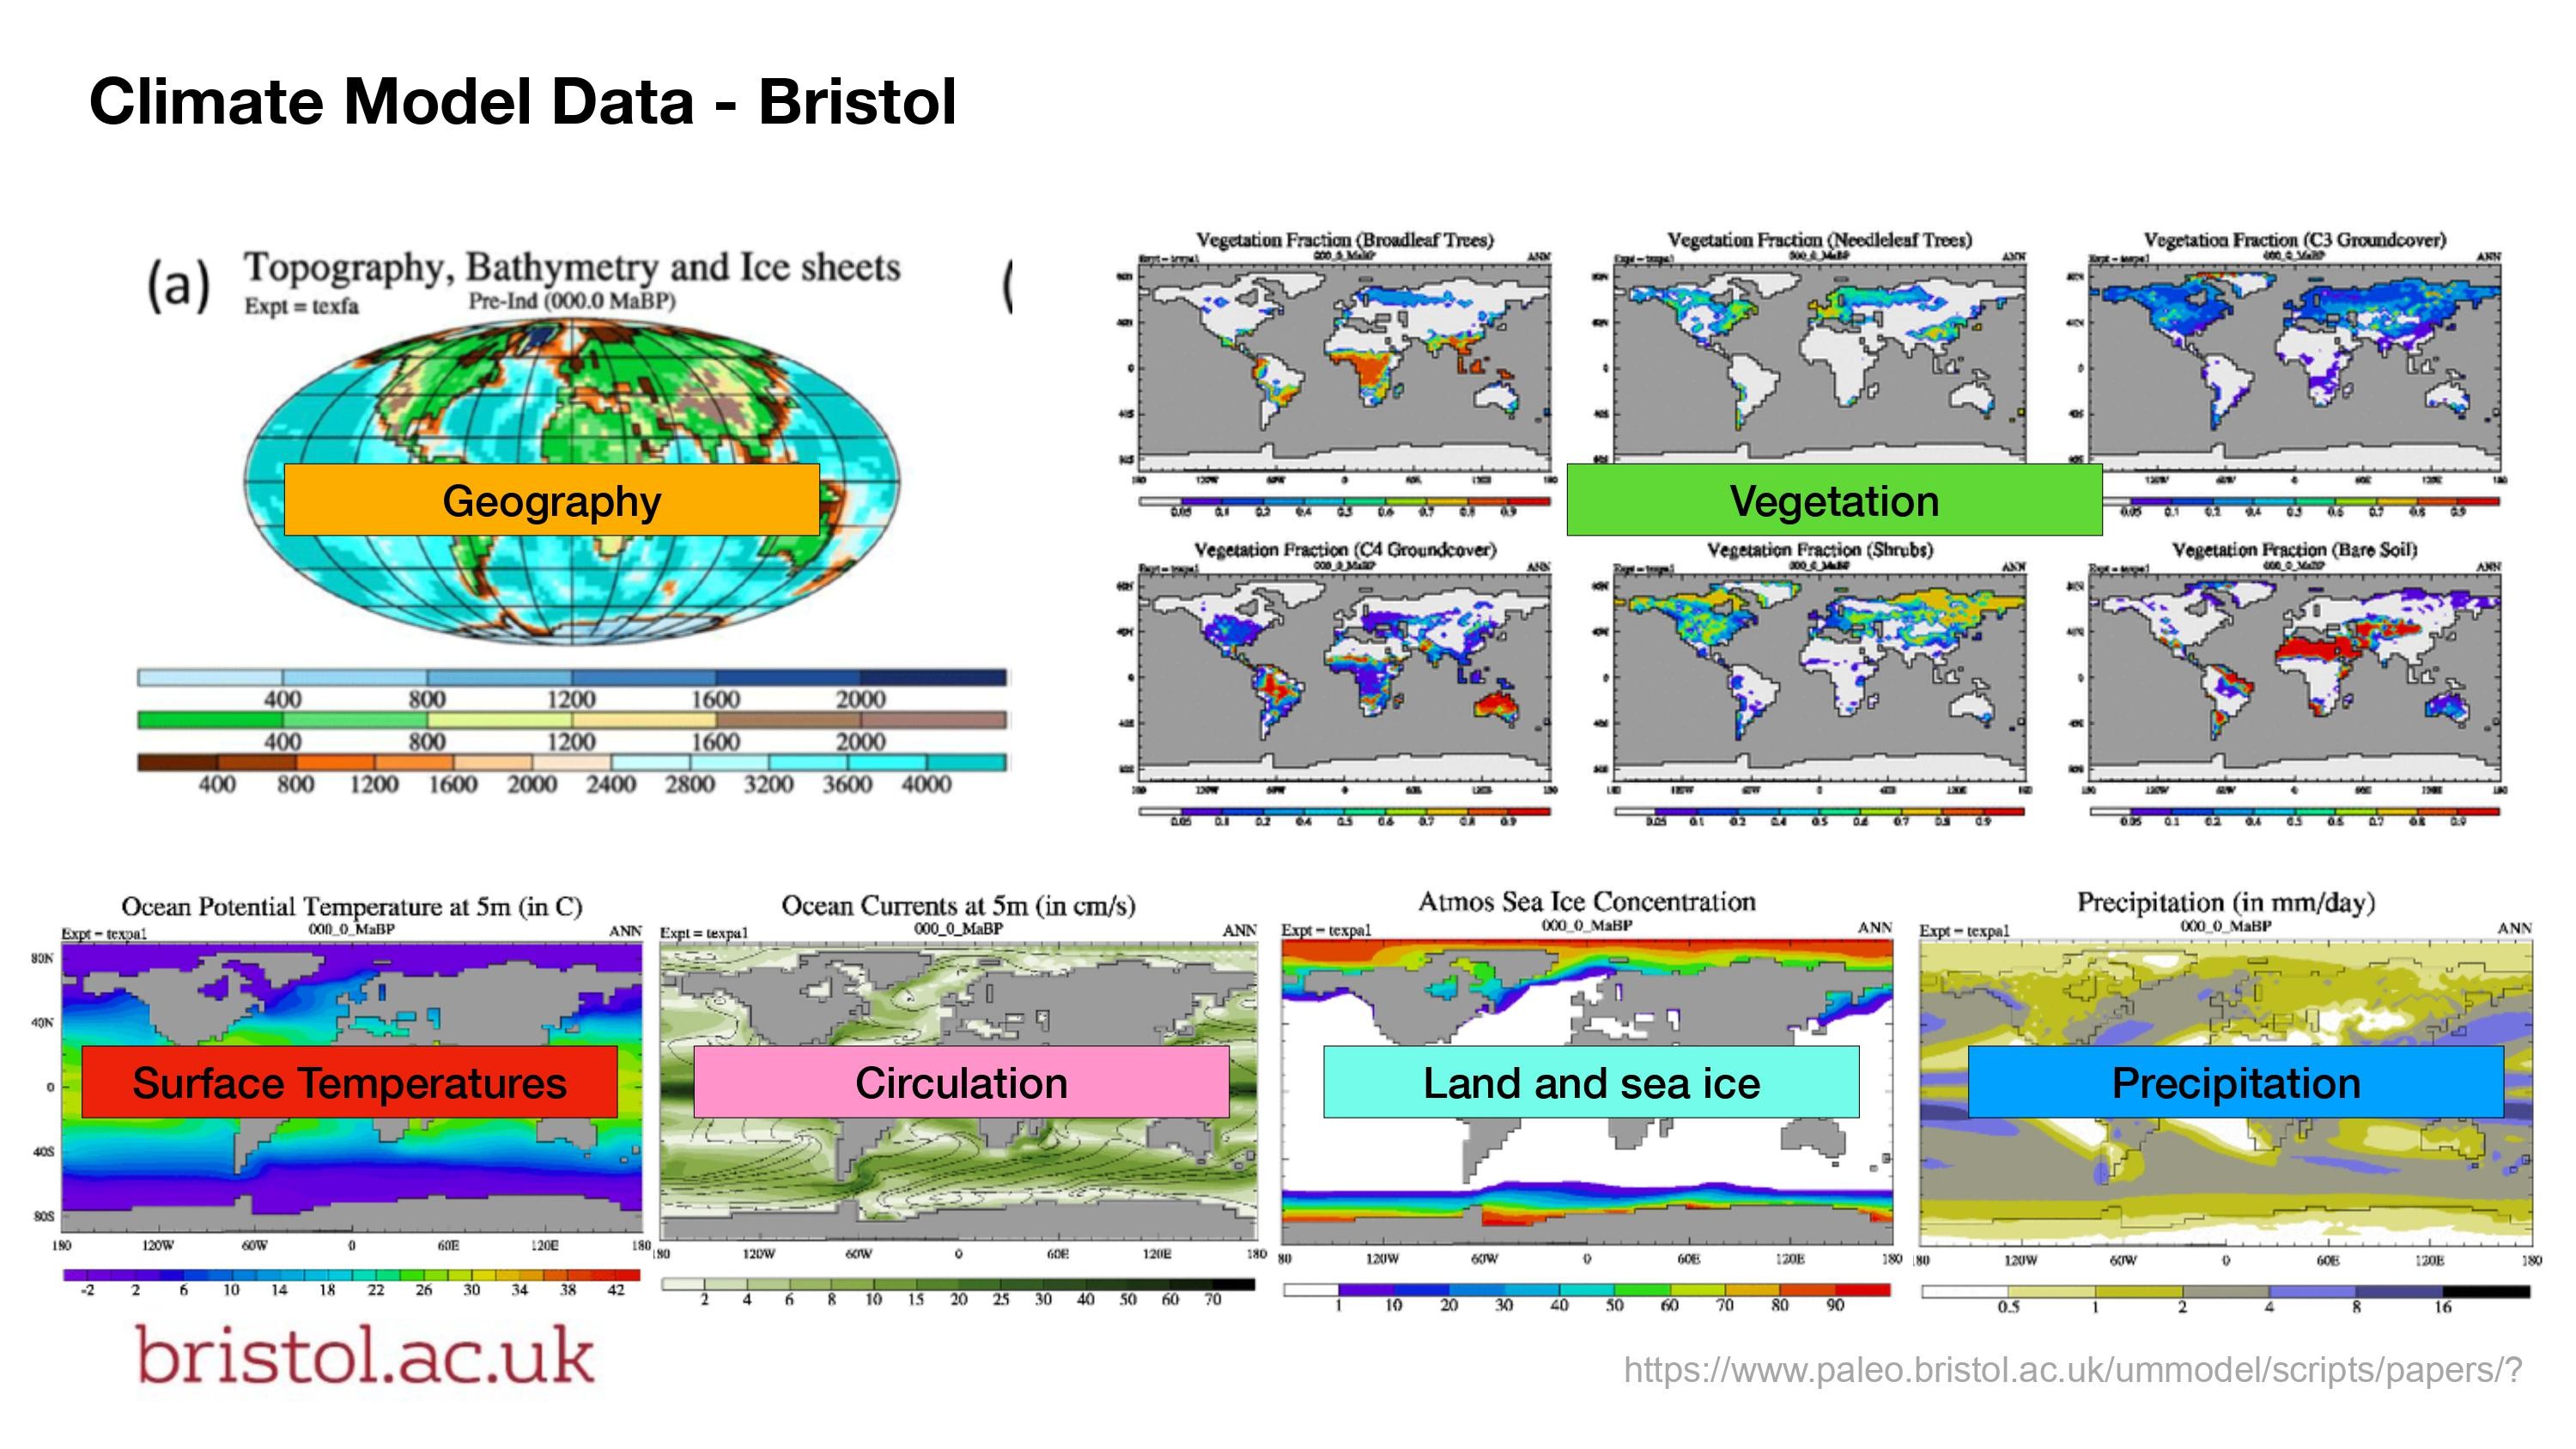
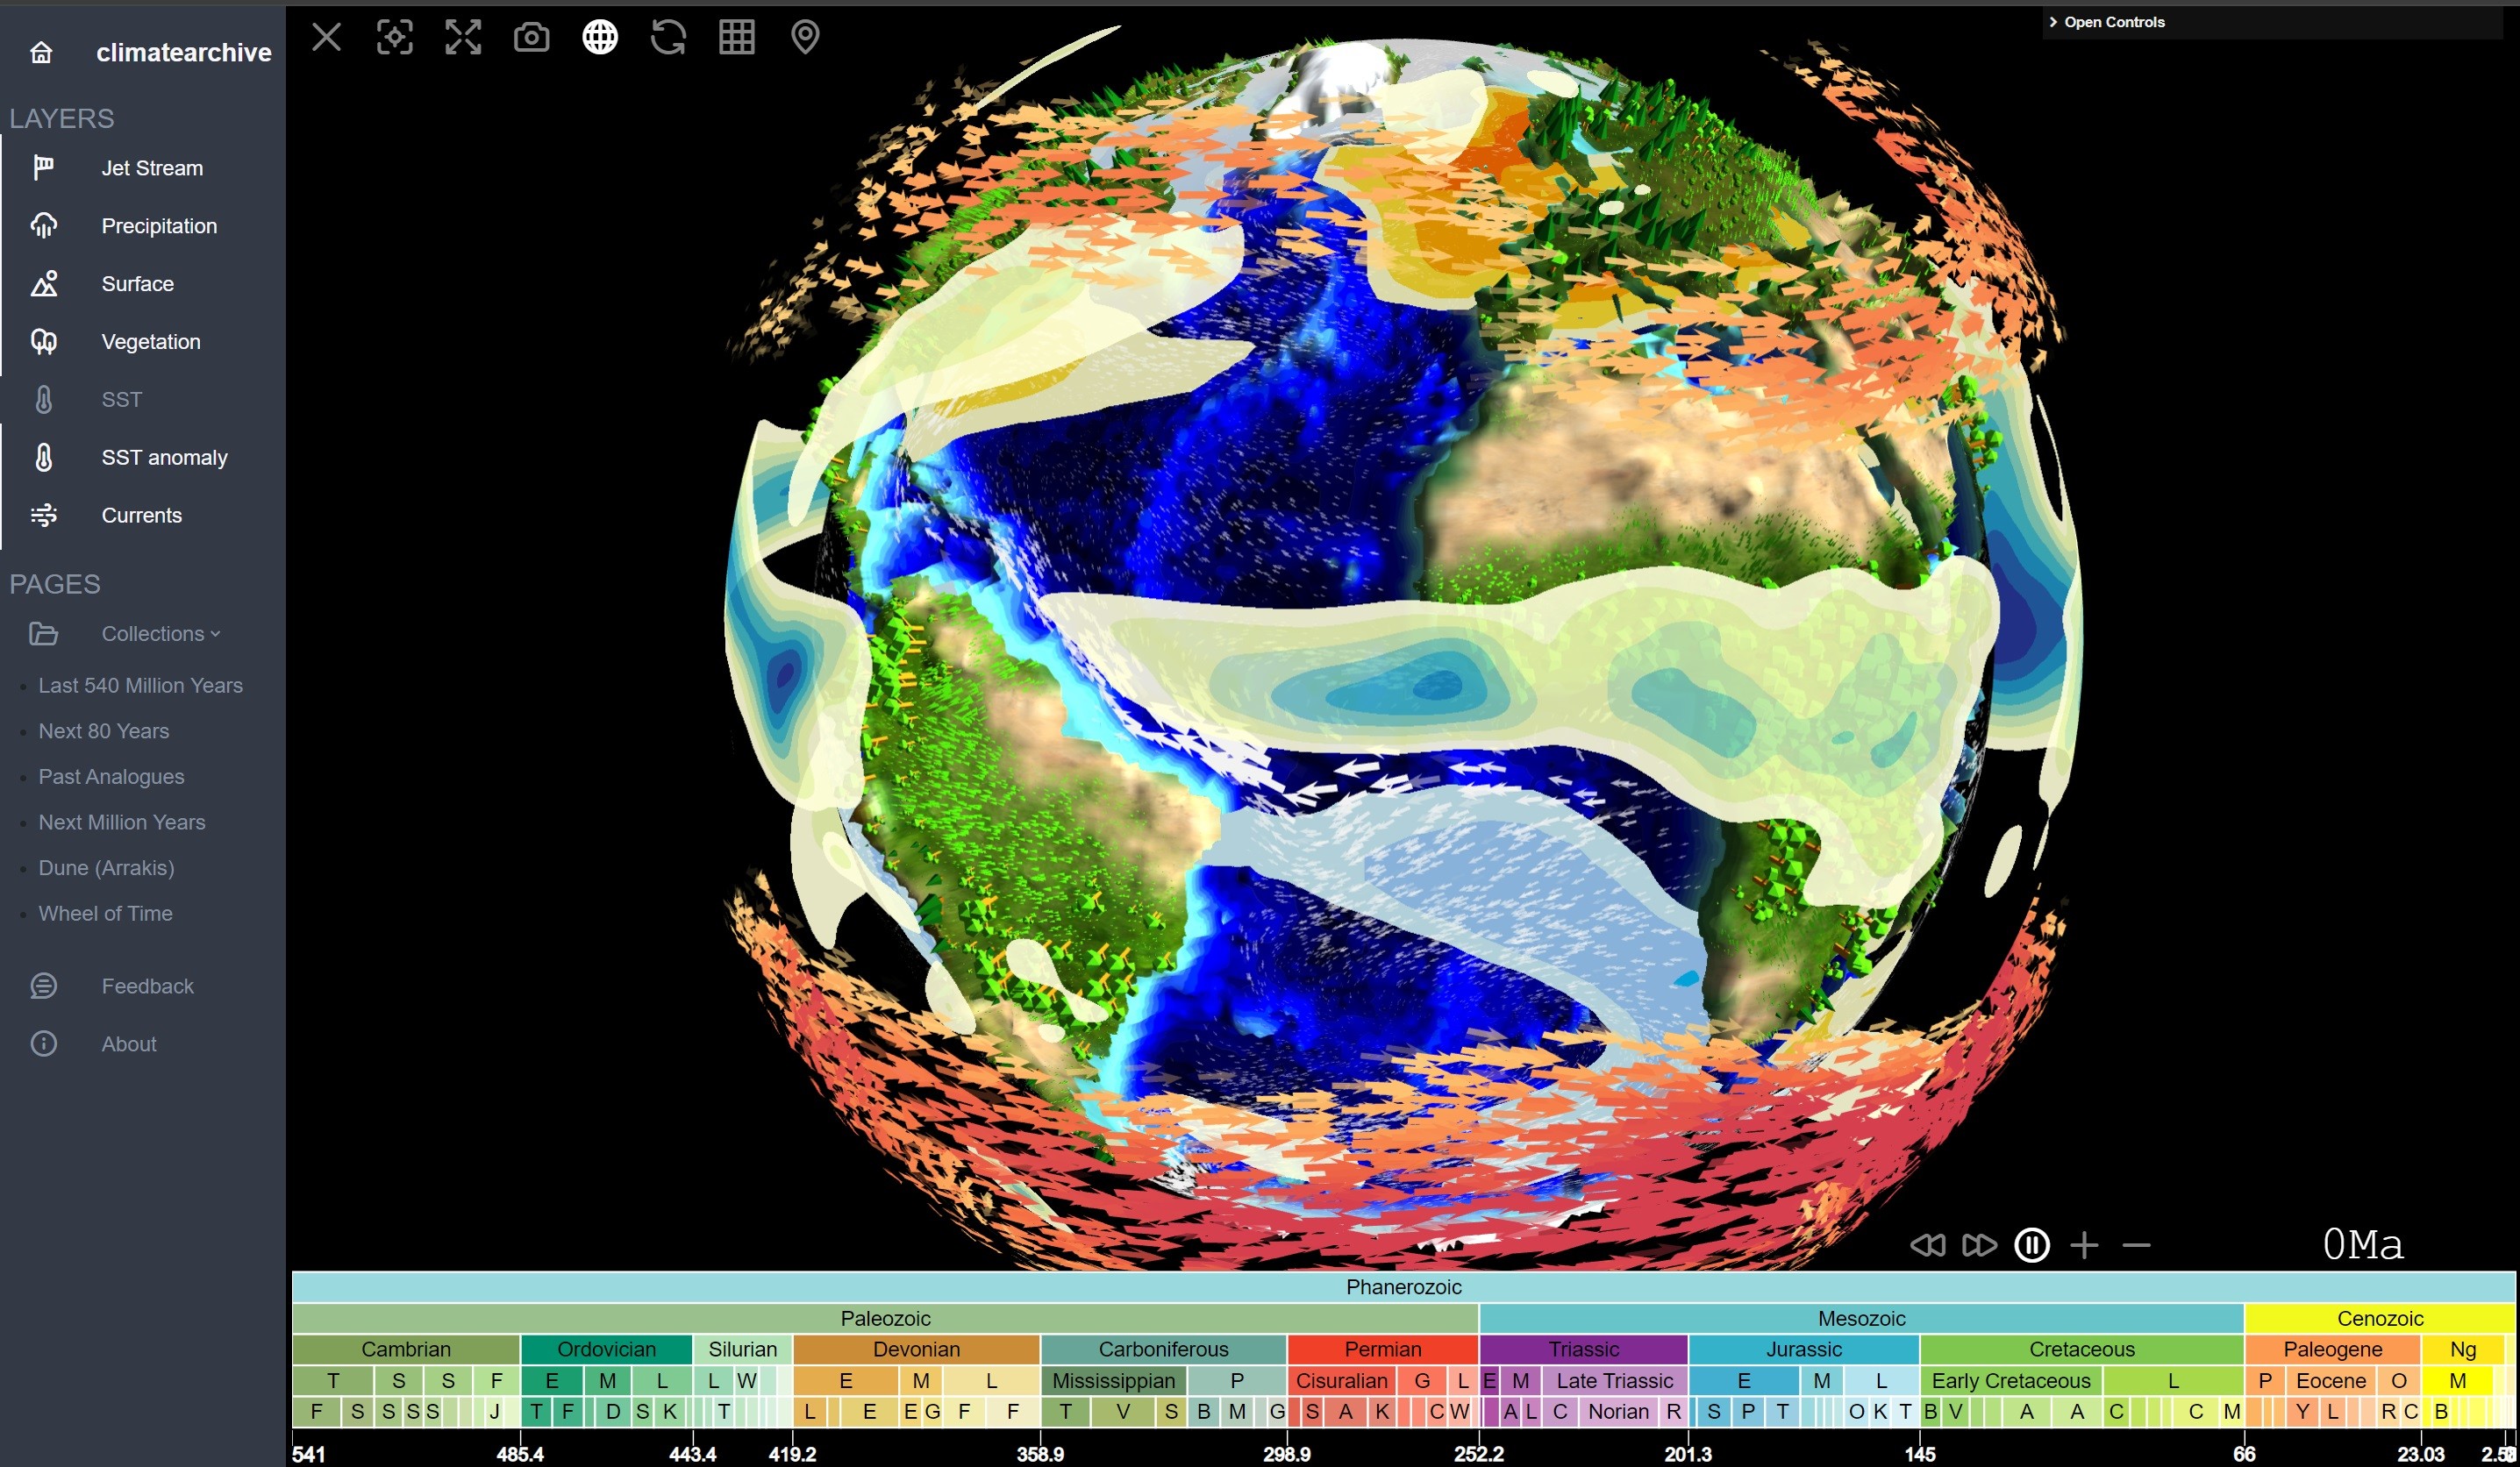
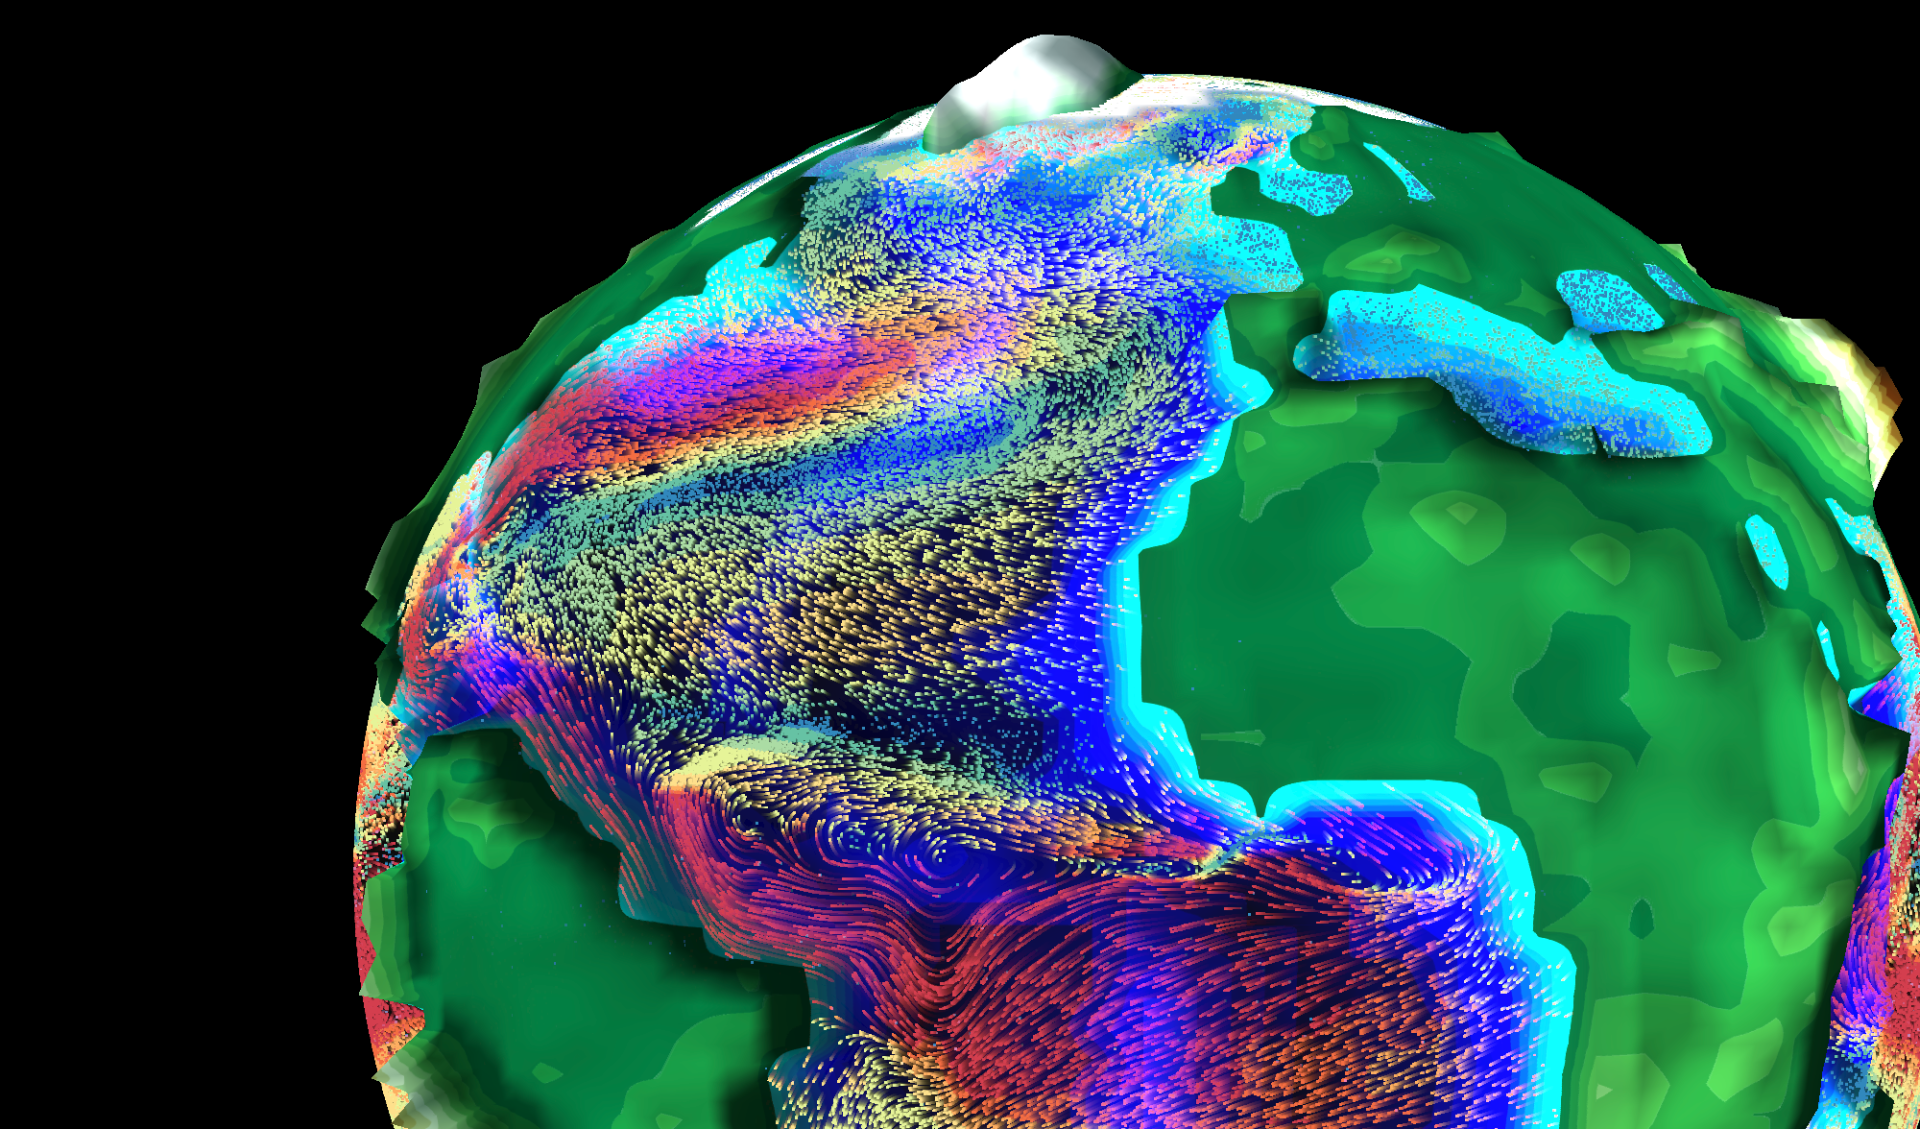
Explore 500 Million Years Of Climate Data Across The Changing Globe With Climatearchive.Org
--
https://jeangoldinginstitute.blogs.bristol.ac.uk/2021/08/09/climatearchive-org-540-million-years-of-climate-history-at-your-fingertips/ <-- shared technical article
--
https://climatearchive.org/ <-- shared technical resource
--
#GIS #spatial #mapping #climate #opensource #climatehistory #openscience #download #webmap #global #visualisation #climatemodel #climatechange #society #ecosystems #environmentalscience #integration #model #modeling #interdisciplinary #climatedynamics #webapplication #paleoclimate #opendata

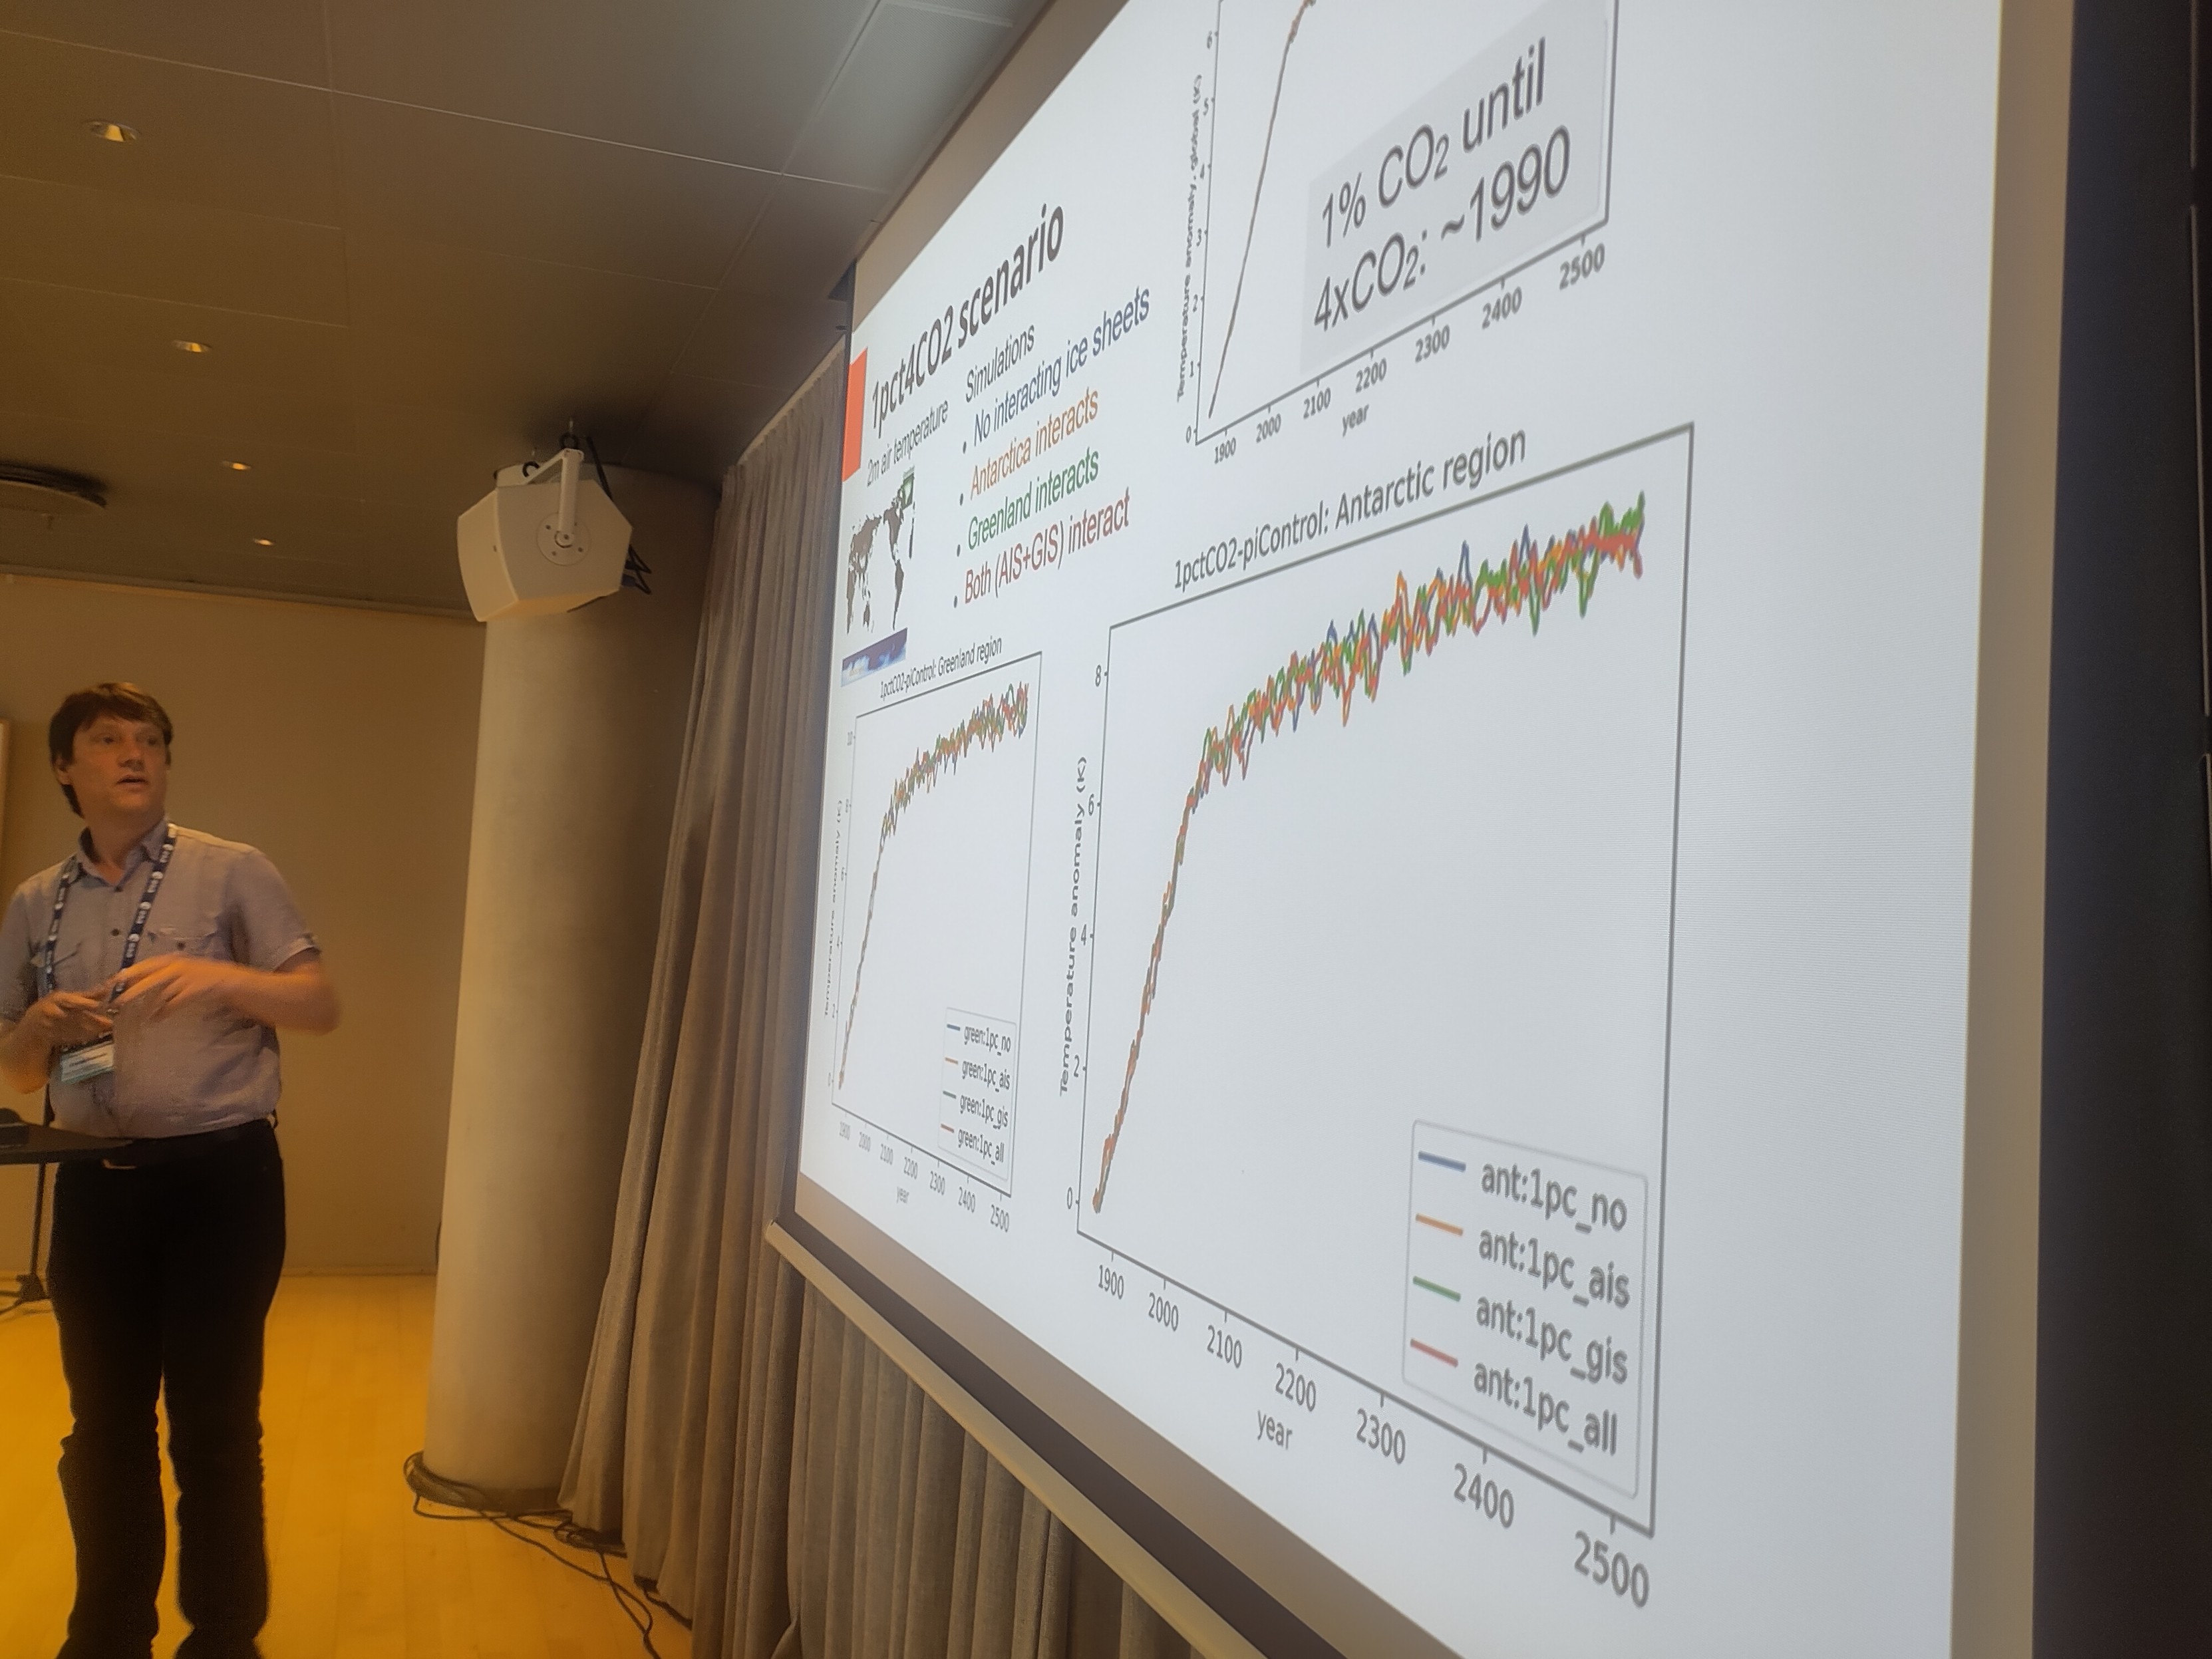
Another piece of #ClimateModel and #IceSheetModel work presented by colleague Christian Rodehacke, with work from the @AWI@helmhotz.social group using a coupled system to show how the 2 ice sheets might work together and separately in the climate system as also part of @H2020protect.bsky.social
7/9
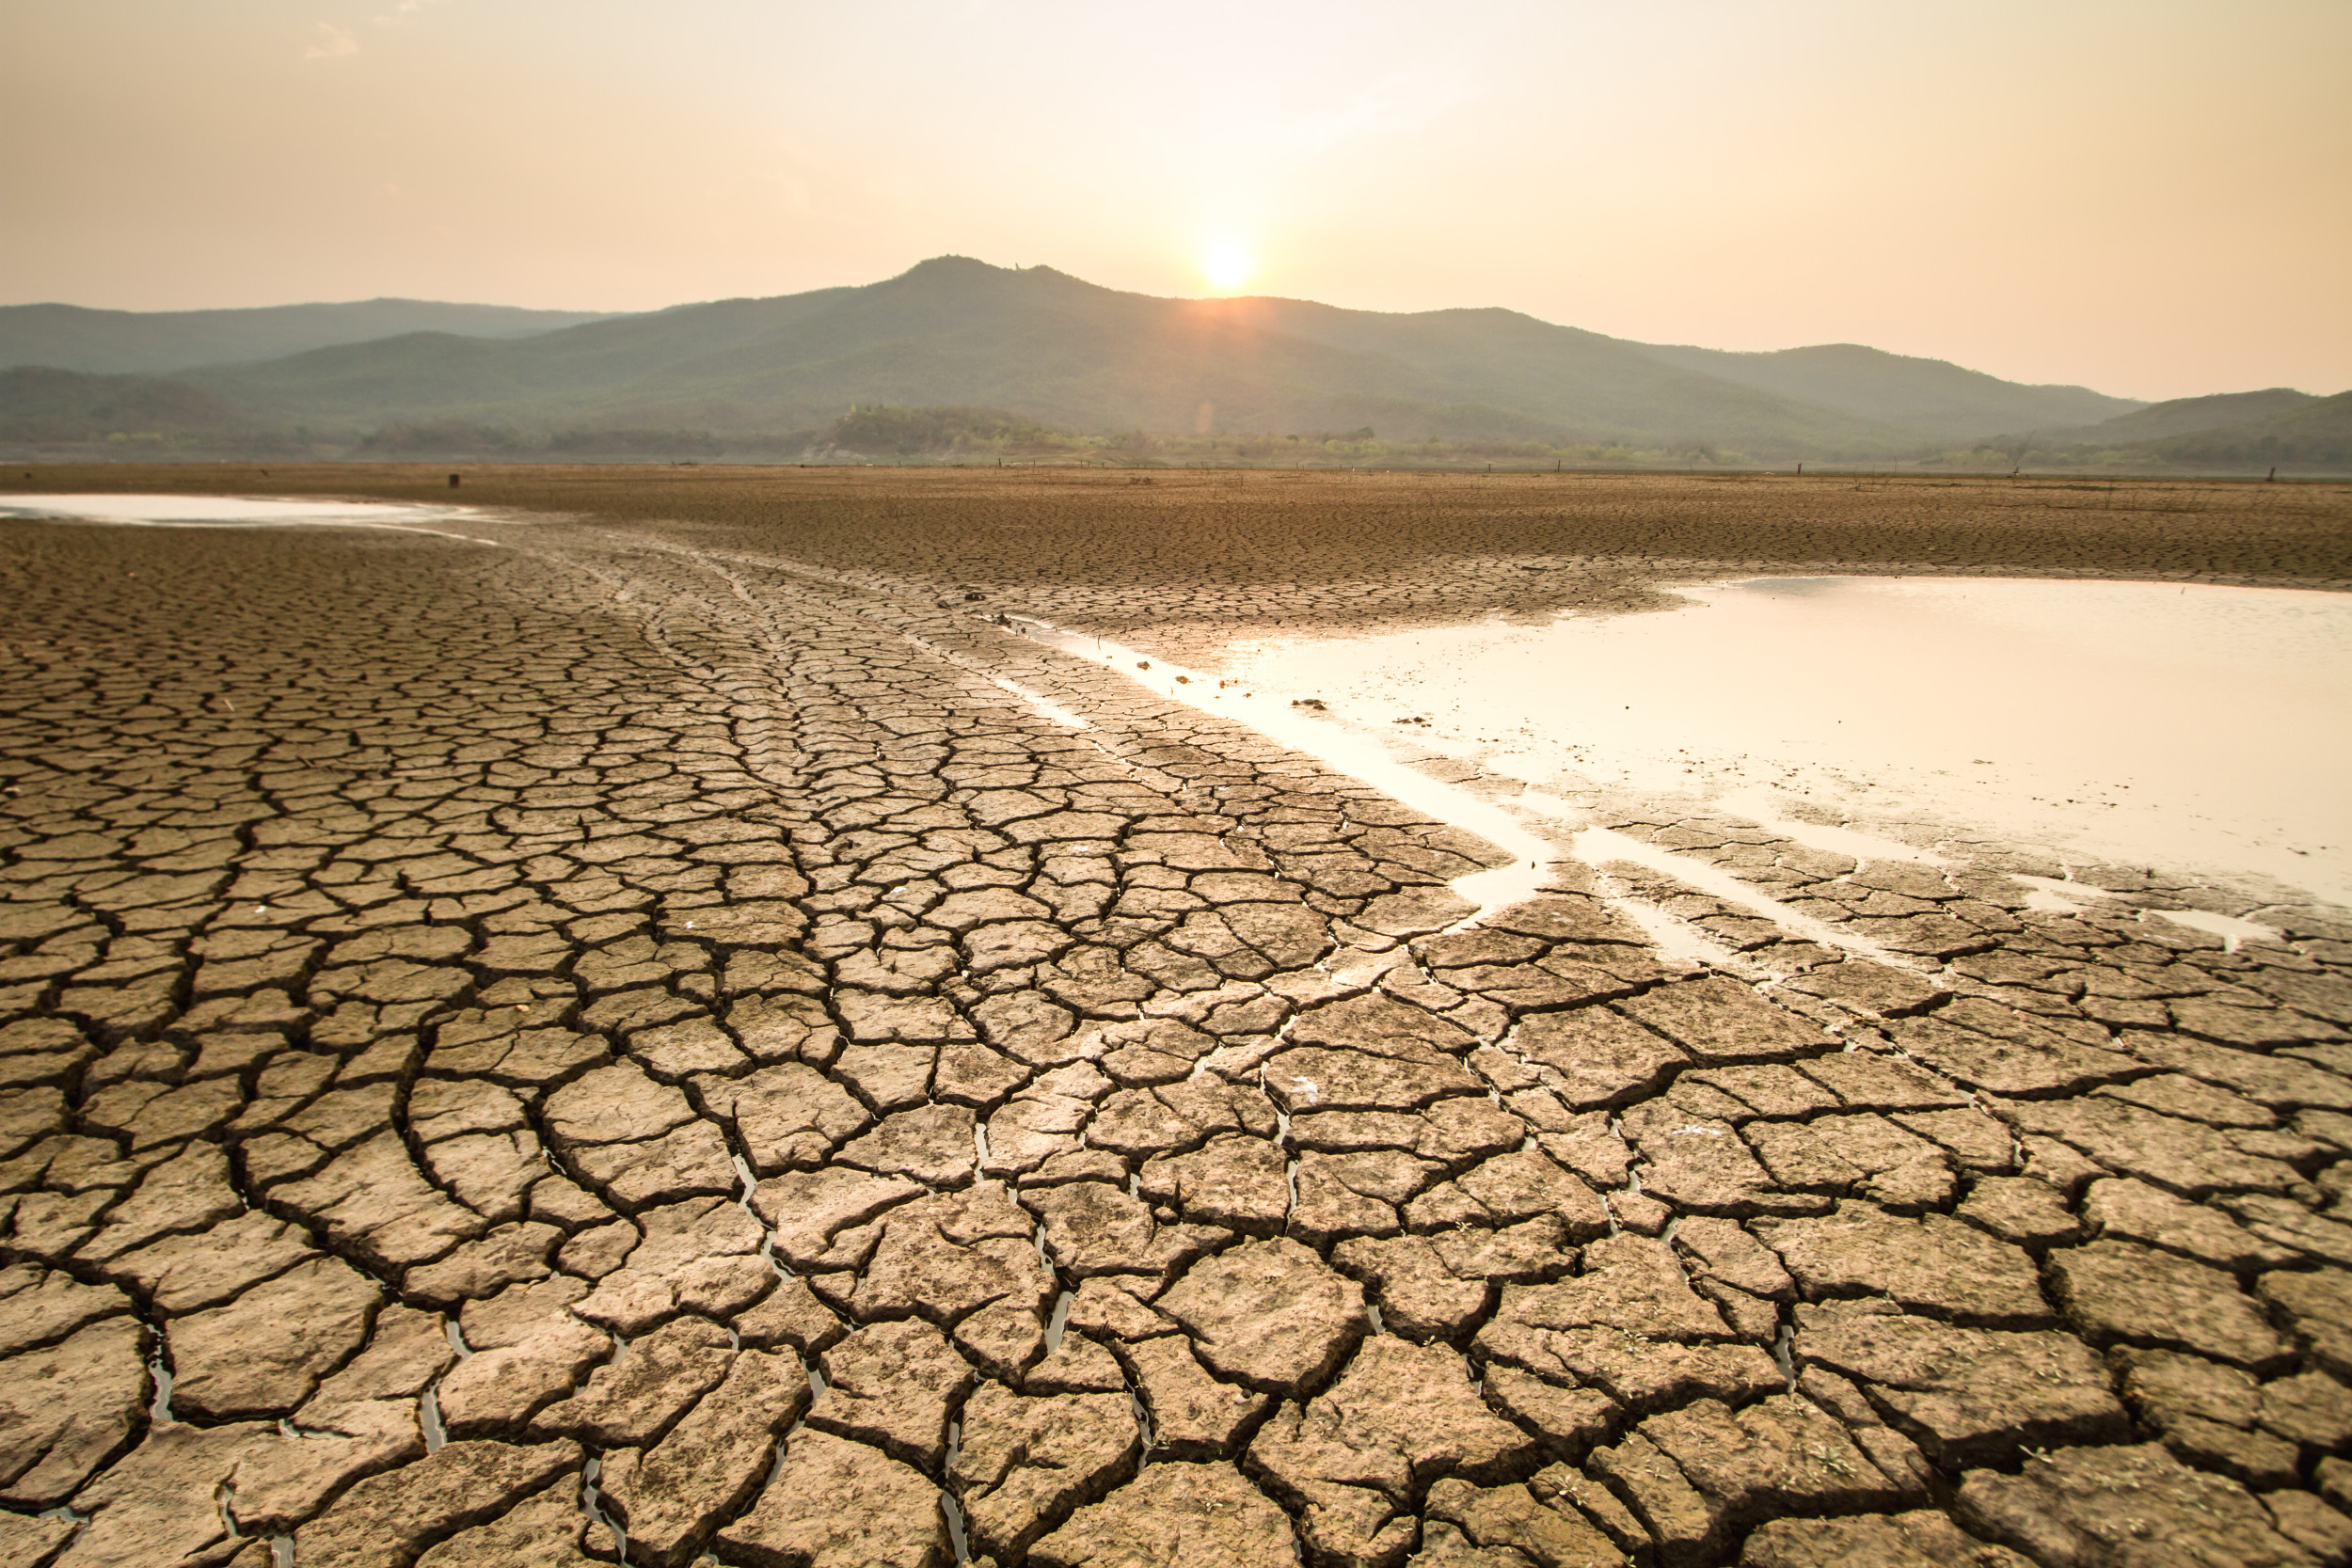
The great Scandinavian drought of 2018 cost Danish agriculture alone ~ EUR 550million - what are the prognoses for the future?
Great talk by our #NCKF PhD student Rüben Haberli on high res convection permitting #ClimateModel simulations to understand #drought in #Scandinavia
#HCLIM #NMM2024
"Forests moderate local climate by keeping their local environments cool. They do this partly by shading the land, but also by releasing moisture from their leaves. This process, called transpiration, requires energy, which is extracted from the surrounding air, thus cooling it. A single tree can transpire hundreds of liters of water in a day. Each hundred liters has a cooling effect equivalent to two domestic air conditioners for a day, calculates Ellison."
https://e360.yale.edu/features/how-deforestation-affecting-global-water-cycles-climate-change
It's now part of my new #Tegtmeier project: figure out how much eg. European and American land use change has impacted local, regional and continental weather. See above posting where I asked this question, too.
So I plot #treering widths alongside d18O from #speleothem (eg. stalagmite). Both proxies are precisely dated and (can) have annual resolution.
I would expect to see a warming =
trees grow more when, at locations from where "their weather comes", other forests are felled .
And a drying =
d18O increase in speleothems.
I use #GoogleEarth and my rudimentary history knowledge to determine certain locations in Australia, New Zealand, USA and Europe. tbc.🍿
Are previous now long-gone biomes factored into regional warming modelling?
A proxy for a 560ppm period from eg., US or Europe necessarily gives diff rain and °C than it will be tomorrow at #560ppm #CO2 with all the previous forests gone.
How different tho?
#Burke et al 2018 is no answer. https://www.pnas.org/doi/10.1073/pnas.1809600115
They modelled climate analogs for warming scenarios on a very high resolution global map. You can look up your location on a map for instance in a RCP4.5 pathway and see the colour-coded analog from past climates at a given CO2 concentration and from 2020 to 2280. Or watch a gif like the one below for RCP4.5.
But they did not factor in the changed hydrological cycle &, so I think, the hence necessarily changed temperature from previously existing biomes that vanished in LUC.
Eg, Aotearoa🇳🇿without forests wouldn't have been named Land Of The Long White Cloud. Tree-less, it would have been warmer and dryer. But proxies only tell us the then-climate with the then-biomes at play.
And since almost all land mass has been changed by humans, regional proxies from past 560ppm periods are no longer valid as analogs.
A Berlin at +6°C in the Eocene would be different to a Berlin at 6°C tomorrow because all the forests from the Atlantic coast to Berlin and beyond have been altered / felled. Which affects the local weather, and even the 250hPa jet. So has far-reaching impacts.
Am I mistaken?
#paleoclimate #ECS #climateModel
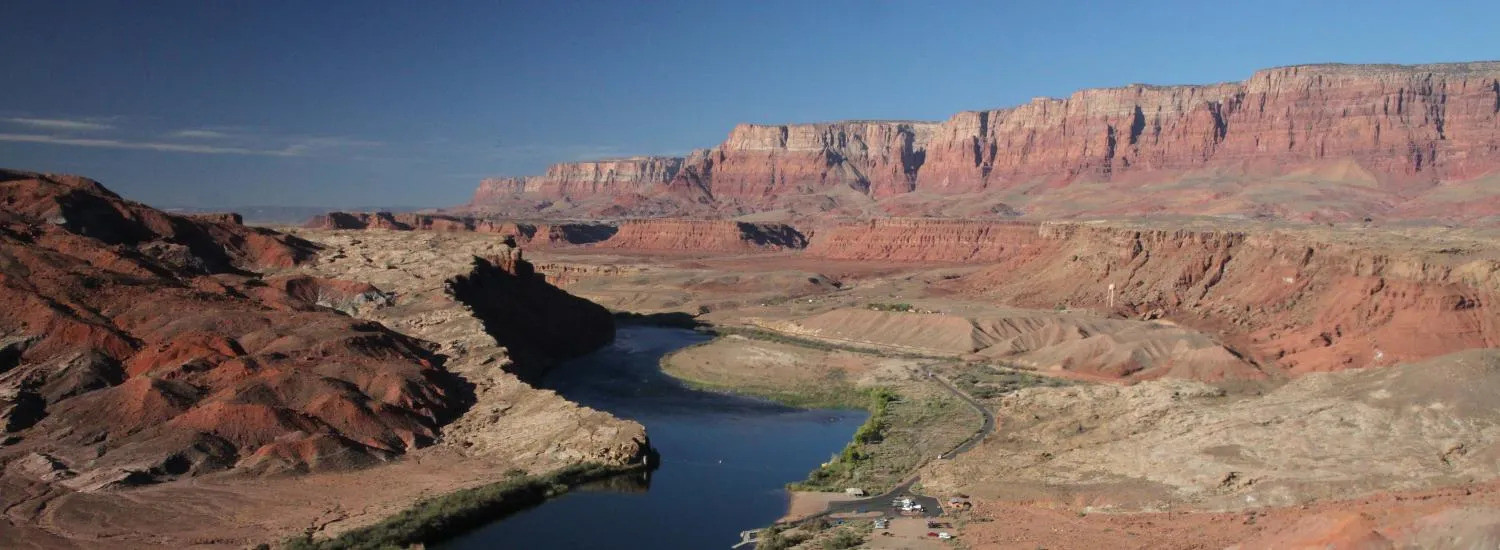
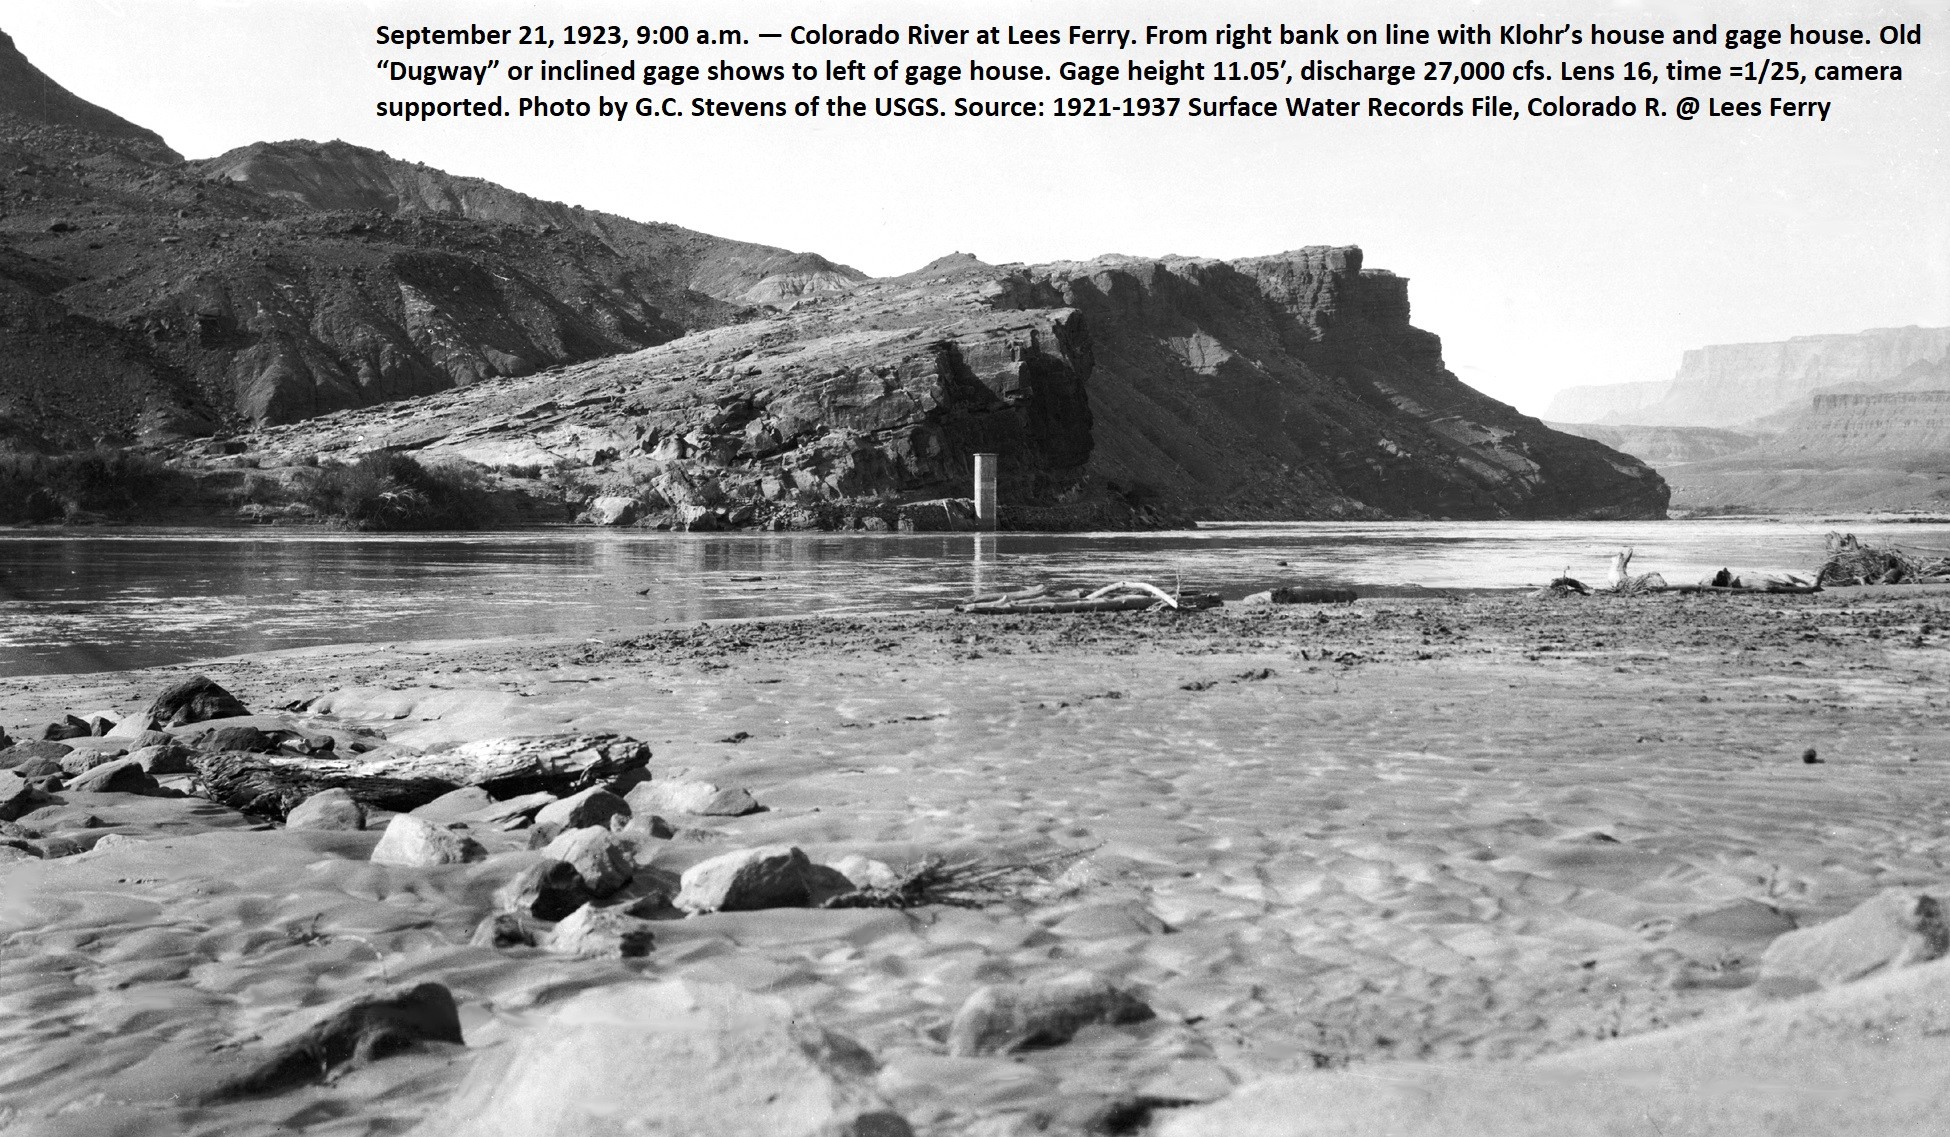
Precipitation May Brighten Colorado River’s Future
--
https://cires.colorado.edu/news/precipitation-may-brighten-colorado-rivers-future <-- shared technical article
--
https://doi.org/10.1175/JCLI-D-23-0617.1 <-- shared paper
--
#GIS #spatial #mapping #modeling #model #water #hydrology #waterresources #prediction #climatechange #Colorado #ColoradoR #ColoradoRiver #drought #watersecurity #planning #management #temperature #precipitation #rainfall #snow #snowpack #headwaters #watersheds #USWest #watermanagers #IPCC #LeeFerry #ColoradoRiverCompact #climatemodel #basin #geography #spatialanalysis #vulnerability
@CIRES
This morning's science talk is by my ace DMI colleague Shuting Yang on the plans for #CMIP7 (the next #ClimateModel intercomparison project. Thanks to @steve + colleagues, this is an extraordinary graphic of the size of the effort...
Like a falling calendar leaf in a vintage cinematic calendar montage, here's our weekly release of rolling #ClimateMythRebuttal revisions.
This time it's about confusing climate models with weather prediction. Despite claims to the contrary, imperfect weather prediction skill does not speak to #ClimateModel validity.
Even less helpfully for climate model detractors, with steadily increasing skills climate models are showing distinct promise with seasonal climatic prediction duties.
❔What is the difference between a #regional and #global #climatemodel?
👉Find out in the latest #PolarRES in the Spotlight video about climate models, featuring @ruthprice95, @dr_gilbz and @Ruth_Mottram
Check out the video 🎬👇
https://polarres.eu/polarresnews/polarres-in-the-spotlight-climate-models/

I'm not a scientist, but this is how a simulated collapse of AMOC actually looks like. Source link in second reply.
Right axis = Sv = flow of water
Grey line = AMOC
• 150 years = slow reduction in flow from about 12 to 10 Sv
• 100 years = yellow band = collapse of Amoc. It drops roughly from 10 to 2 Sv
• 150 years = slow reduction to zero flow
(1/3)
#Amoc #ClimateModel #Climate
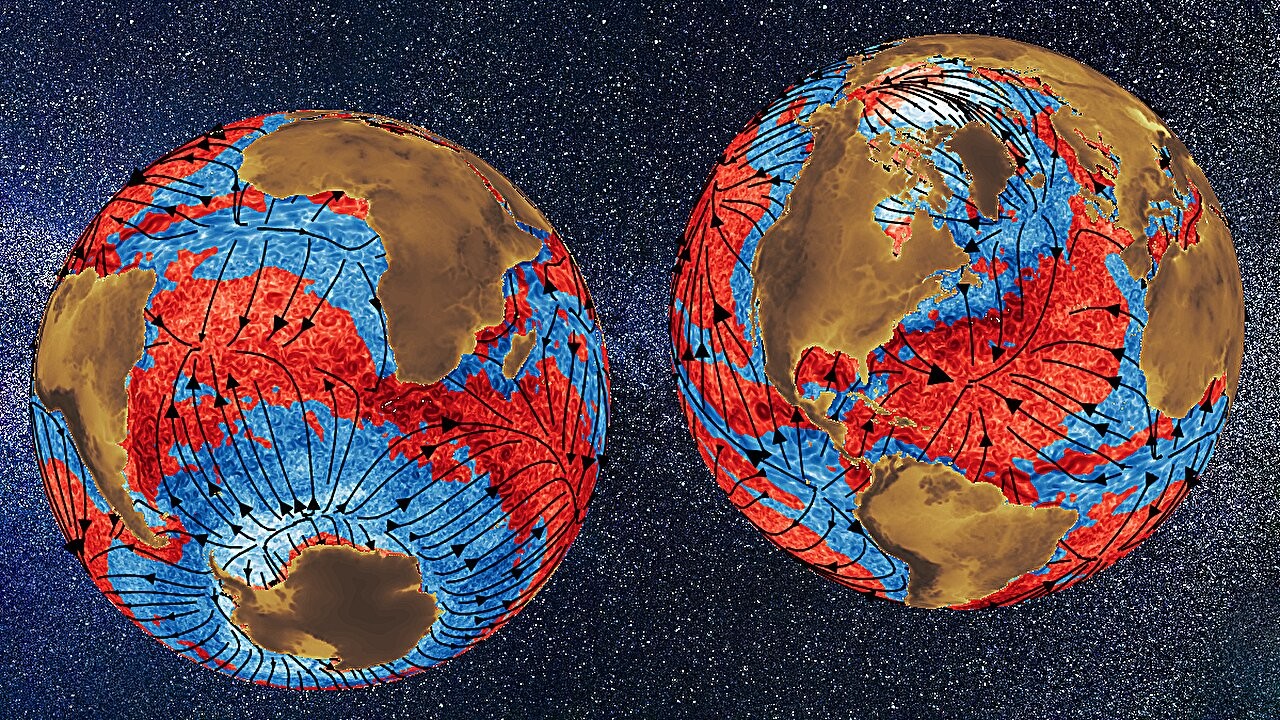
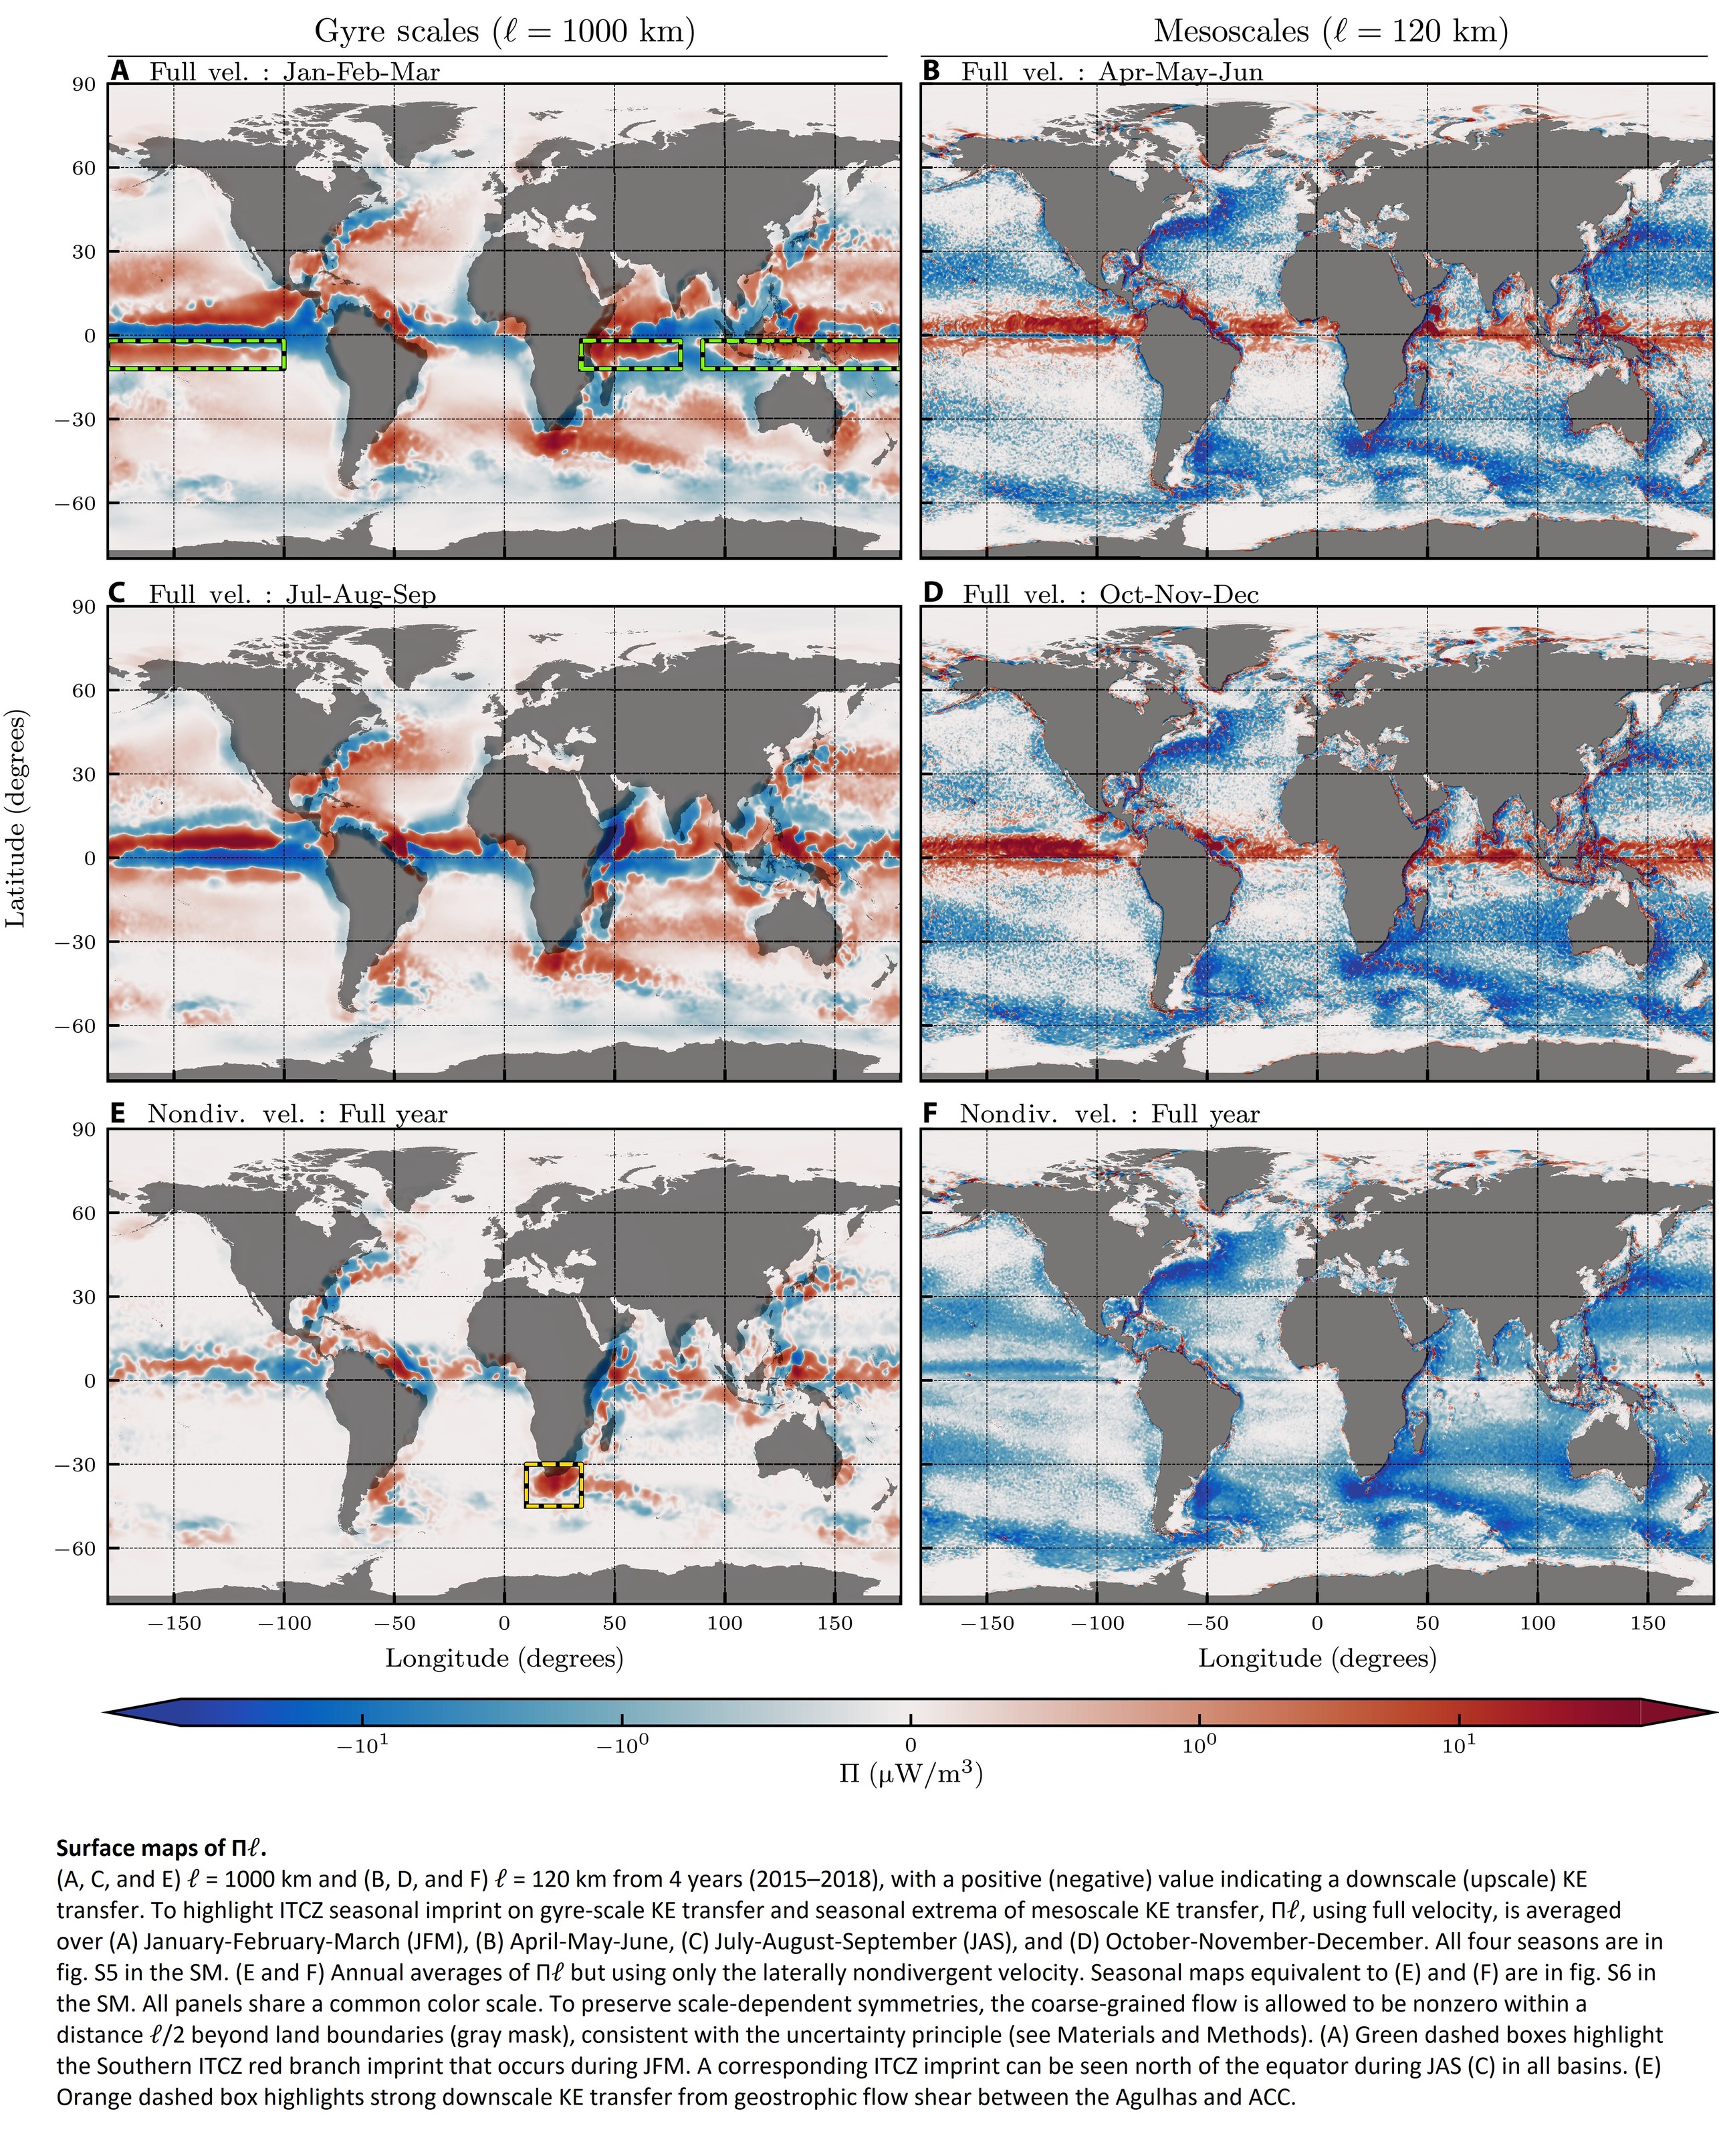
Scientists Uncover Link Between Ocean Weather And Global Climate, Using Mechanical Rather Than Statistical Analysis
--
https://phys.org/news/2023-12-scientists-uncover-link-ocean-weather.html <-- shared technical article
--
https://doi.org/10.1126/sciadv.adi7420 <-- shared paper
--
#GIS #spatial #mapping #remotesensing #model #modeling #global #model #modeling #numericmodeling #ocean #weather #oceanweather #globalclimate #climatechange #atmosphere #mathematicalmodeling #energytransfer #climatemodel #satellite #earthobservation
Last days of work before Christmas and looking for a paper to read to procrastinate all other ToDo-items? 🤶
I present to you our latest paper, on parameterising #melt at the base of #Antarctic ice shelves with #NeuralNetworks! 🌊 🧊 💻
http://doi.org/10.1029/2023MS003829
Coauthors on Mastodon: @nicojourd @tobifinn
#ClimateModel #ClimateChange #IceSheet #Modeling #PolarRegions #OceanModel #Ocean
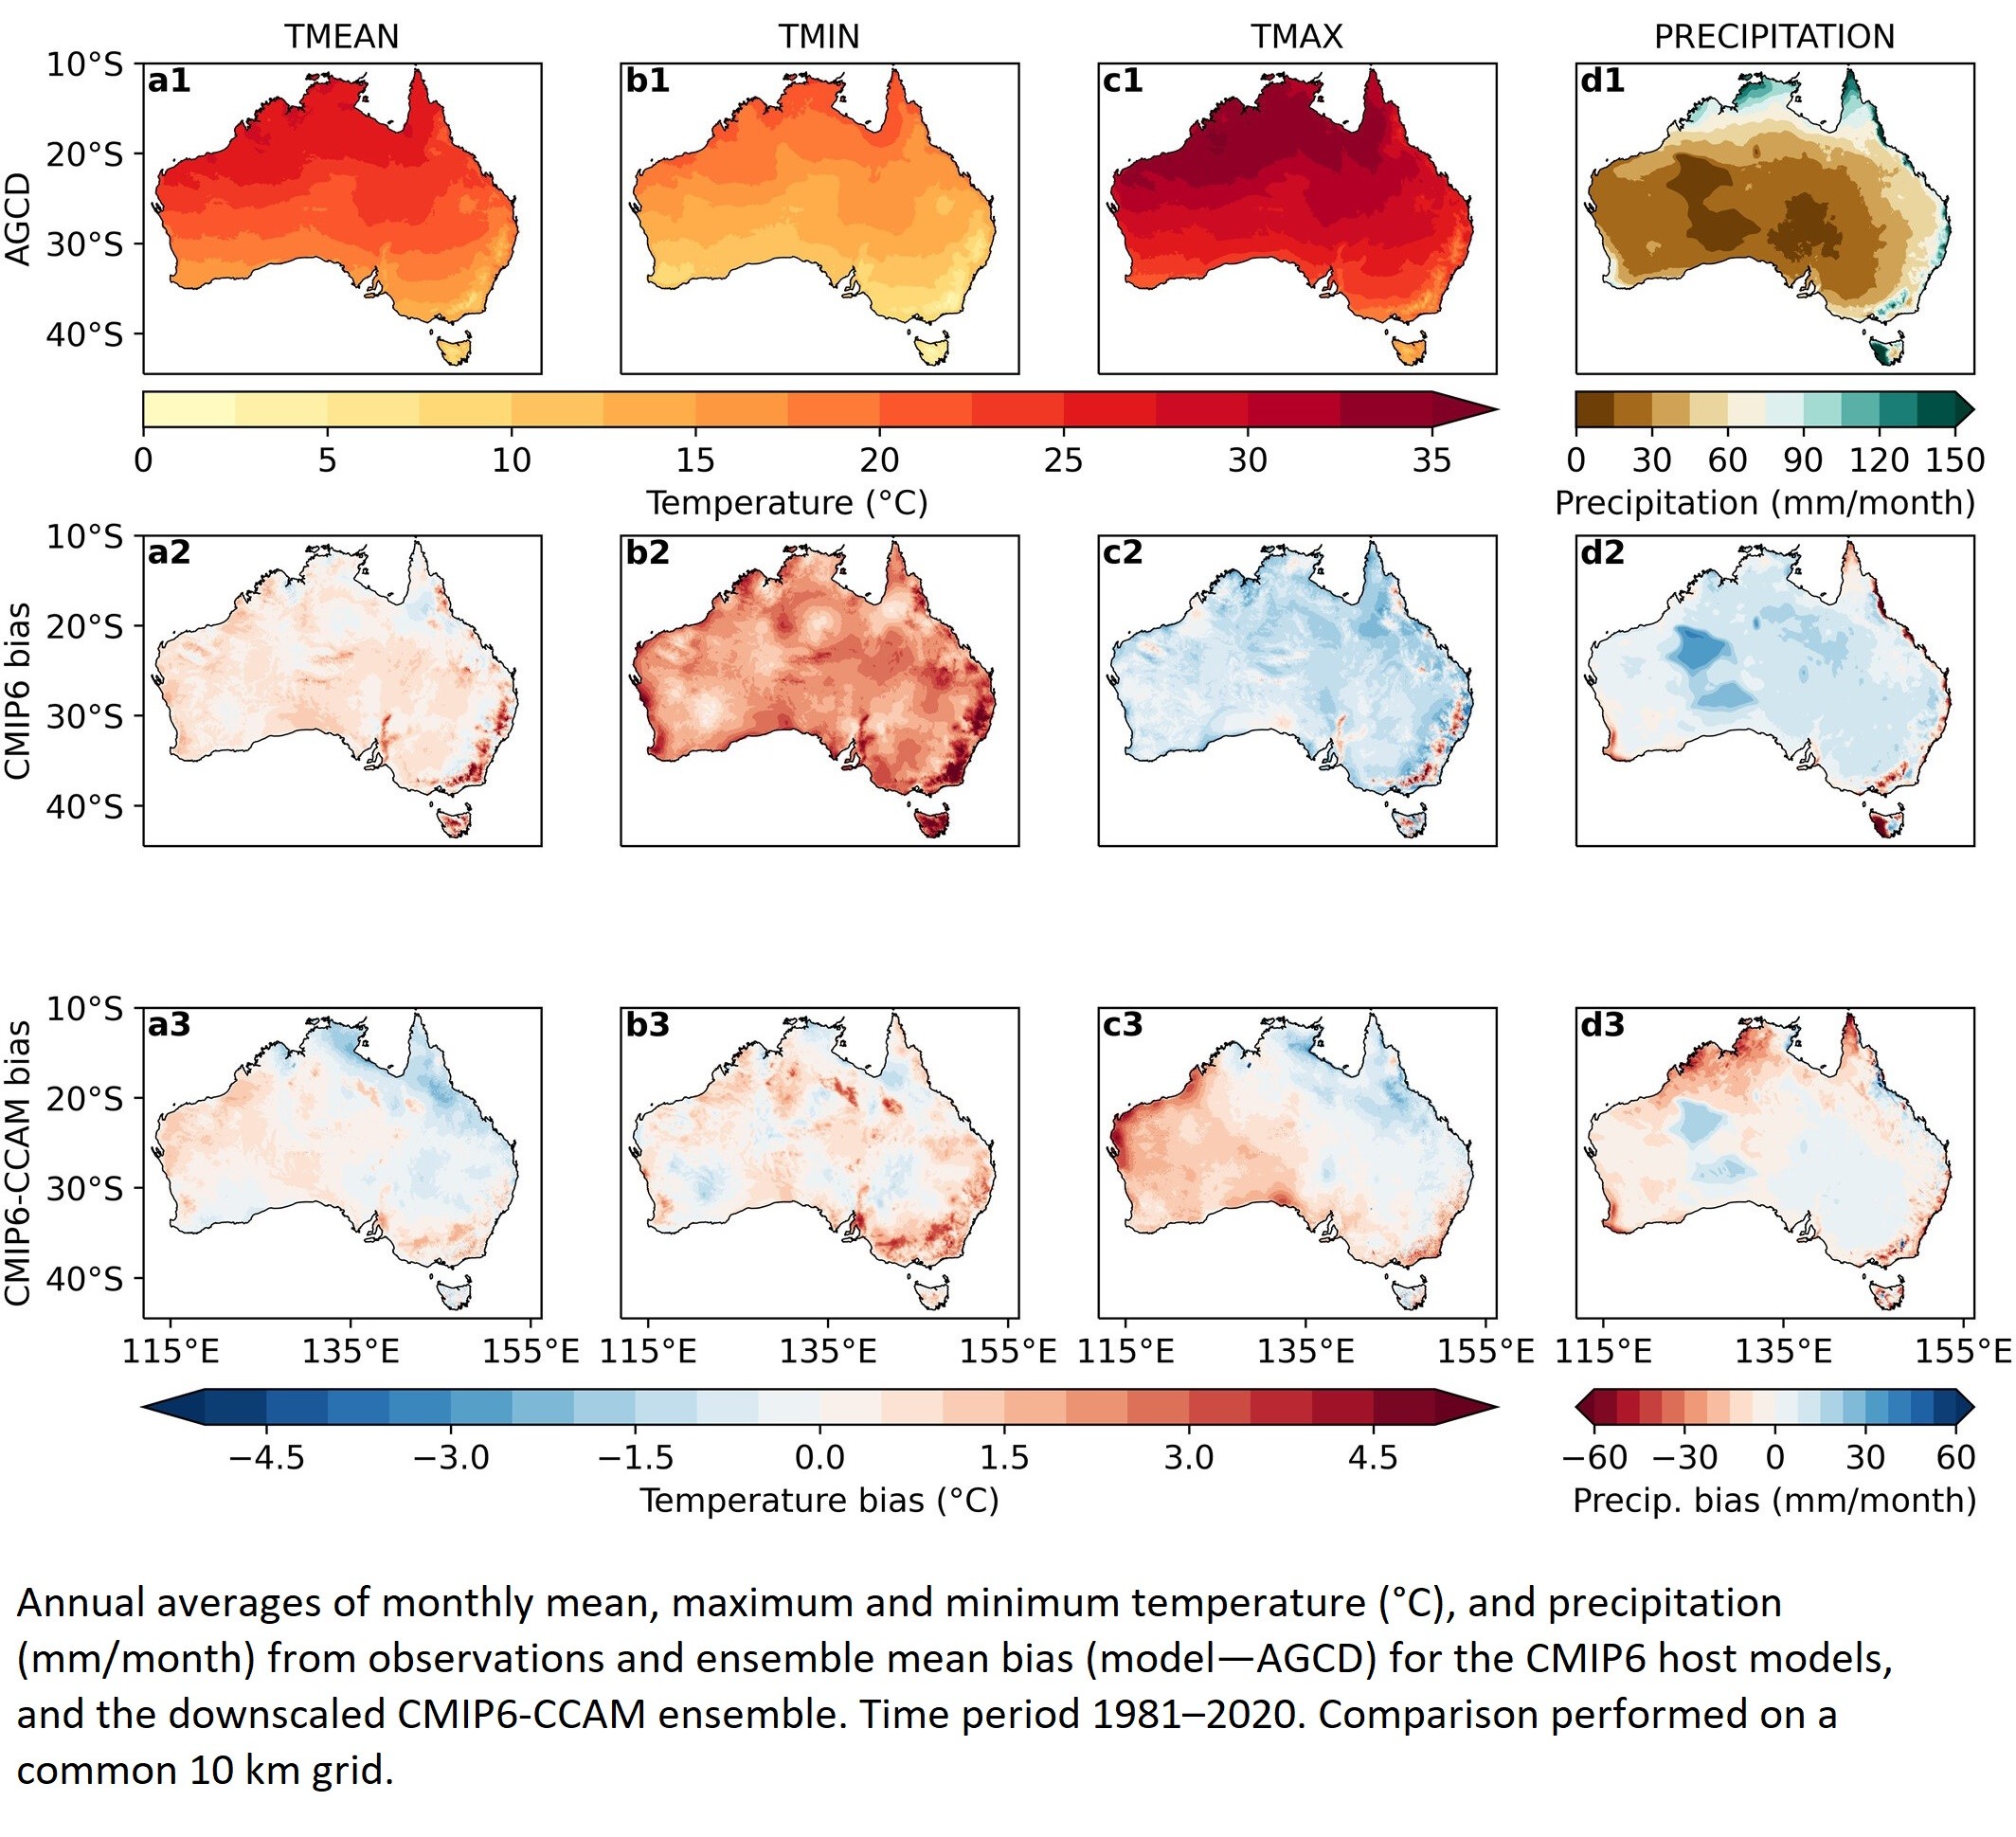
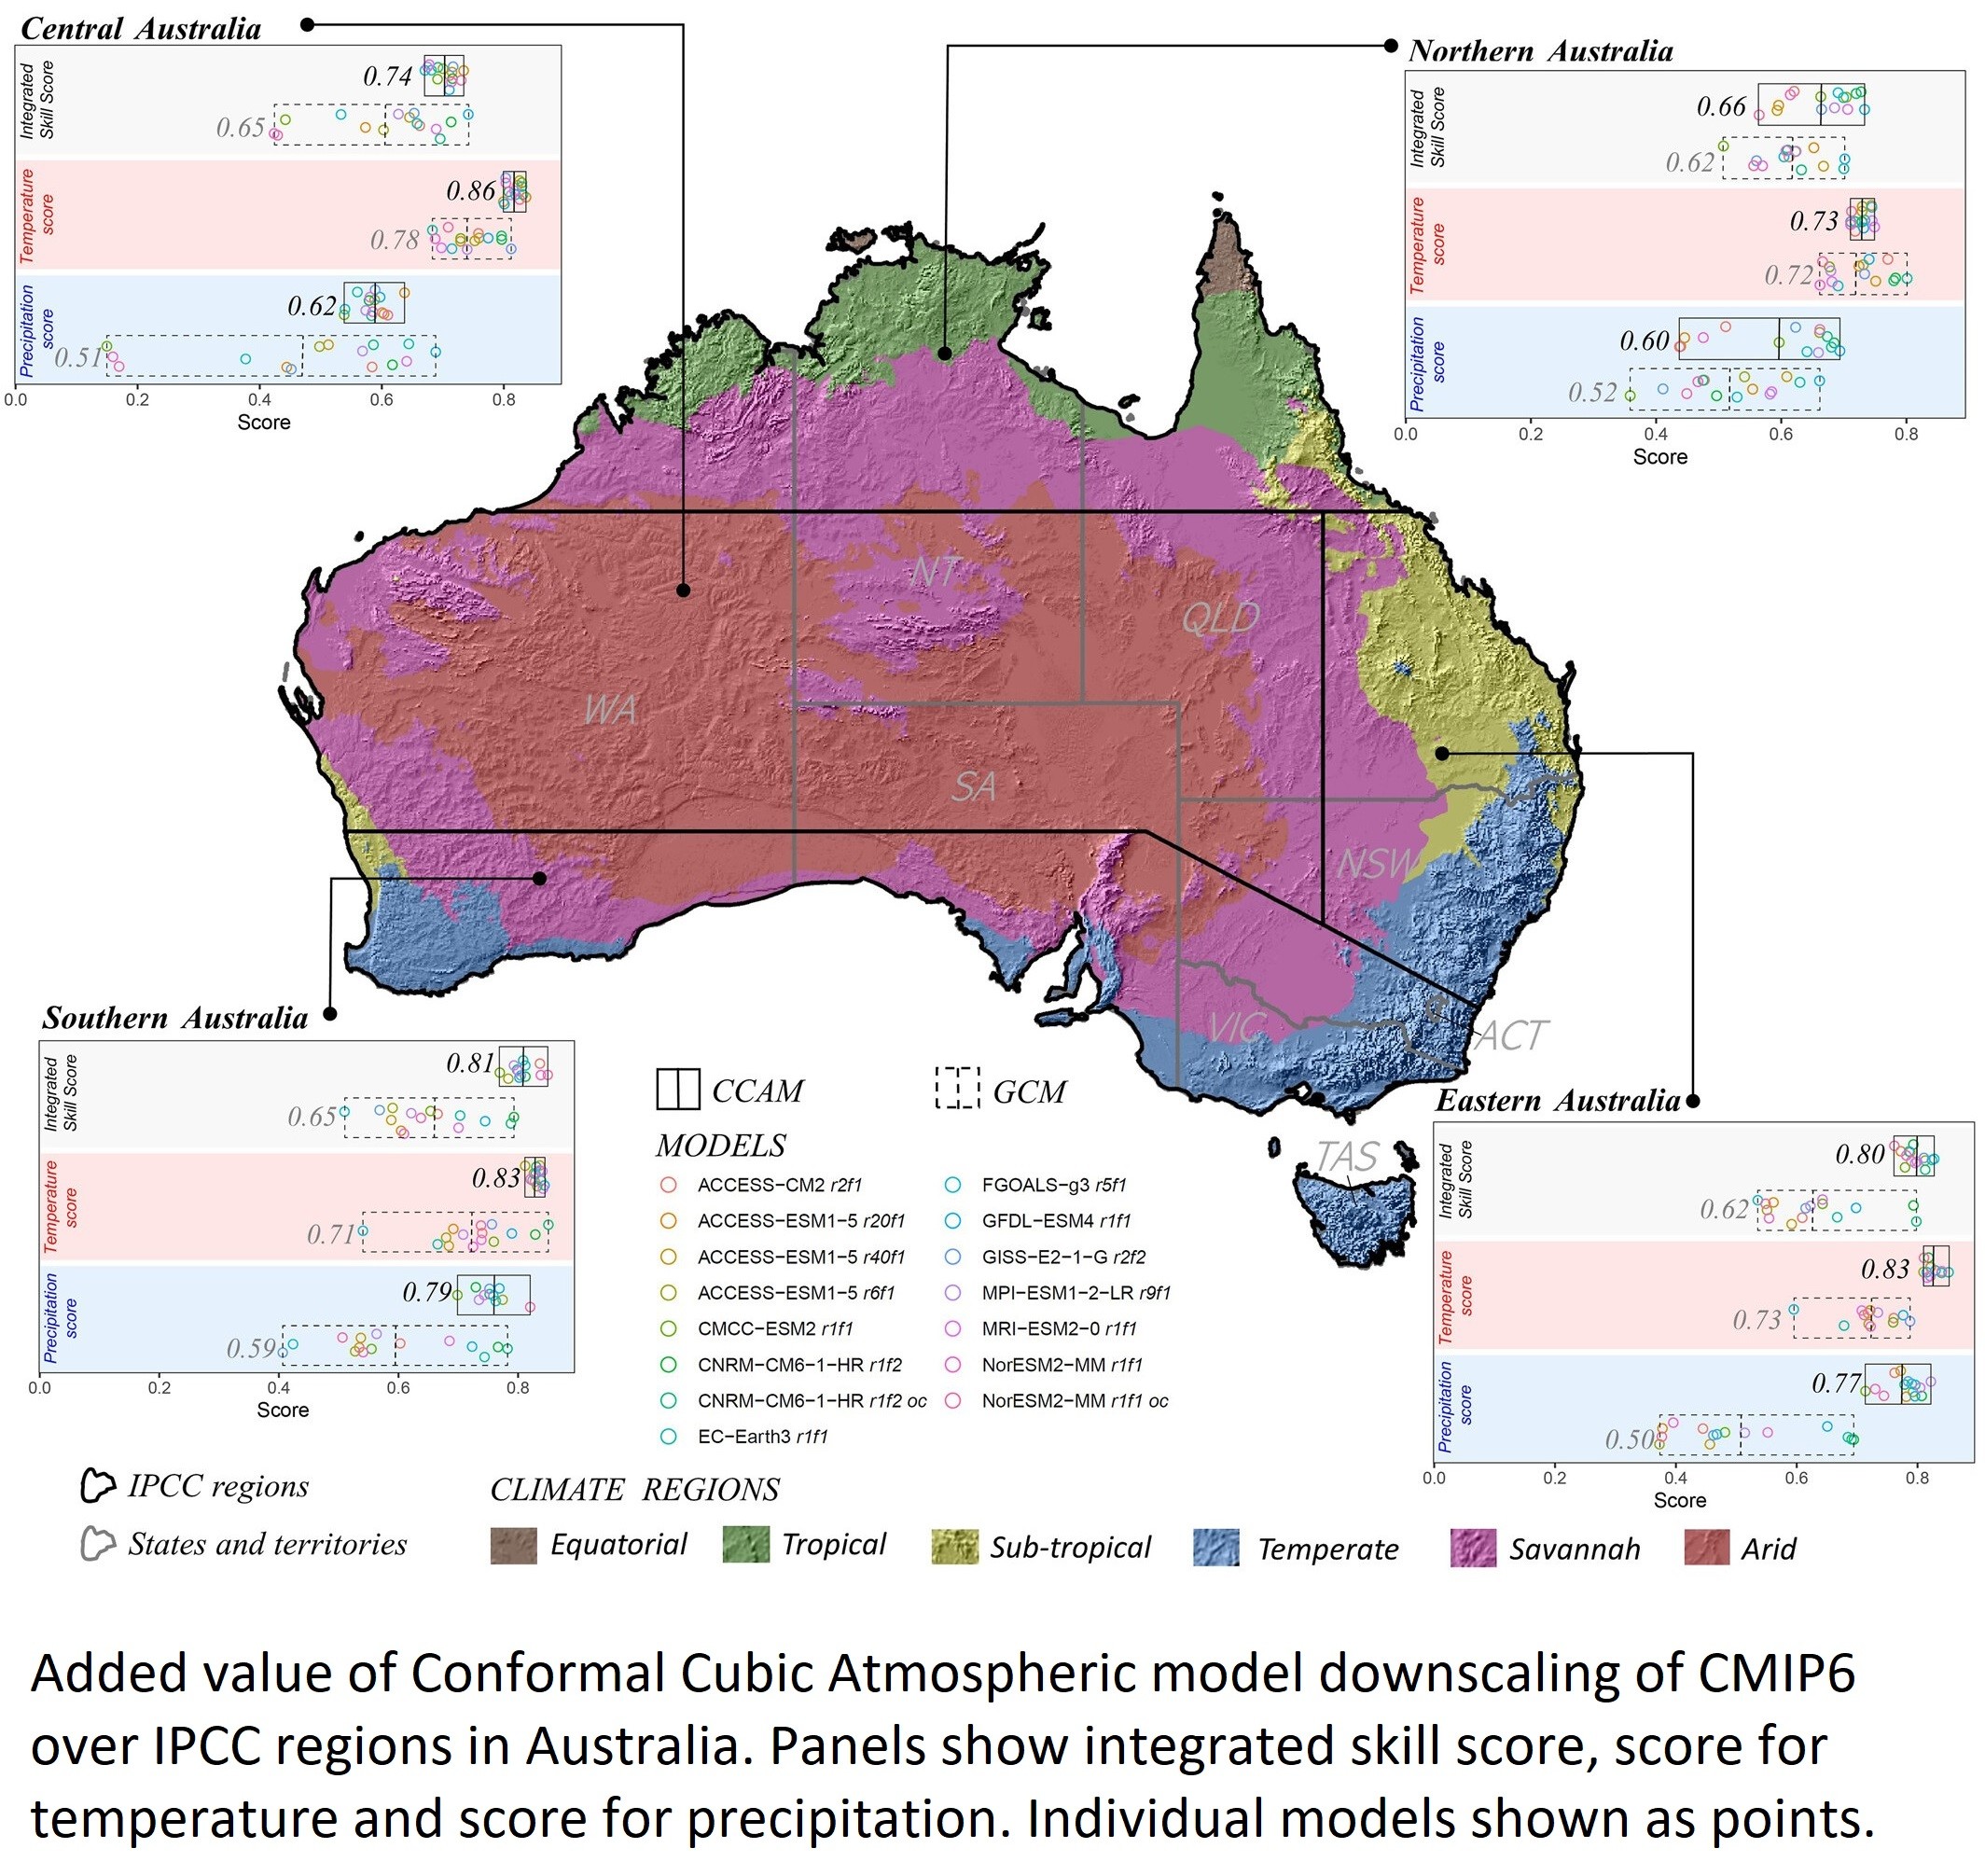
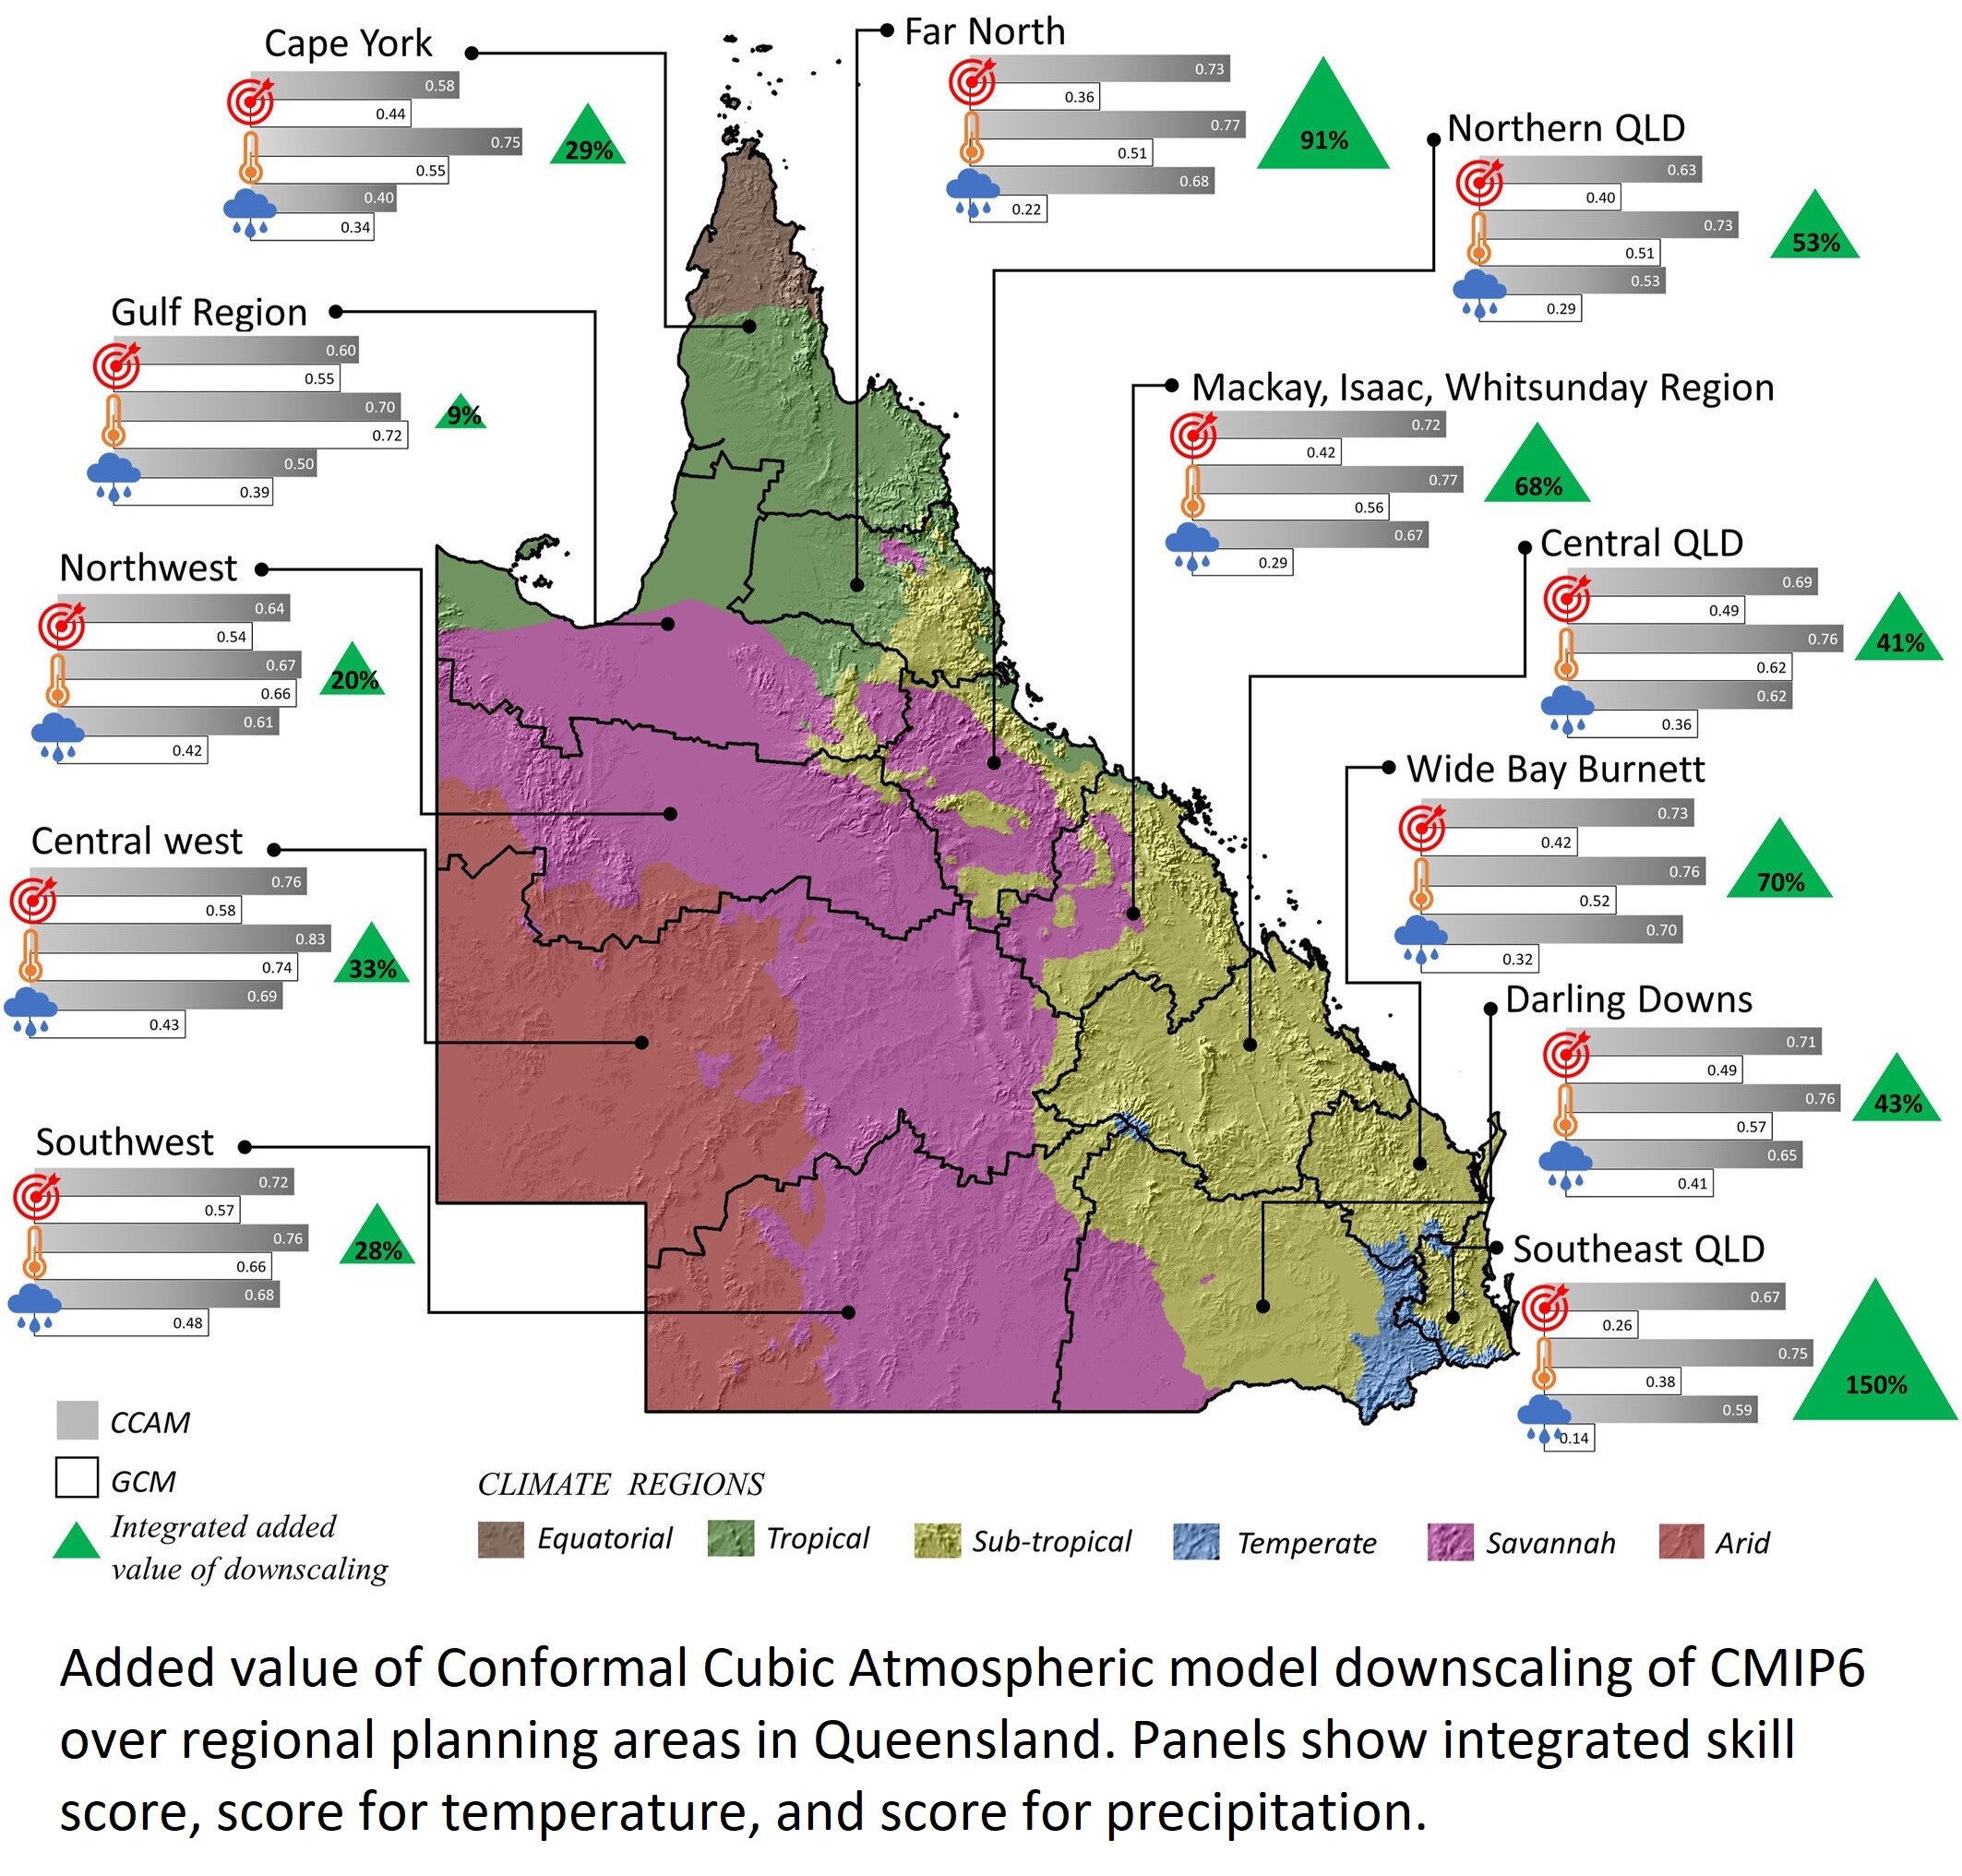
[The] New High-Resolution Climate Models Are A Breakthrough In Understanding Australia's Future
--
https://theconversation.com/our-new-high-resolution-climate-models-are-a-breakthrough-in-understanding-australias-future-216739 <-- shared technical article
--
https://doi.org/10.1029/2023EF003548 <-- shared paper
--
“KEY POINTS
• [They] dynamically downscaled 15 CMIP6 global climate model simulations over Australia to a 10 km spatial resolution using the Conformal Cubic Atmospheric model
• Two new assessment metrics are proposed to assess model performance and added value of downscaling
• The integrated added value of downscaling can be as high as 150% over highly populated areas..."
#GIS #spatial #mapping #modeling #Australia #climatechange #extremeweather #wildfires #flooding #floods #coast #coastal #stormdamage #risk #hazard #heatwaves #bushfires #precipitation #heat #temperature #humanimpacts #climatemodel #CMIP6 #CCAM #globalclimatemodel #GCM #climatecrisis #climateadaptation #climaterisk #climatescience #spatialanalysis #spatiotemporal
Client Info
Server: https://mastodon.social
Version: 2025.04
Repository: https://github.com/cyevgeniy/lmst