#DataForGood

2025-07-03

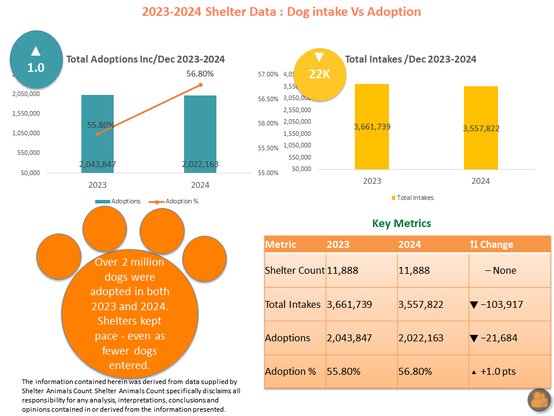
🐾 Over 2 million dogs were adopted in both 2023 and 2024.
Even with fewer entering shelters, shelters kept up the effort.

July 4 is tough on pets.

Fireworks cause stress, escapes, and shelter surges.

❤️ This week:
• Bring pets indoors
• Check tags + microchips

🐶 Thinking of adopting?
Adopt, don’t shop.

Data via Shelter Animals Count
Viz by: bamlytics.com

#AdoptDontShop #PetSafety #AnimalWelfare #AnimalShelters #FourthOfJuly #DogsOfMastodon #ShelterDogs #DataForGood #Bamlytics

Data visualization showing U.S. dog shelter statistics for 2023 and 2024 using data from Shelter Animals Count. Two bar charts compare adoption totals and intake counts year-over-year, along with a table of key metrics.

Left Chart:
Bar chart shows total adoptions in 2023 and 2024.

    2023: 2,043,847 adoptions

    2024: 2,022,163 adoptions
    An orange line overlays the chart showing adoption rates:

    2023: 55.8%

    2024: 56.8%

Right Chart:
Bar chart shows total shelter intakes:

    2023: 3,661,739

    2024: 3,557,822
    A label notes the drop of over 100,000 in total intakes.

Key Metrics Table:
Shows total intakes, adoptions, and percent change from 2023 to 2024. Shelter counts remained unchanged at 11,888. Despite a drop in total animals entering shelters, the adoption rate increased slightly.

A large orange paw print graphic sits in the background with text encouraging adoption and pet safety.

Visual was created by Bamlytics.com for July 4th awareness around shelter surges and pet safety.
Browsejobsbrowsejobs5
2025-07-03

Think data science is just for techies? Think again. Farmers use it to boost crop yields, doctors to detect cancer earlier, and activists to fight climate change. It’s the secret engine behind smarter decisions in every field. In 2025, data is no longer optional—it’s essential.

PromptCloudpromptcloud
2025-06-17

Most companies collect data.
The smartest ones collect insights.

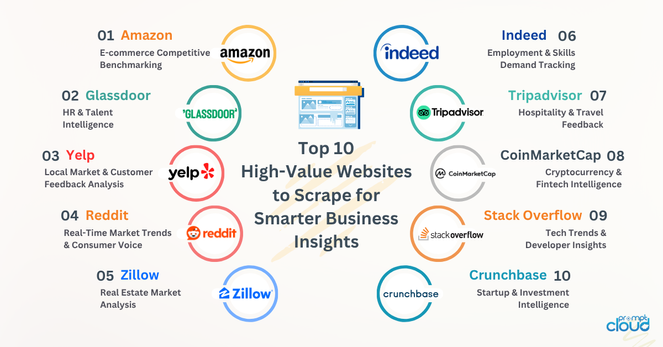
We put together a visual guide to the top 10 websites worth scraping for real-time, high-value business signals.

📖 Read the full blog here: shorturl.at/x3bkp

IA : le progrès version Mad Max avec Lou Welgryn

L’intelligence artificielle se vend comme LA solution prête à libérer l’humanité de tous ses maux. Mais derrière ce vernis techno-béat, une réalité un peu moins sexy s’impose : celle d’une machine énergivore, assoiffée et gourmande en métaux rares. Faut-il vraiment détruire la planète pour quelques starters packs ? Et peut-on laisser le futur de l’IA à des weirdos au bras tendu ?

Lou Welgryn est secrétaire générale de Data for Good, communauté de plus de 7000 experts de la tech bénévoles qui donnent de leur temps pour construire des projets d’intérêt généraux pour la justice sociale et environnementale, tout en ayant un regard très critique sur l’hégémonie technologique en cours.

Climax, le nouveau rendez-vous mensuel d’Au Poste autour de l’urgence climatique, présenté par Lauren Boudard, de Climax, le média plus chaud que le climat

📢 Seul média indépendant 100% LIVE et LIBRE | Parce que nous croyons en la rencontre. Plutôt qu'au formatage. Libertés publiques, politique, cinéma, Histoire, littérature & contre-filatures. auposte.fr invite chercheur·es, écrivain·es, philosophes, sociologues, avocat·es, punks et punkettes, cinéastes, artistes et hacktivistes, écoterroristes, féministes.

Le site a été lancé par l’écrivain-réalisateur David Dufresne (Un pays qui se tient sage) comme un espace d’analyse et de défense des libertés fondamentales. auposte.fr porte un regard critique et en mouvement sur le monde.
Beta.NYC :verified:BetaNYC@urbanists.social
2025-05-22

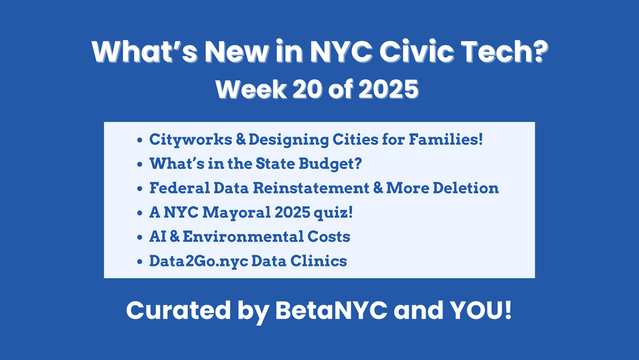
🚨 ICYMI: Our latest newsletter is packed! Edition 2025.20 covers NYSCI’s Cityworks, how we design better cities for families, state and federal data news, the costs of AI, and BetaNYC’s latest Data2Go clinics.

Get the details: beta.nyc/2025/05/15/whats-new-

#DigitalEquity #DataForGood #TechPolicy #FutureOfCities

NYC Civic Tech updates for Week 20, 2025: exploring family-focused design, NY state budget priorities, federal data policy changes, AI’s climate cost, a mayoral 2025 quiz, and Data2Go.nyc data clinics. Curated by BetaNYC and YOU—an inclusive roundup of the latest in civic innovation.
Antoine Blanchardenroweb@qoto.org
2025-04-25

Le Démo Day Saison 13 de Data For Good fait une halte à Bordeaux le 5 mai ! eventbrite.fr/e/demo-day-saiso #dataforgood

2025-04-24

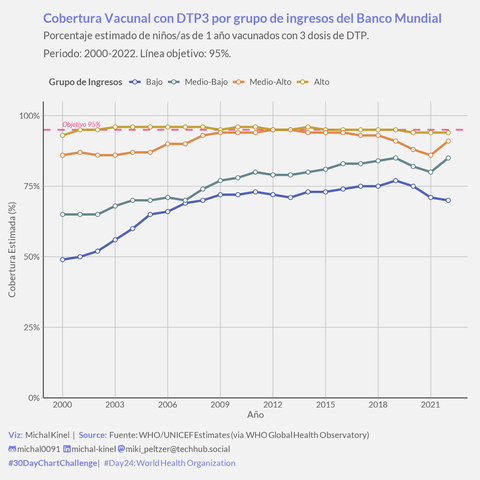
#30DayChartChallenge Día 24: ¡Usando datos de la @WHO! 🌐 Hoy comparamos la cobertura de vacunación DTP3 (% niños 1 año) entre países agrupados por nivel de ingresos (Banco Mundial, 2000-2022). #TimeseriesWeek #SocialData #GlobalHealth

El gráfico muestra:
✅ ¡Gran mejora en todos los grupos hasta ~2019!
⚠️ ¡Pero una brecha enorme persiste! Los países de ingresos altos (amarillo 🟡) cerca del objetivo 95% (línea rosa).
📉 Los países de ingresos bajos (azul índigo 🔵), aunque mejoraron mucho desde el 2000, se quedaron sobre el 70% y sufrieron un retroceso post-pandemia.

Un reflejo claro de la #EquidadEnSalud (o la falta de ella) a nivel global. ¡El acceso a vacunas básicas no es igual para todos!

🛠 #rstats #ggplot2 #data_table | Data: WHO GHO | Theme: #theme_week4_social
📂 Código/Viz: t.ly/fRi1m

#Day24 #WHO #dataviz #DataVisualization #Vaccination #Immunization #HealthEquity #PublicHealth #SDGs #ggplot2 #RStats #DataForGood

Gráfico de líneas que muestra las tendencias de la cobertura estimada de vacunación DTP3 (%) en niños de 1 año, desde el año 2000 hasta 2022, para cuatro grupos de ingresos de países según el Banco Mundial. El eje Y va de 0% a 100%. El eje X muestra los años. Hay cuatro líneas de colores distintos: 'Alto' (amarillo/oro, cerca del 95%), 'Medio-Alto' (naranja, subiendo a >90%), 'Medio-Bajo' (azul grisáceo, subiendo de ~65% a ~85%), y 'Bajo' (azul índigo, subiendo de ~49% a ~70% con un descenso reciente). Una línea horizontal discontinua rosa marca el objetivo del 95%. Fuente: WHO/UNICEF Estimates (via WHO GHO).
Beta.NYC :verified:BetaNYC@urbanists.social
2025-04-23

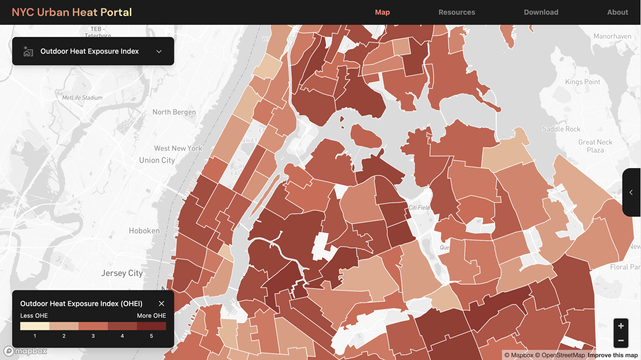
NYC is heating up—literally. The new NYC Urban Heat Portal is here to help communities, planners, and advocates tackle extreme heat head-on.​ 🔥 🌡️

Access detailed layers on outdoor heat exposure index, surface temperature, cool roofs, tree canopy, and more!​ 📊

Dive into the map: urbanheat.nyc/ 🔗

#nycsodata #opendataweek #urbanheat #climateresilience #dataforgood

A grayscale image of the NYC map with its neighborhoods colored with multi-orange gradient shades to showcase the outdoor heat exposure index.
Jesus Castagnetto 🇵🇪jmcastagnetto
2025-04-15

about the & Impacts Early-Warning System (VIEWS) project, that does of possible and its toll.

Details in: viewsforecasting.org/

That project is sharing their datasets via (): data.humdata.org/organization/

Rod2ik 🇪🇺 🇨🇵 🇪🇸 🇺🇦 🇨🇦 🇩🇰 🇬🇱rod2ik
2025-04-11
Rod2ik 🇪🇺 🇨🇵 🇪🇸 🇺🇦 🇨🇦 🇩🇰 🇬🇱rod2ik
2025-04-11
Rod2ik 🇪🇺 🇨🇵 🇪🇸 🇺🇦 🇨🇦 🇩🇰 🇬🇱rod2ik.bsky.social@bsky.brid.gy
2025-04-11

Les 3 #ONG #QuotaClimat, #DataForGood et #ScienceFeedback,dévoilent une note qui démontre une hausse de la #désinformation sur le #dérèglement #climatique dans l’ #audiovisuel #français. Depuis trois mois, 128 cas ont été recensés, « une dizaine de cas par semaine » www.humanite.fr/environnemen...

La télévision et la radio fran...

2025-03-28

A l'occasion de la sortie de la publication scientifique de LinkR, nous revenons sur les avancées de LinkR, un an après la saison d'accélération de #DataForGood.

➡️ linkr.interhop.org/news/2025/d

2025-03-23

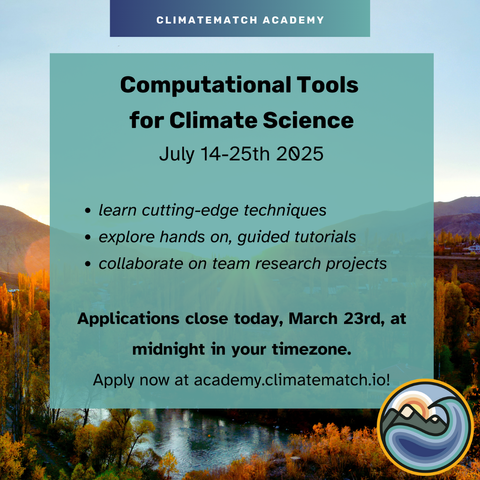
⏳🚨 Last chance to apply! 🚨⏳

Applications for our 2-week Computational Tools for Climate Science course close TODAY at midnight in your timezone! Don’t miss your chance to dive into climate data analysis, modeling, and computational techniques from experts. Make a real-world impact in the fight against climate change!

📝 Apply now: neuromatch.io/computational-to

#ClimateAction #DataForGood #ClimateScience #ComputationalTools #ClimateChange #VirtualCourse

Infographic saying applications for our course are due today at midnight in your timezone.
2025-03-22

Mastodon:
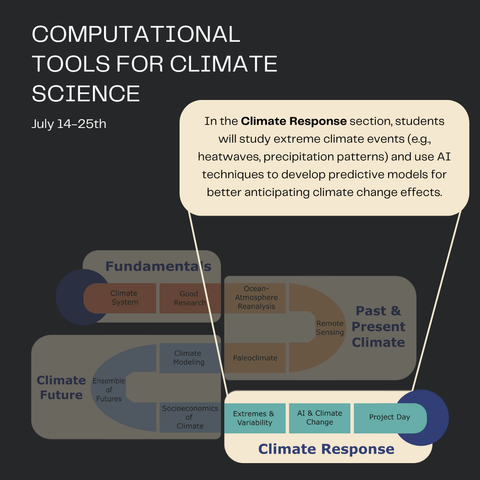
🌍🔬In the "Climate Response" section of our 2-week Computational Tools for Climate Science course, students will explore extreme events and AI techniques for climate science.

🗓 Dates: July 14-25, 2025
📝 Apply by: March 23, 2025
👉 Apply: neuromatch.io/computational-to

#ClimateAction #DataForGood #ClimateScience #ComputationalTools #ClimateChange #VirtualCourse

Overview of the climate response section of our course.
2025-03-21

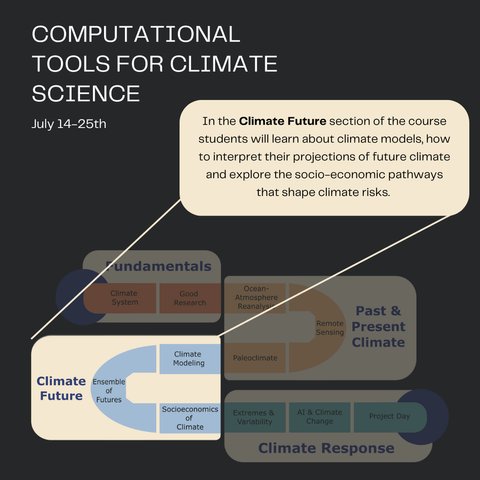
🌍🔬In the "Climate Future" section of our 2-week Computational Tools for Climate Science course, students will explore climate models and the socioeconomics of climate change.

🗓 Dates: July 14-25, 2025
📝 Apply by: March 23, 2025
👉 Apply: neuromatch.io/computational-to

#ClimateAction #DataForGood #ClimateScience #ComputationalTools #ClimateChange #VirtualCourse

Overview of the future climate section of our course.
2025-03-20

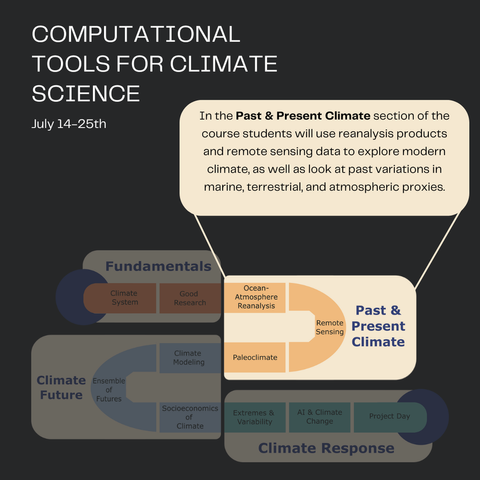
🌍🔬In the "Past and Present Climate" section of our 2-week Computational Tools for Climate Science course, students will explore reanalysis and paleo proxies to understand historical climate patterns.

🗓 Dates: July 14-25, 2025
📝 Apply by: March 23, 2025
👉 Apply: neuromatch.io/computational-to

#ClimateAction #DataForGood #ClimateScience #ComputationalTools #ClimateChange #VirtualCourse

Overview of the past and present climate section of our course.
2025-03-19

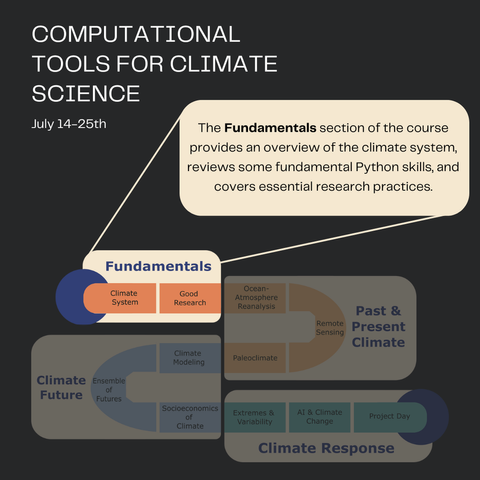
🌍🔬 In the first days of our 2-week Computational Tools for Climate Science course, explore climate science basics to build the skills to make a real-world impact! 🌿

🗓 Dates: July 14-25, 2025
📝 Apply by: March 23, 2025
👉 Apply: neuromatch.io/computational-to

#ClimateAction #DataForGood #ClimateScience #ComputationalTools #ClimateChange #VirtualCourse

Overview of the fundamentals section of our course.
2025-03-18

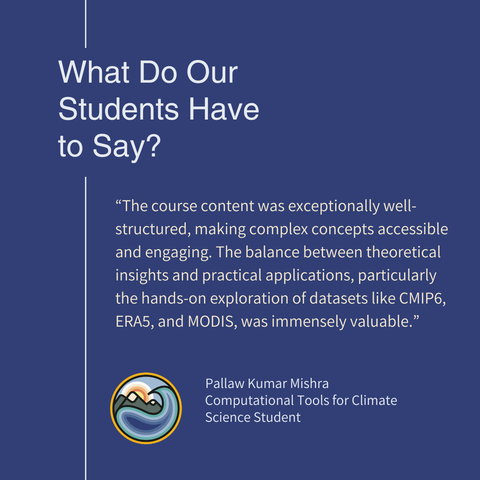
🌍💬 Hear from Our Students! 💬🌍

Our Computational Tools for Climate Science course is making a real impact! Check out this testimonial from one of our recent students.

Ready to level up your skills and make a real-world impact? Apply now for our 2-week immersive virtual course! 🌱💻

🗓 Dates: July 14-25, 2025
📝 Apply by: March 23, 2025
👉 Apply Now: neuromatch.io/computational-to

#ClimateAction #DataForGood #ClimateScience #ComputationalTools #ClimateChange #VirtualCourse

A positive testimonial from a student about Computational Tools for Climate Science.
2025-03-16

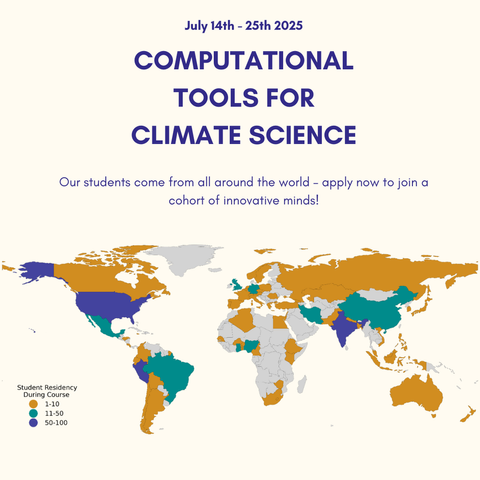
Our program welcomes applicants from numerous countries and diverse backgrounds. Whether you're from North America, Europe, Asia, Africa, or anywhere in between, your unique perspective can help shape the future of climate science. Join our global community and collaborate with like-minded individuals to tackle the world's most pressing challenges!

🗓 Dates: July 14-25, 2025
📝 Apply by: March 23, 2025
👉 Apply: neuromatch.io/computational-to
#ClimateAction #DataForGood #ClimateScience #VirtualCourse

Map showing the rich array of countries our students stem from.

Client Info

Server: https://mastodon.social
Version: 2025.04
Repository: https://github.com/cyevgeniy/lmst