Der neueste Beitrag der ZfdG bedient sich ursprünglich bioinformatischer Verfahren zur #Gattungsforschung: #Dotplots und der #SmithWatermanAlgorithmus werden eingesetzt, um die Überlieferung der mittelalterlichen Textgattung der #Priamel zu beleuchten: »Dotplots und Alignments als Untersuchungsinstrumente für Überlieferungsgemeinschaften am Beispiel von Priameln« von Frank Buschmann / Aron Fink https://zfdg.de/2023_009
#DotPlots
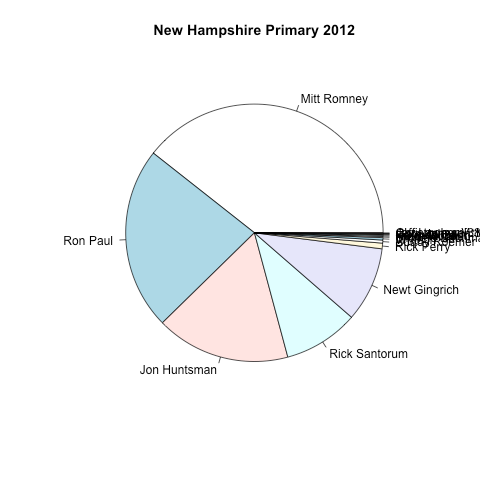
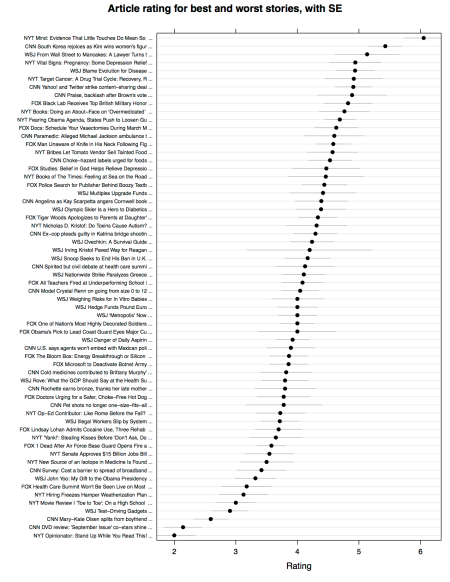
> Cleveland examined how accurately our visual system can process visual elements or “perceptual units” representing underlying data. These elements include markers aligned on the same scale (e.g., #DotPlots, #ScatterPlots, ordinary #BarCharts), the length of lines that are not aligned on the same scale (e.g., stacked bar plots), area (#PieCharts and mosaic plots), angles (also pie charts), shading/color, volume, curvature, and direction...
#WilliamCleveland #RobertMcGill
> The results are resoundingly clear—judgements about position relative to a baseline are dramatically more accurate than judgements about angles, area, or length (with no baseline). Hence.. [#Cleveland] suggests that we replace #PieCharts with #BarCharts or #DotPlots and that we substitute stacked bar charts for grouped bar charts.
#SolomonMessing on #EdwardTufte and #DataVisualization
Client Info
Server: https://mastodon.social
Version: 2025.04
Repository: https://github.com/cyevgeniy/lmst