#SolomonMessing

2025-04-03

"Platforms like Facebook, Instagram, and Twitter are structured around a social graph in which users follow and are followed by other users. In turn, the content we see depends on what’s shared in our network."

#ZeveSanderson, #SolomonMessing,
#JoshuaATucker, 2024

brookings.edu/articles/misunde

Ugghh, no. This was true of all 3 DataFarms when they first started. But all 3 have been inserting posts into people's feeds from outside their social graph for years.

(1/2)
#DataFarms

2025-04-03

"... the release of OpenAI’s ChatGPT launched an international conversation about how generative artificial intelligence—i.e., AI capable of producing text, images, video, and more—could transform our lives."

#ZeveSanderson, #SolomonMessing,
#JoshuaATucker, 2024

brookings.edu/articles/misunde

The lie that this artificial paint-by-numbers involves "intelligence" has been repeated constantly by the industry hype machine. It's worrying when even academics uncritically parrot this lie.

#AI #MOLE

2022-07-10

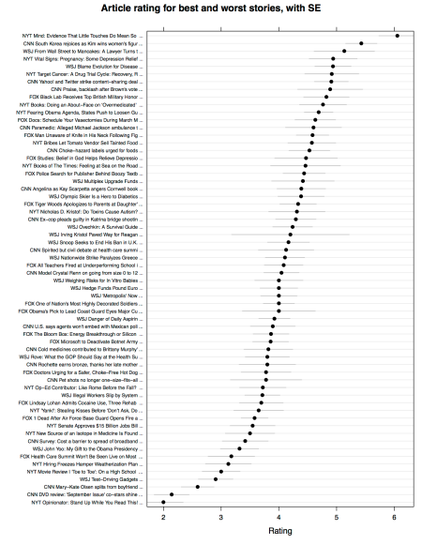
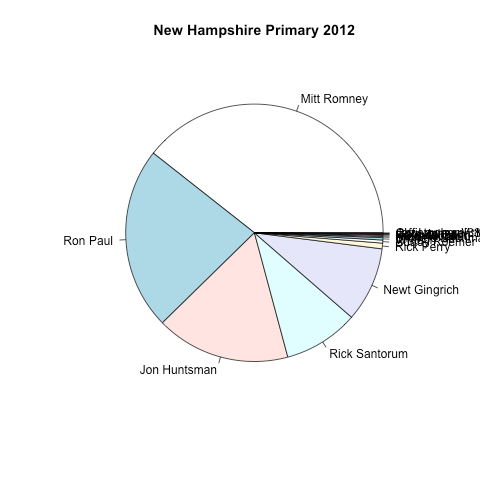
> The results are resoundingly clear—judgements about position relative to a baseline are dramatically more accurate than judgements about angles, area, or length (with no baseline). Hence.. [#Cleveland] suggests that we replace #PieCharts with #BarCharts or #DotPlots and that we substitute stacked bar charts for grouped bar charts.
#SolomonMessing on #EdwardTufte and #DataVisualization

A graphic from the page linked in the above post showing how bad pie charts can be.Another graphic from the pages linked in the post that starts this thread. The graphic shows how ordered dot plots? can present data much better than pie charts can.

Client Info

Server: https://mastodon.social
Version: 2025.04
Repository: https://github.com/cyevgeniy/lmst