Evaluating of simple #additivemanufacturing cost function metrics (build height, footprint area, support volume, overhang area, ... ). The model is rotated and all metrics are computed, next the sphere is "painted" to show the magnitude of that metric for that orientation (sum of the lengths of the black lines as estimate of support material use). This way the sphere provides a nice summary visualisation of which orientations are best e.g. in terms of minimising support material use.
#GeometryProcessing
Just a bunny rotating according to a uniform set of directions on the sphere. The bunny is colored towards the "overhang" angle with respect to the ground. The black area on the ground is the projection of the bunny onto the ground (a bit like a shadow). This is a simple toy simulation that computes some metrics relevant to the simulation of 3D printing preparation.
Whoopsy
(setting the levelset value too low for a Gyroid shell reconstruction leads to a crummy mess)
And, yep it works for the Batman curve too. Always an important test.
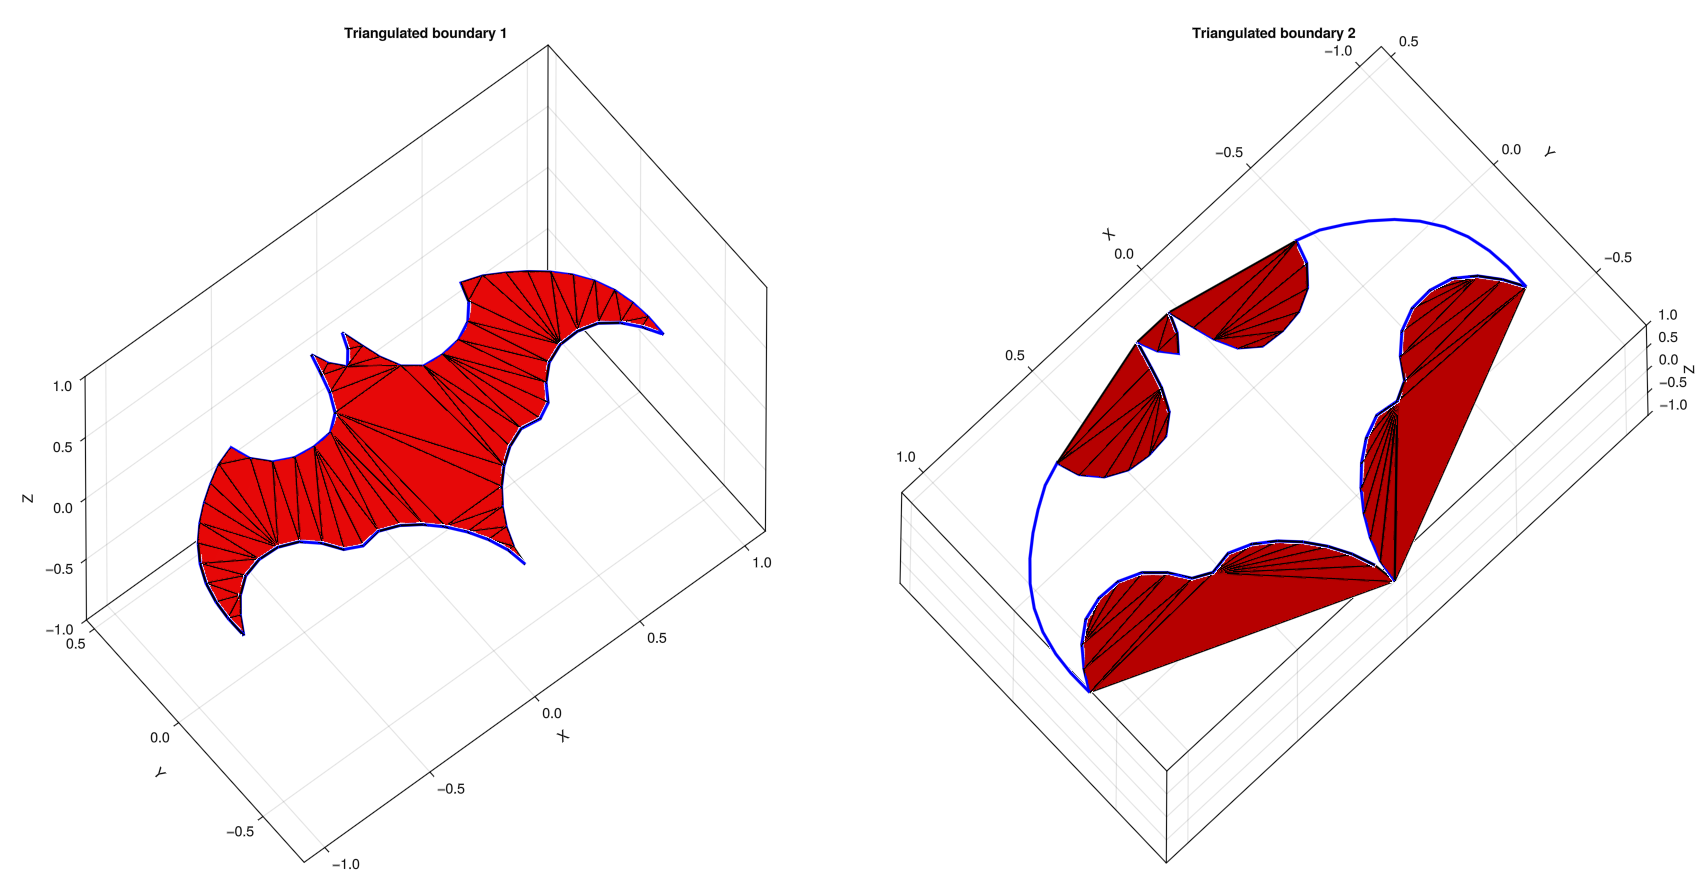
The left image shows interior triangulation and right image shows exterior triangulation. In both cases the algorithm computes angles on the input boundary segments (blue curve) and creates triangles where the angle is smallest and below a threshold. Next the boundary is updated to include the new line segment introduced by the new triangle, and the point "skipped" by adding this triangle is removed from the boundary list. The process continues until there are no more triangles to add. Here I set the threshold to 180 degrees so you get a fully triangulated state.
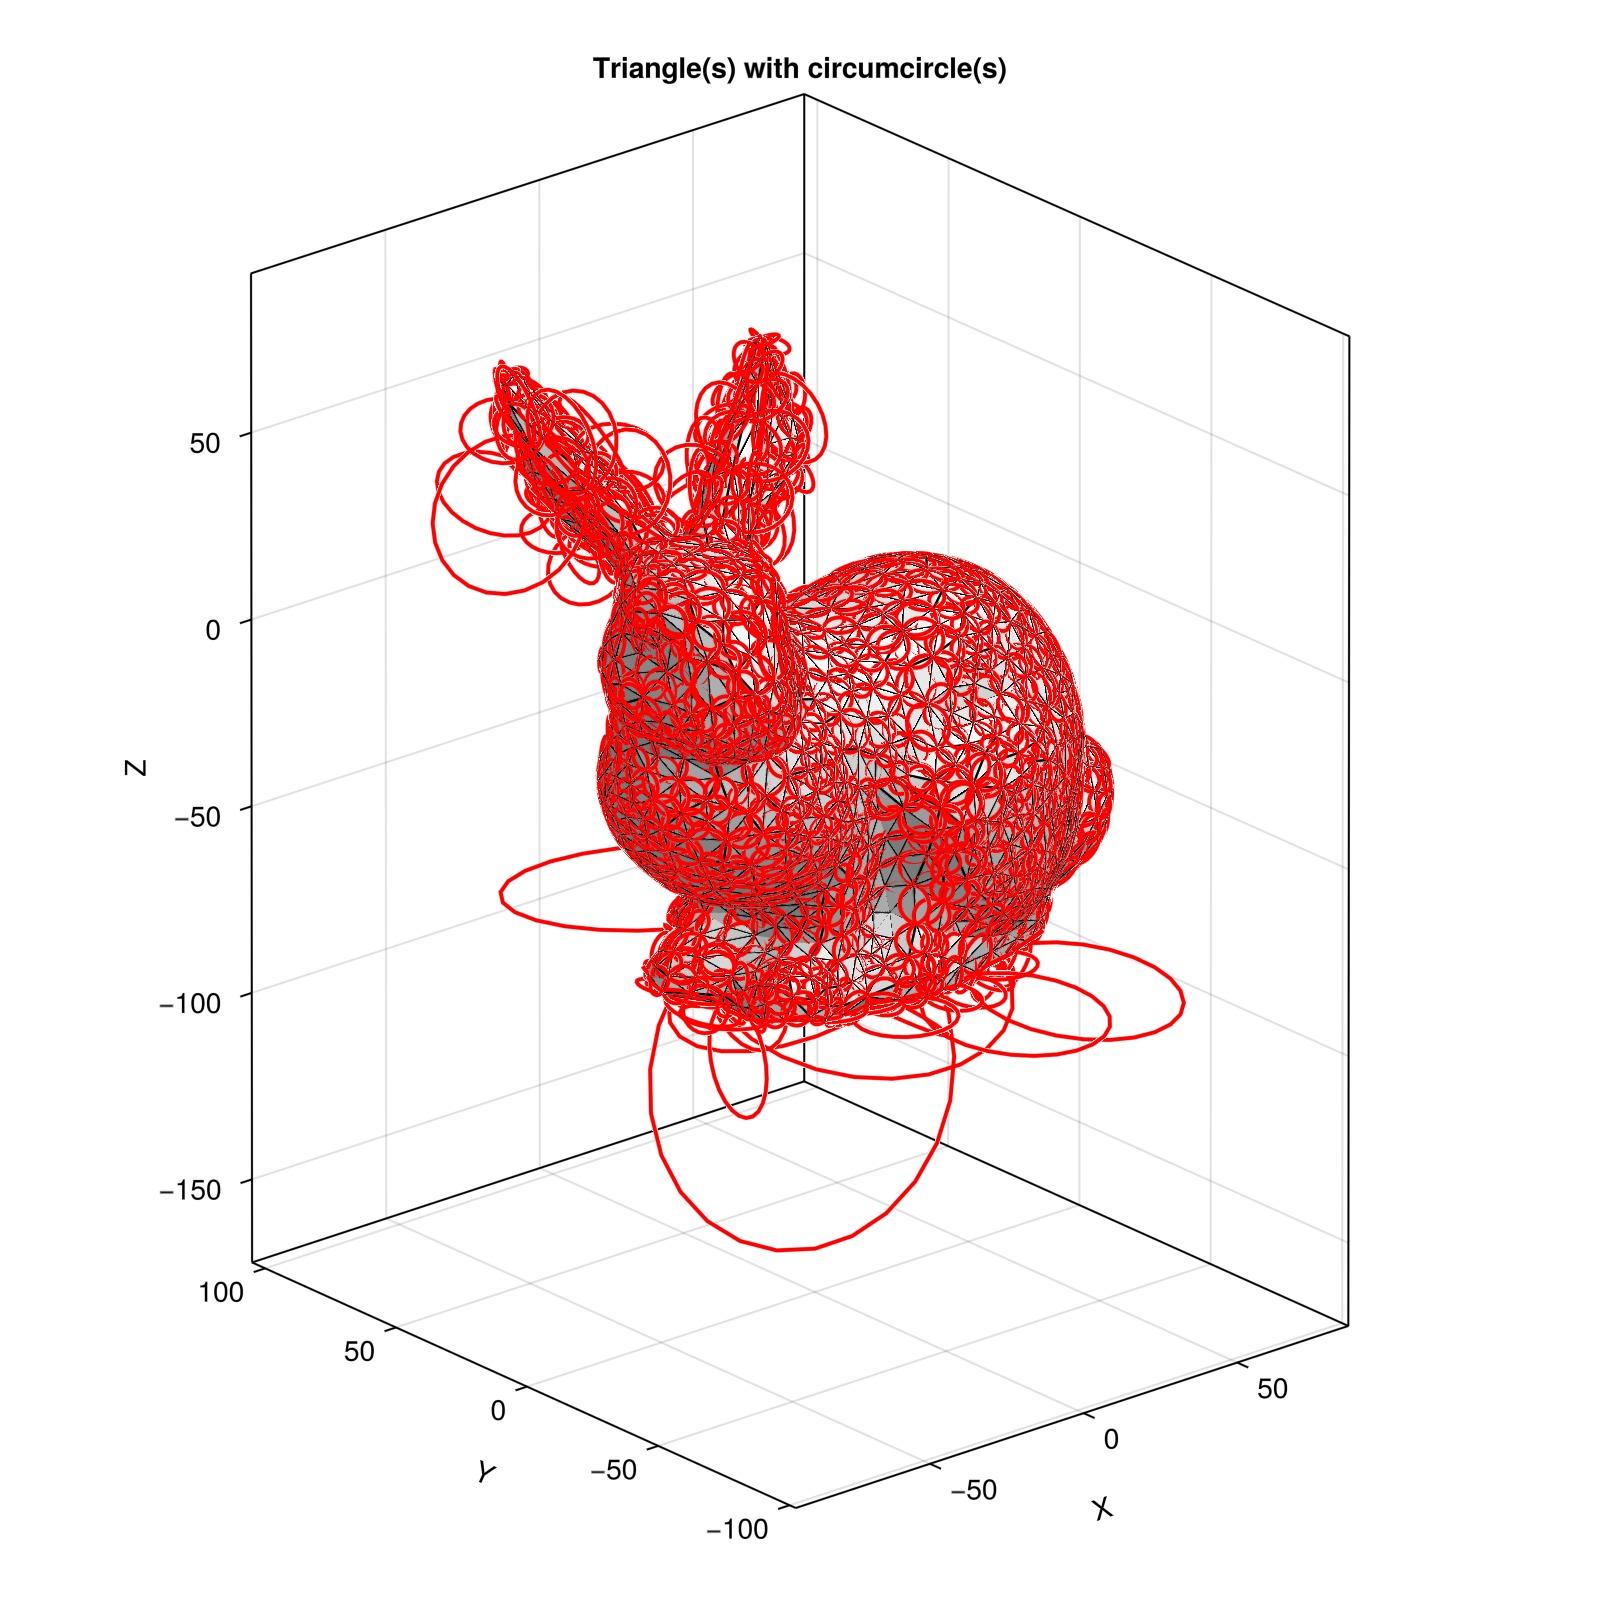
These are so-called "incircles", and they look more well-behaved for our friend the Stanford Bunny.
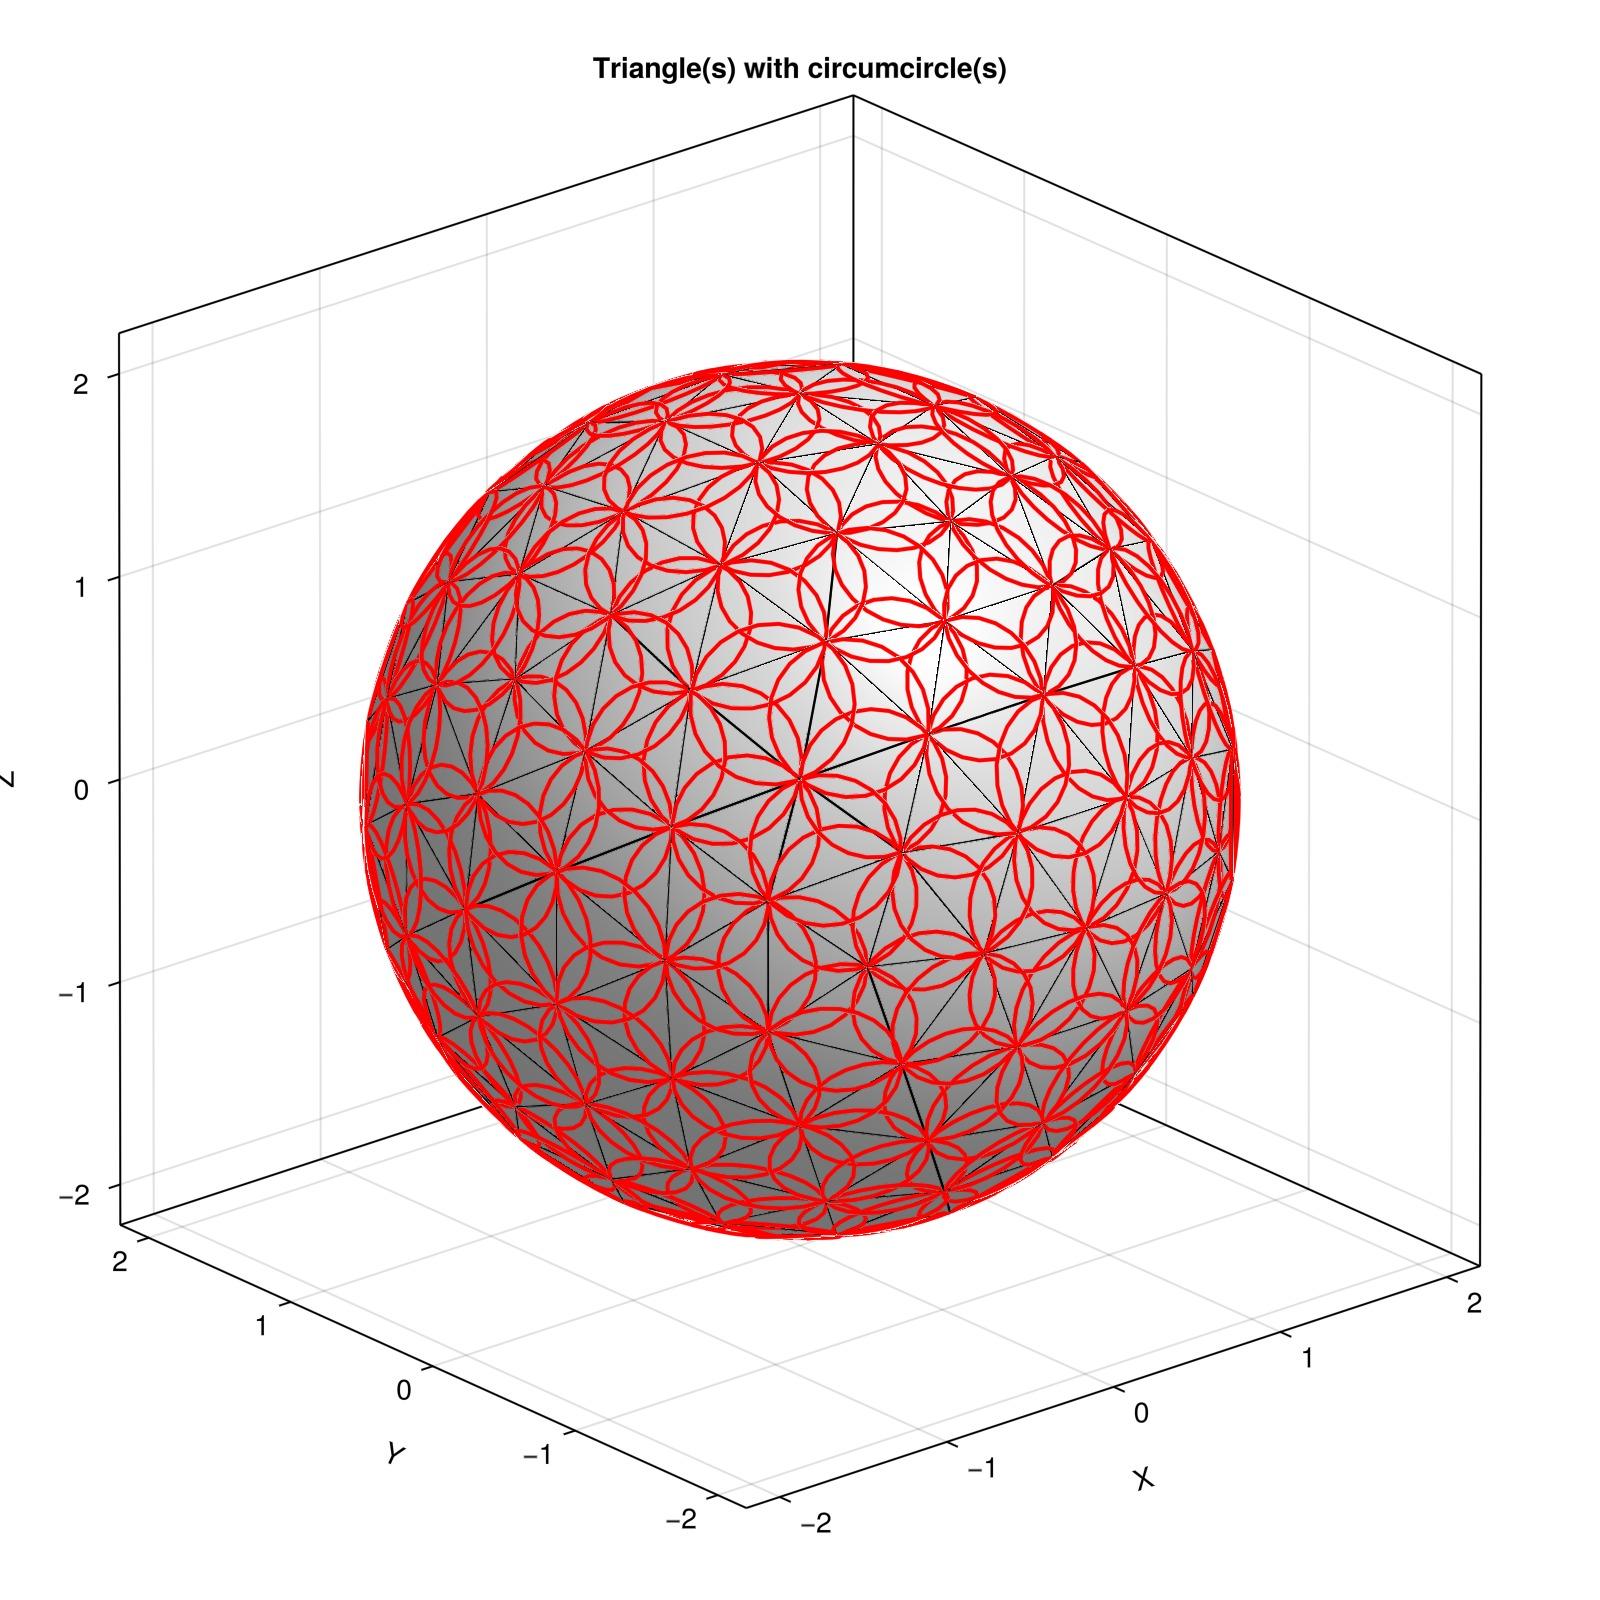
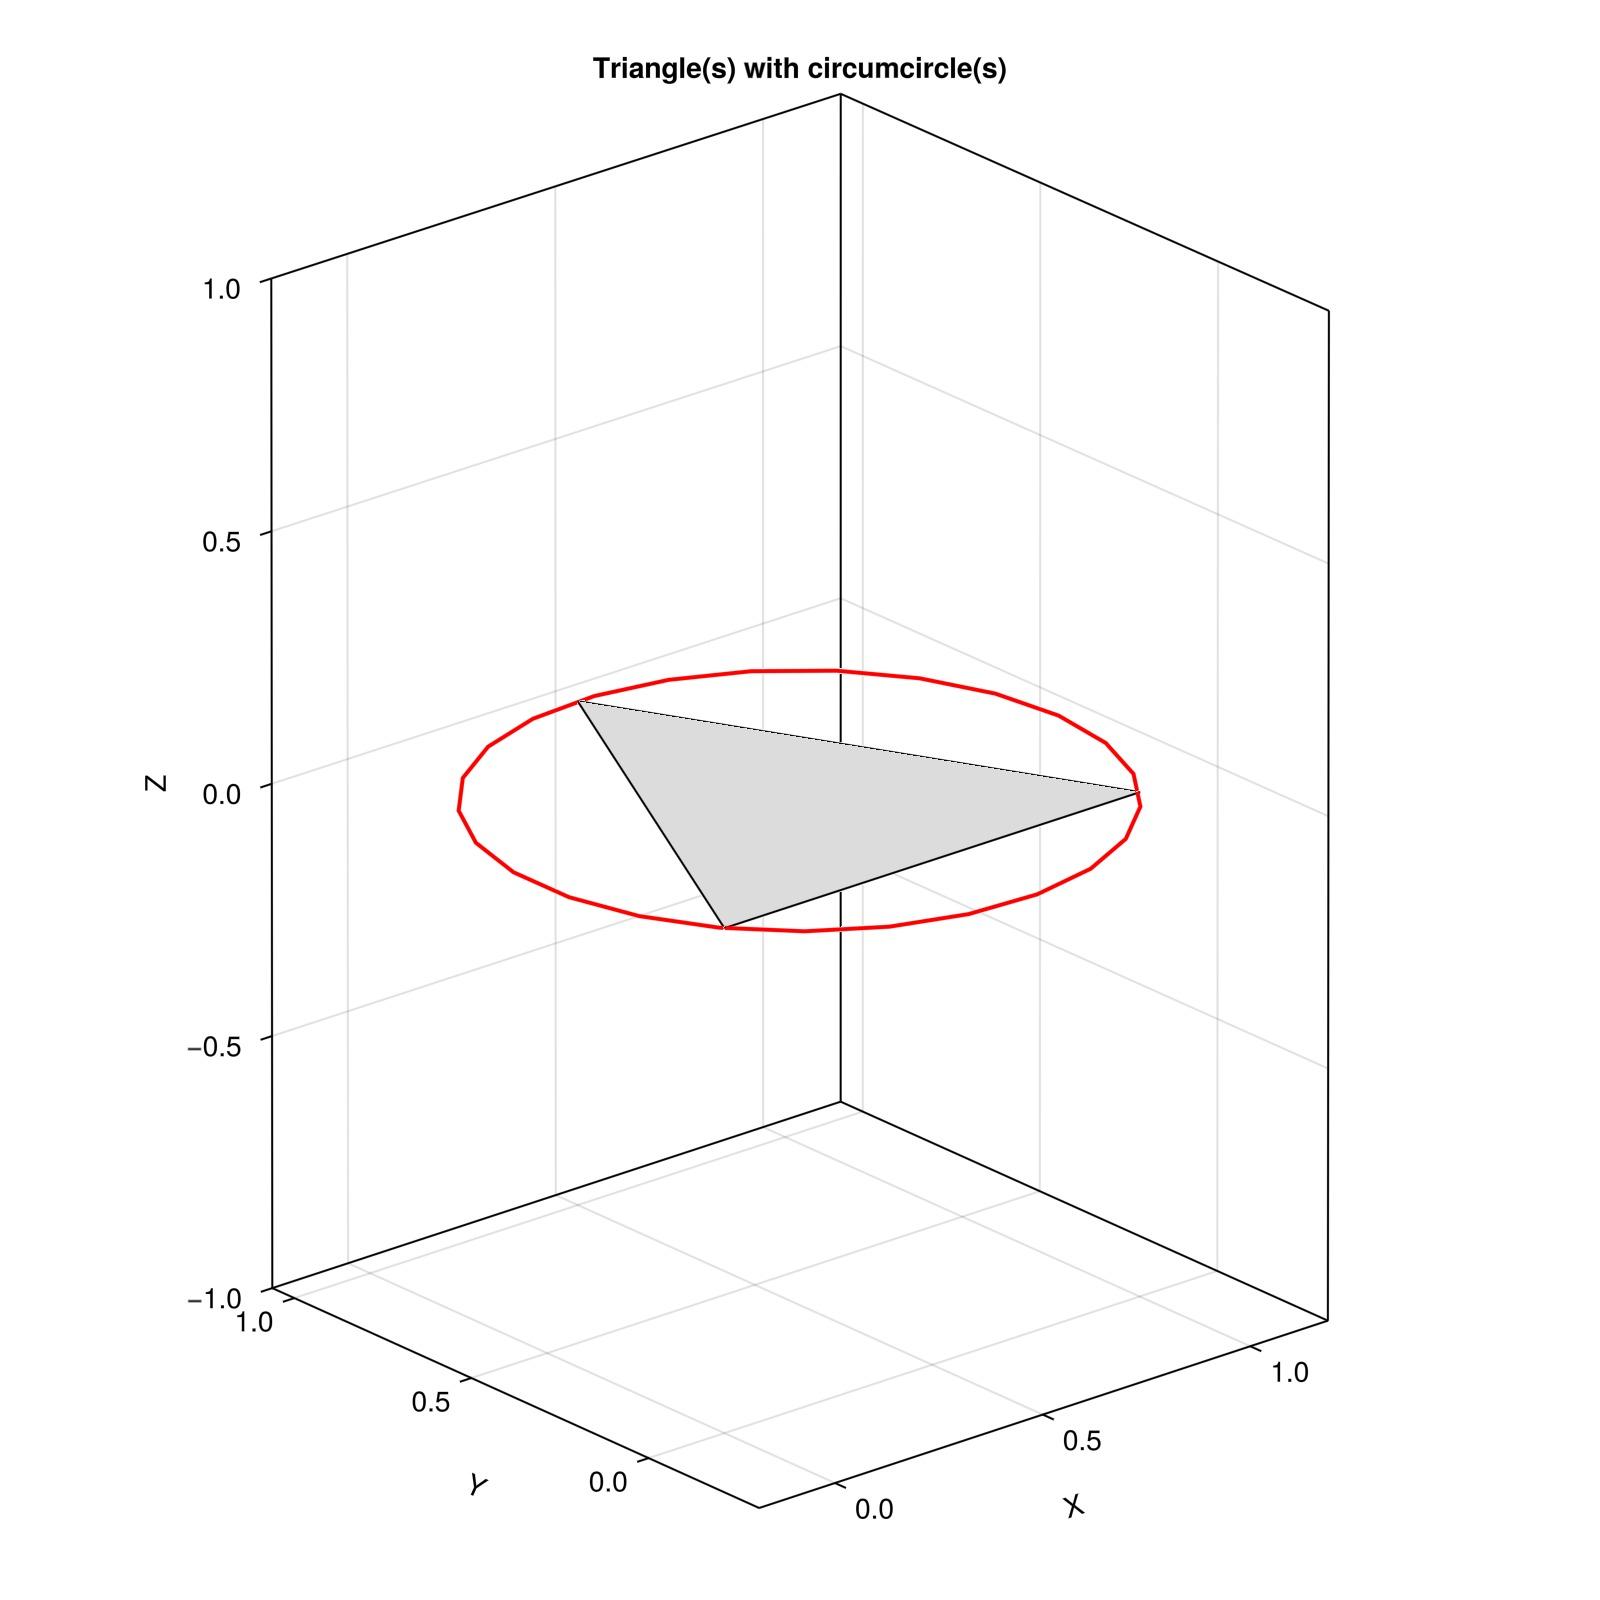
A circumcircle is a circle that circumscribes a triangle's corner points. Plotting them for a regular mesh (sphere) looks pretty, for an irregular mesh (rabbit) it looks like it has odd piercings everywhere.
When you're the geometry processing nerd in the department colleagues ask you to help with all sorts of things.
Cubic smoothing splines be like.
#Julialang #opensource #GeometryProcessing
Code: https://github.com/COMODO-research/Comodo.jl/blob/main/examples/demo_smoothing_spline.jl
Made possible by: https://github.com/jipolanco/BSplineKit.jl
I can highly recommend the Summer Geometry Initiative (SGI) by @JustinMSolomon. It is a six-week paid summer #research program introducing undergraduate and graduate students to the field of #geometryProcessing. Details: https://sgi.mit.edu applications due February 17, 2025.
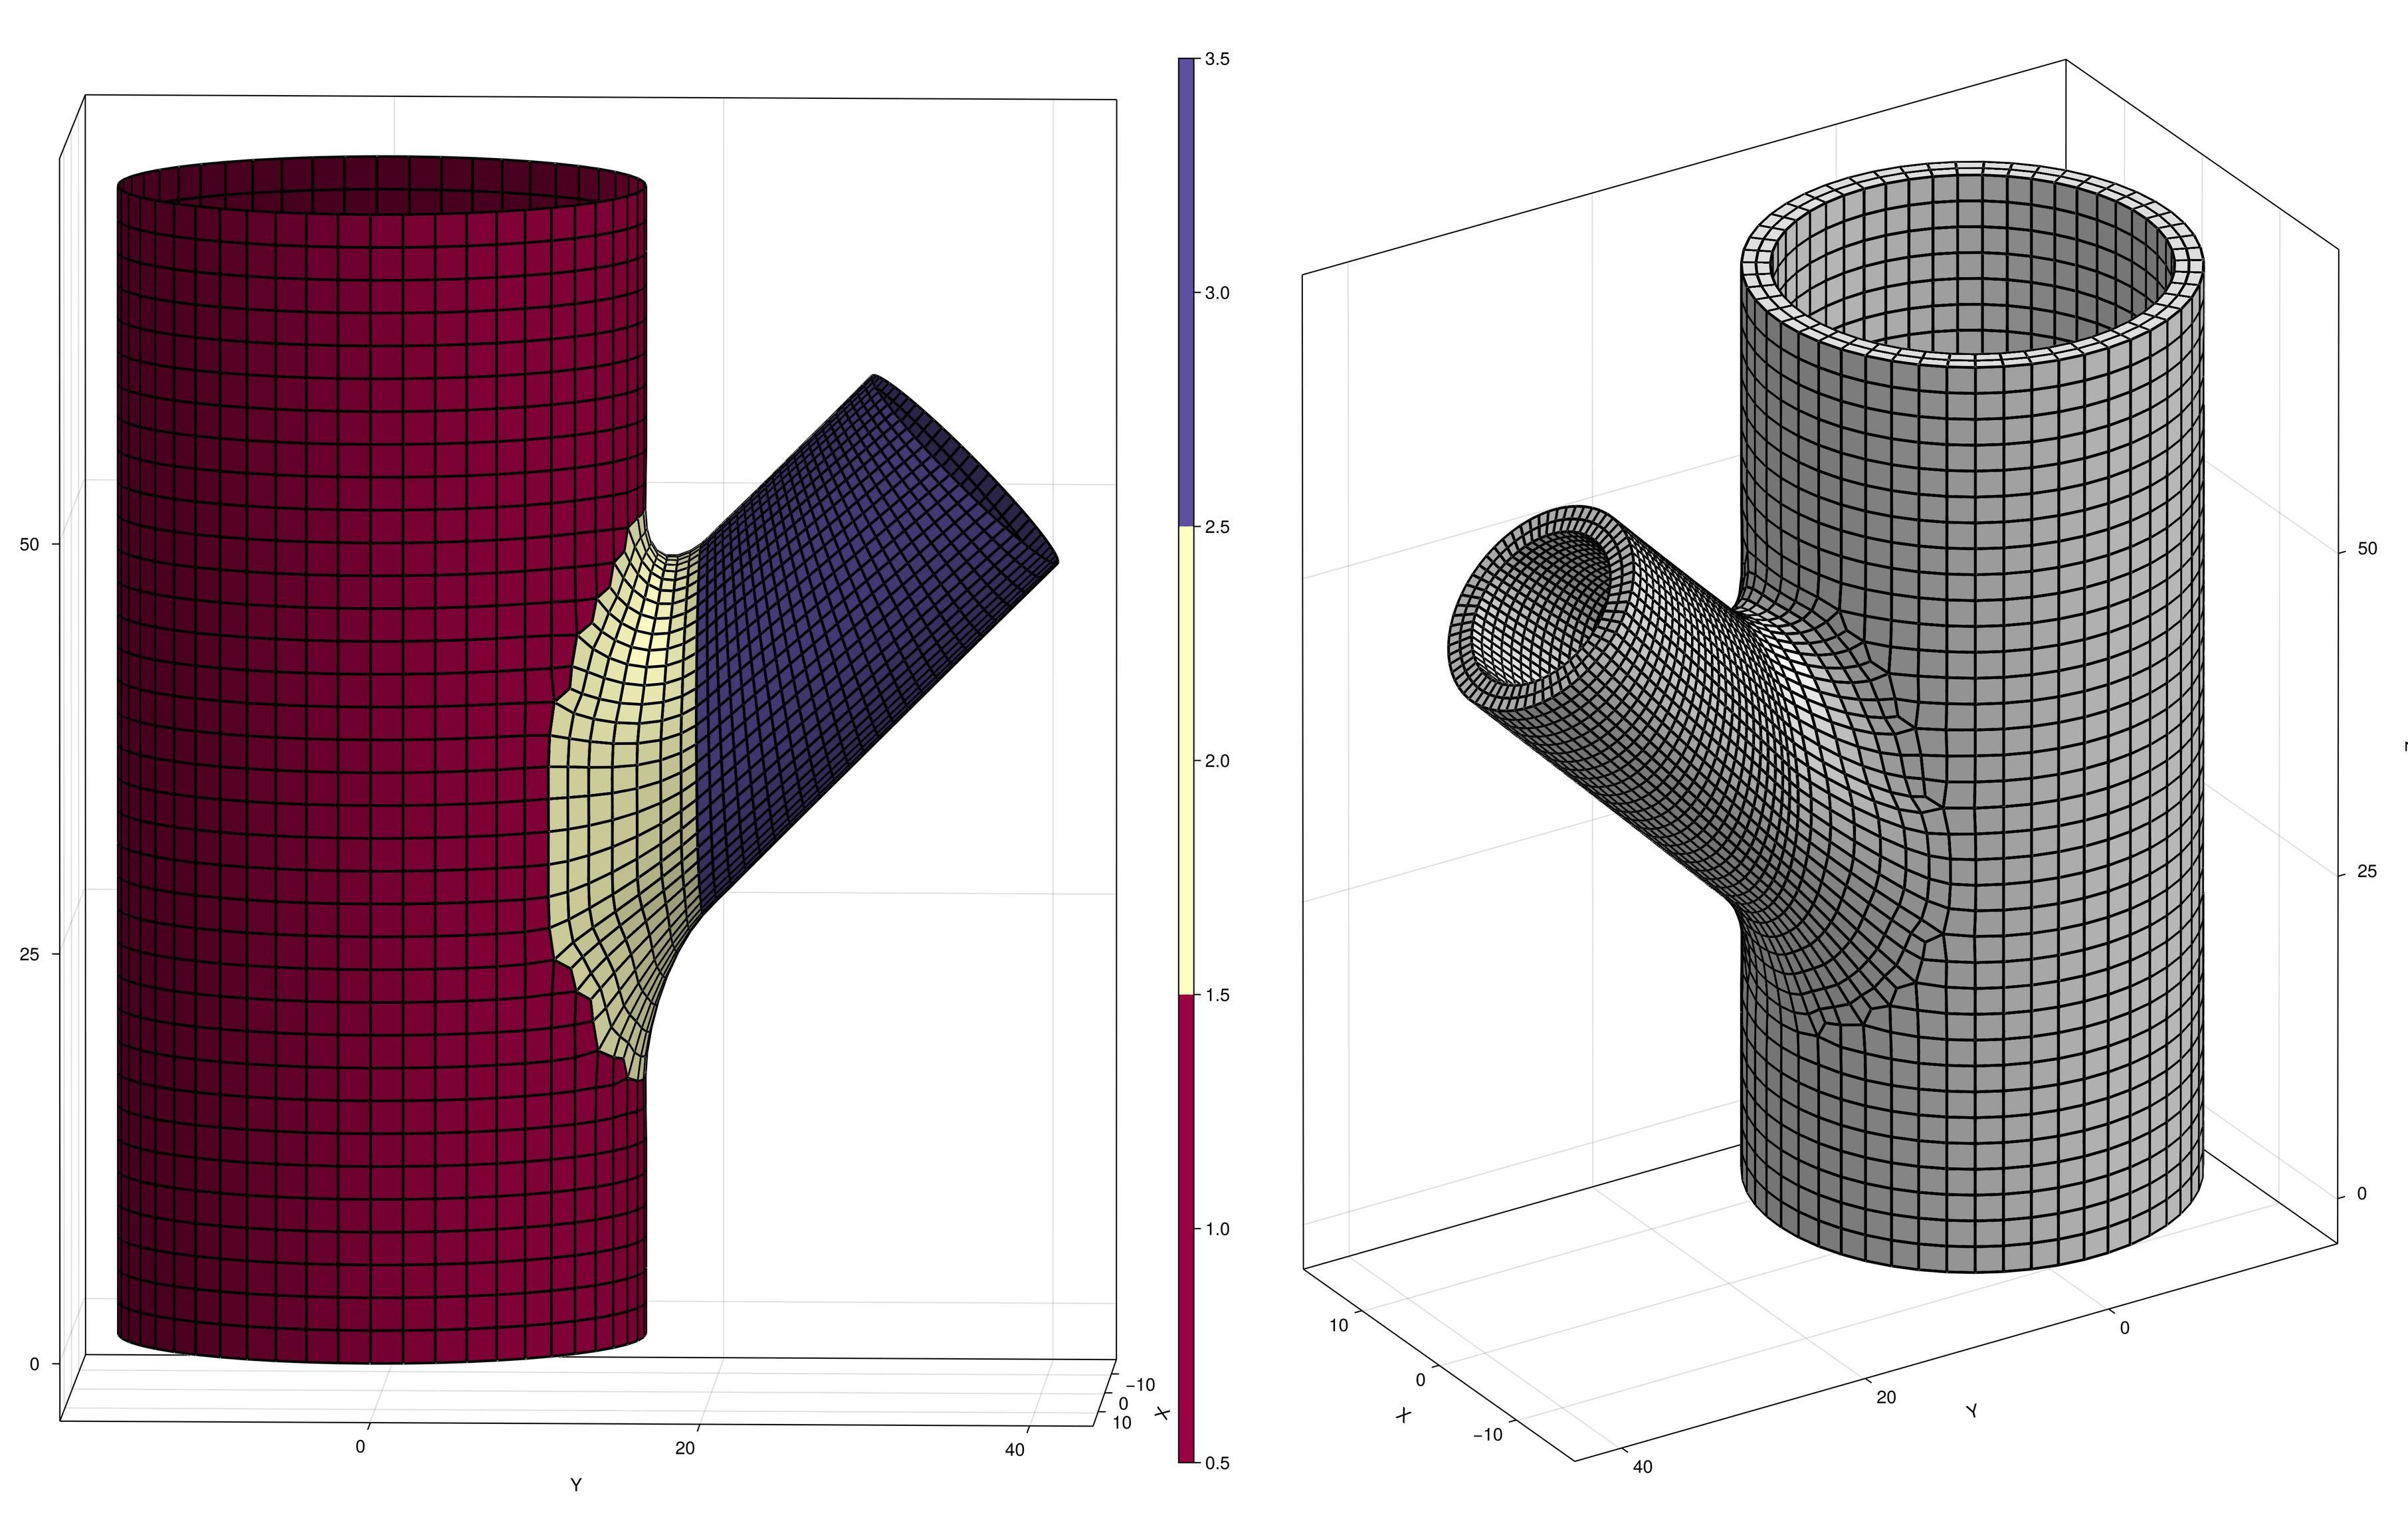
Working on automated quasi-structured hexahedral meshing of branched structures in #Comodo.
My current solution features a lot of fun tricks, e.g. ray tracing, distance marching, surface smoothing, Bezier splines, lofting, thickening etc.
#JuliaLang #opensource #GeometryProcessing #ComputationalDesign #Biomechanics
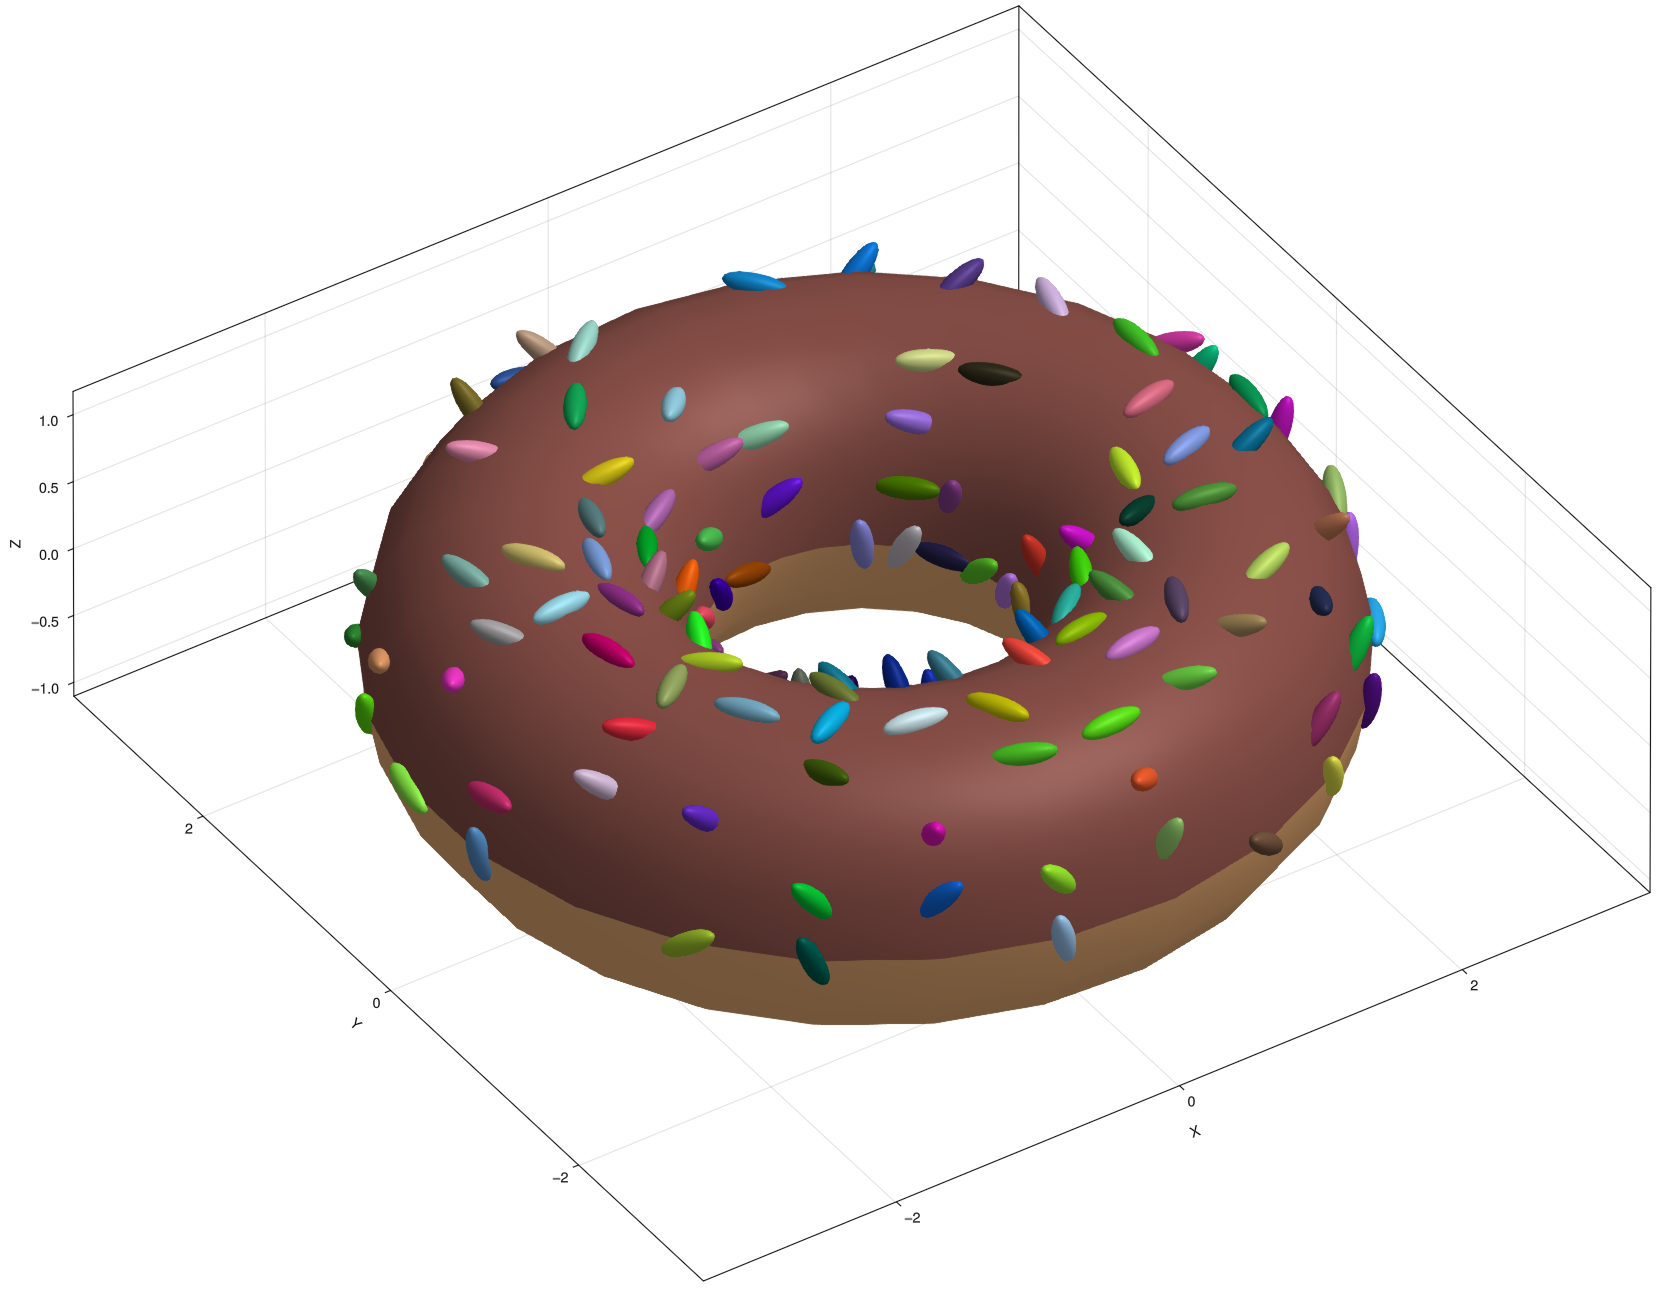
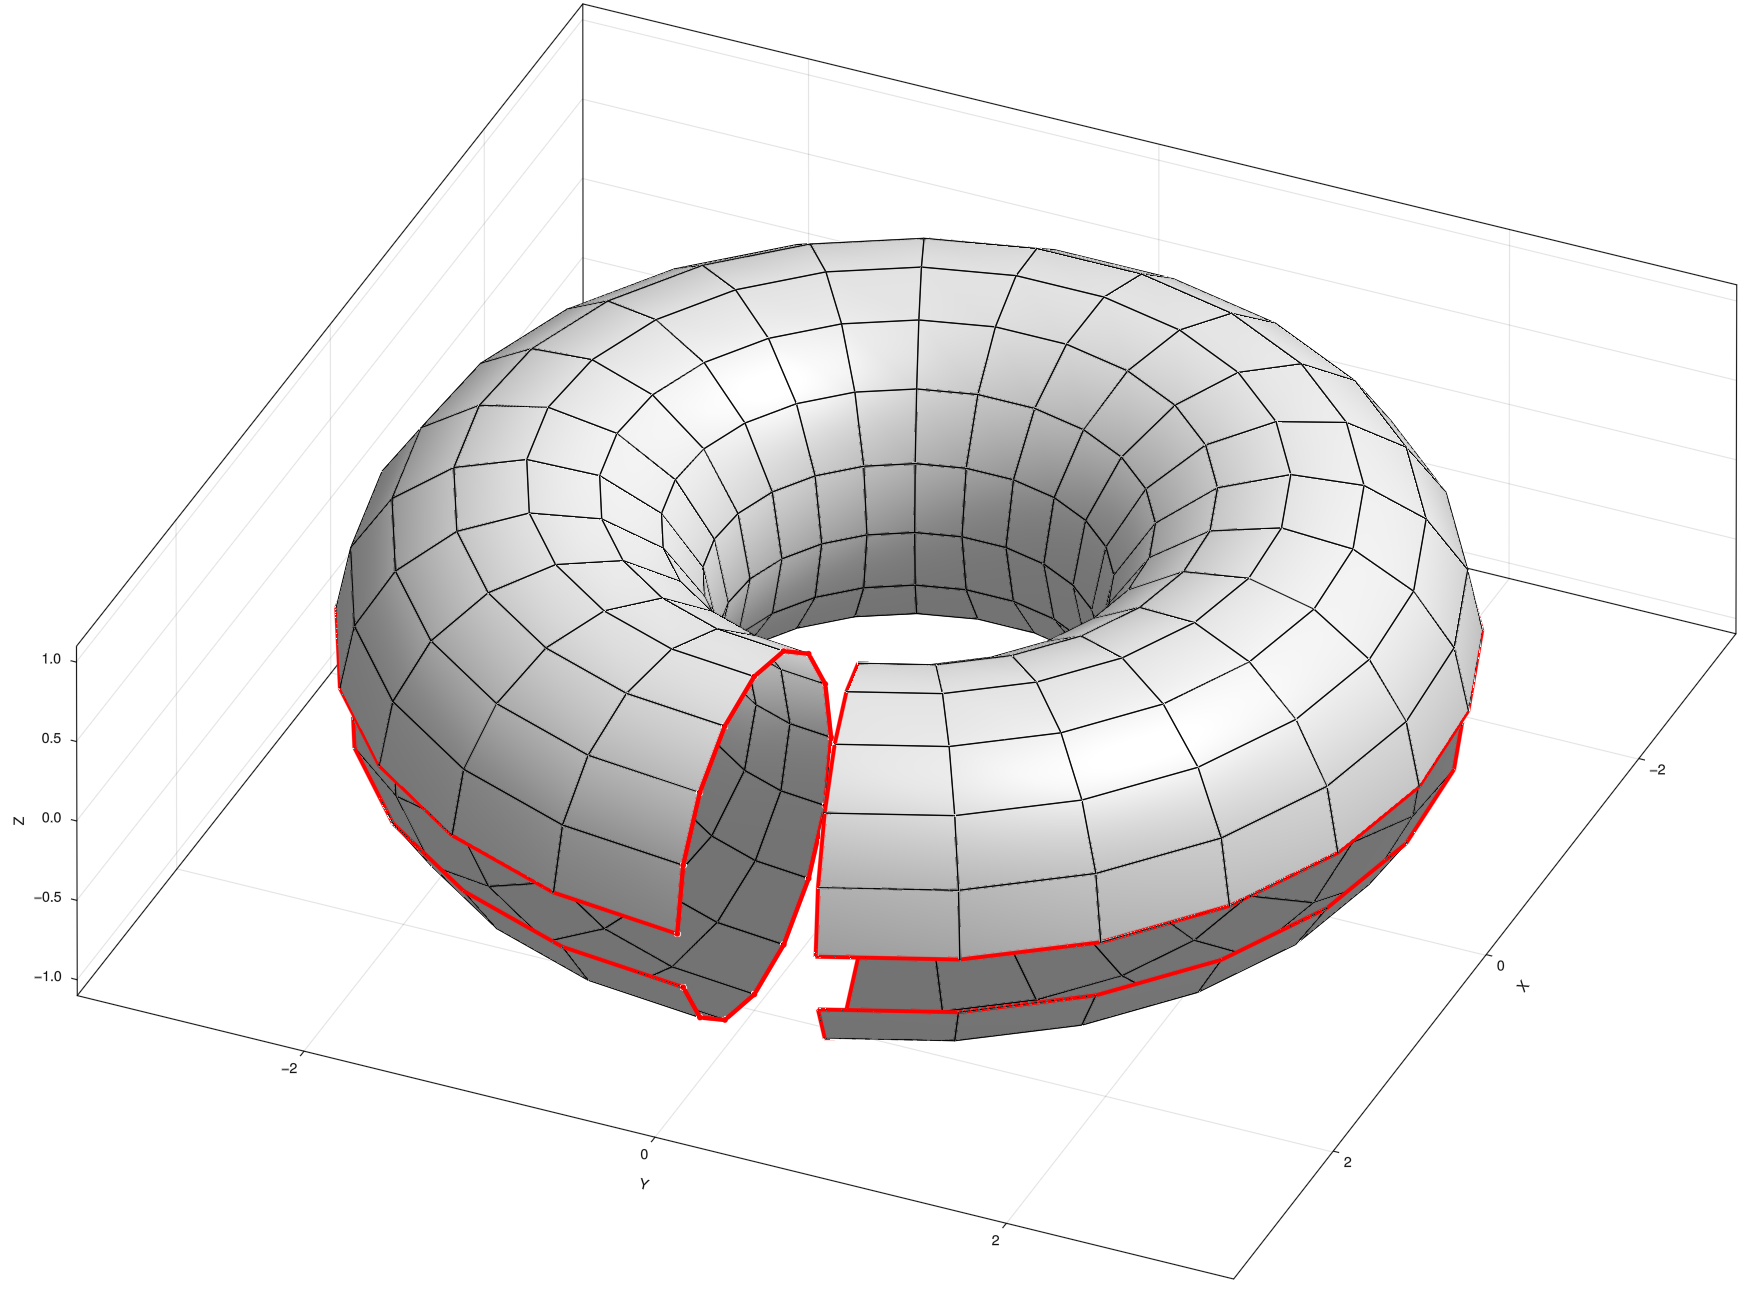
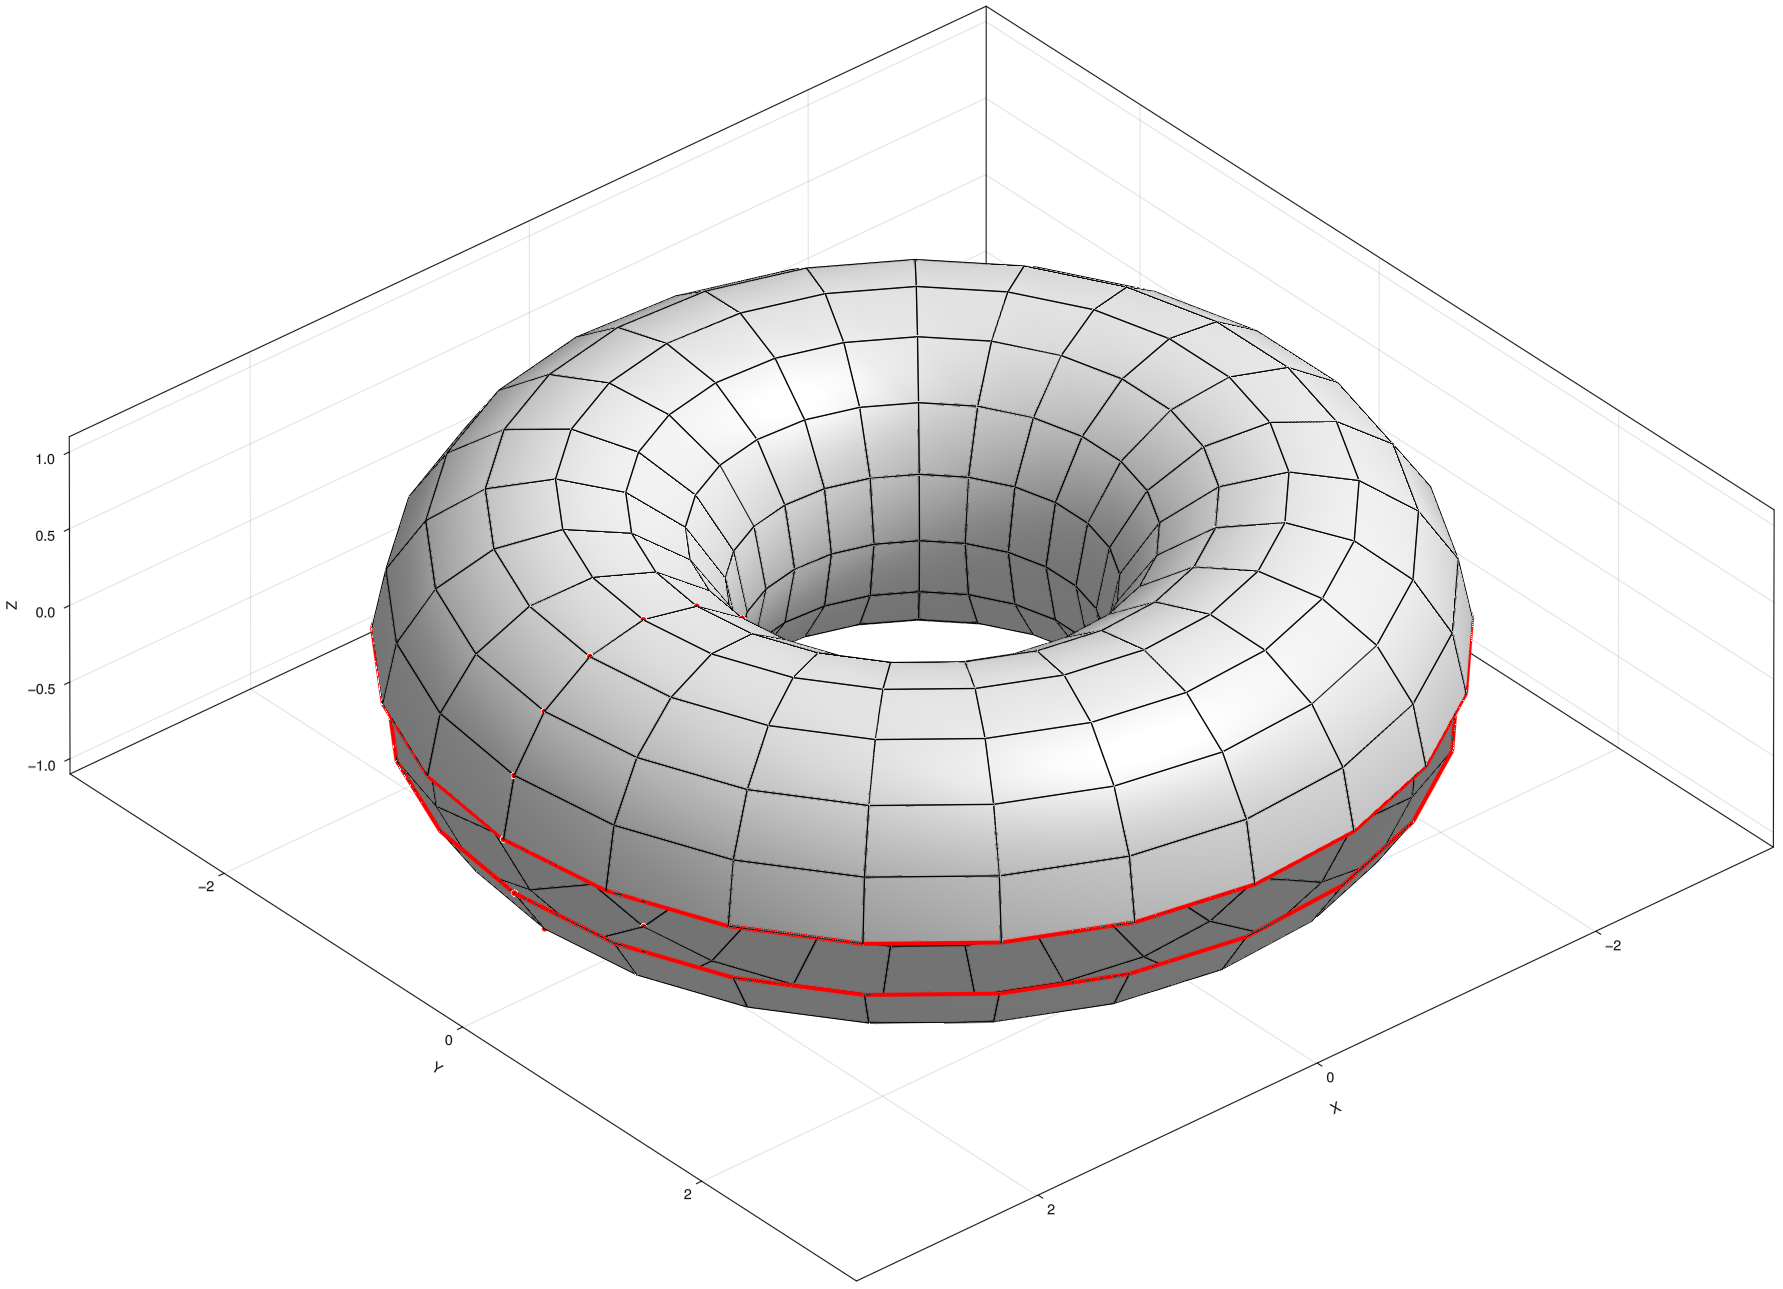
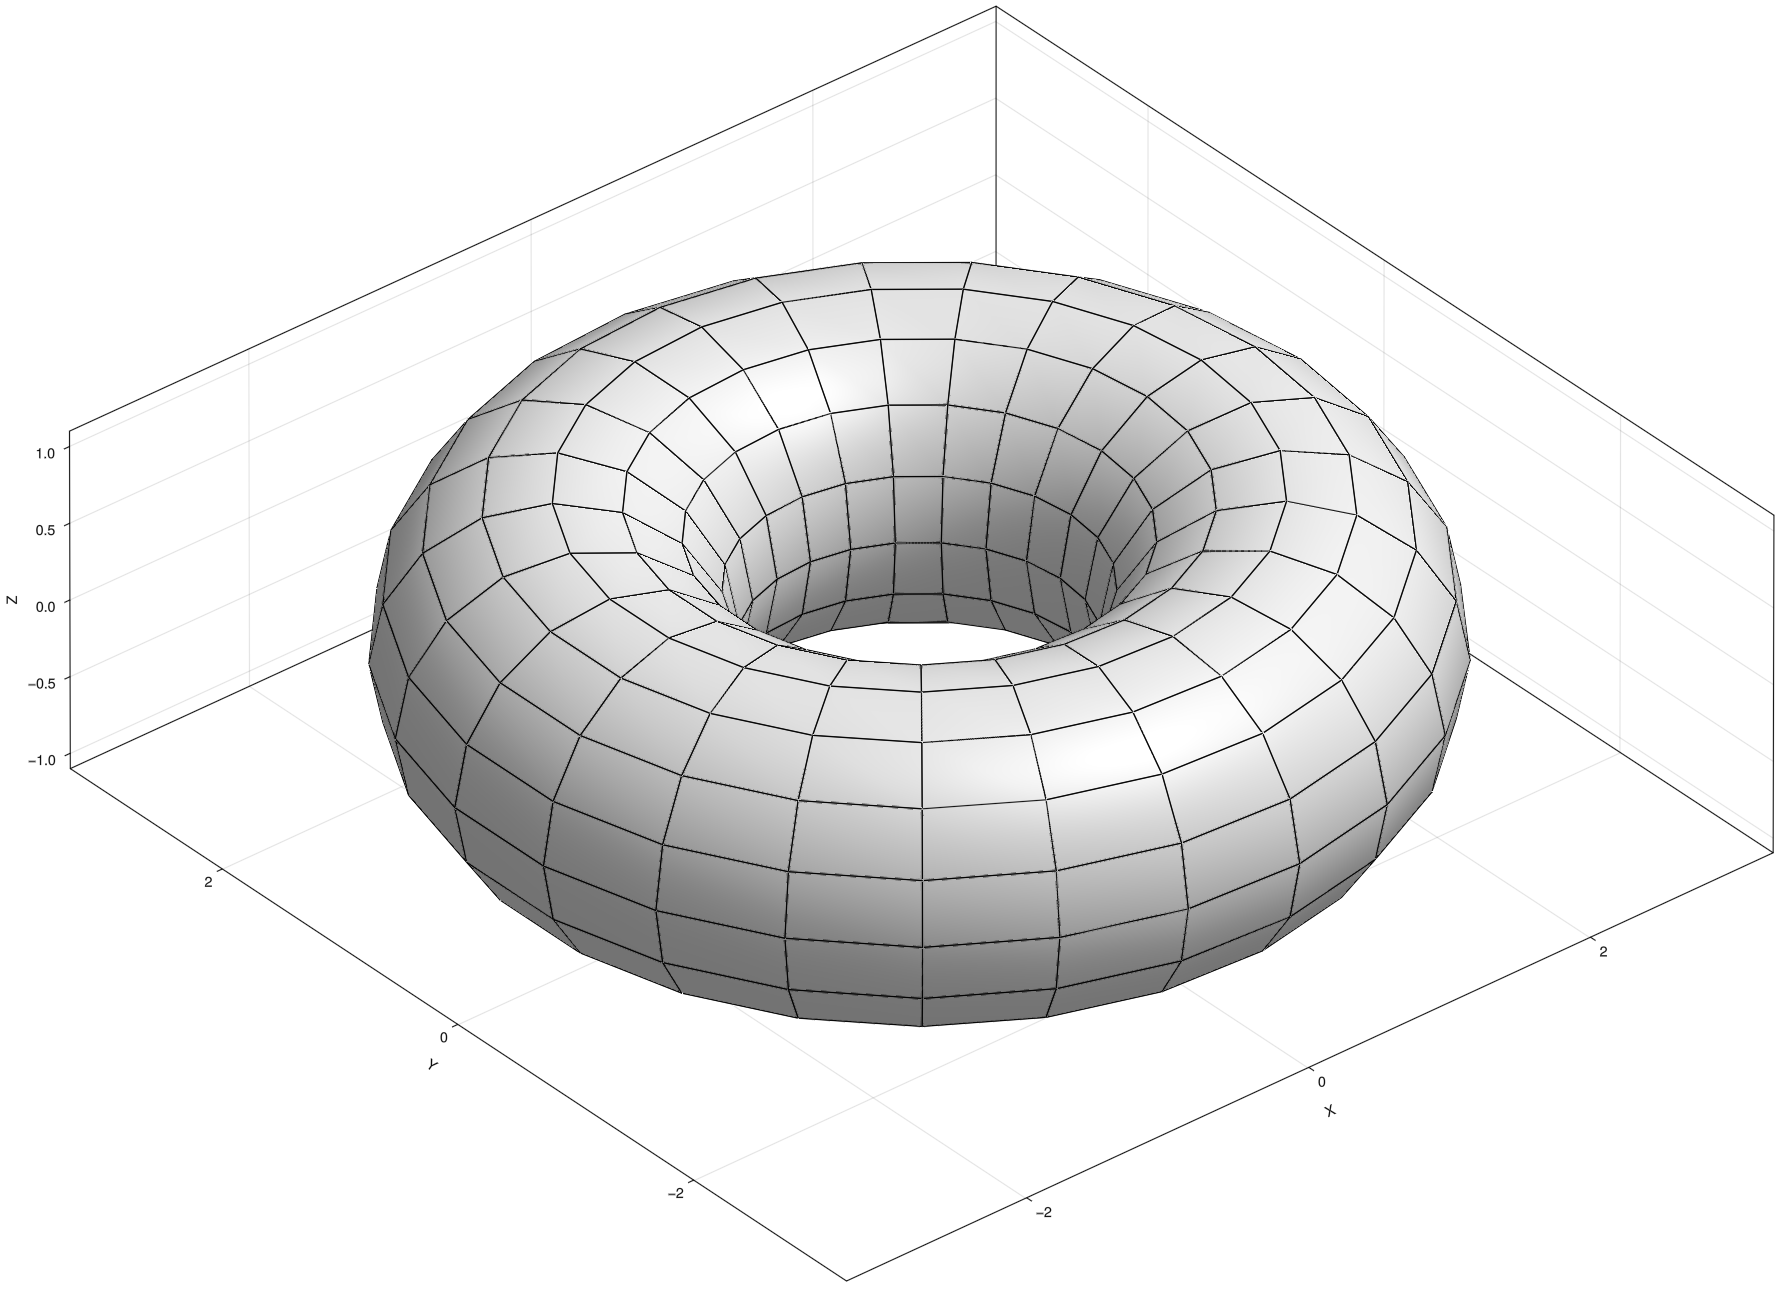
Was working on surface closure methods, and was using a torus as a test surface (since it has two "periodic" mesh directions to close over).
Son: "What yah making papa?"
Me: Oh I'm using this doughnut to..
Son: That is not a doughnut! That is the wrong color.
Me: Okay, let me render it brownish and..
Son: No, you need to add chocolate too, and sprinkles of all colors!
Me (15 min later): Got it!
And truncating these (cutting the spikes off) is fun too.
Here I cut so the upward edge lengths are the same as the equatorial edge lengths. It produces rather pleasing pentagonal rings.
Meet the n-trapezohedron.
Recipe: put 2*n points around the equator, and 2 more for the poles. Now form n top faces and n bottom faces (all quadrilateral). Now alter the points so that all faces are planar.
High n-values give spiky diamond like things. But the special case with n=3 produces the humble cube!
More here too:
https://en.wikipedia.org/wiki/Trapezohedron
Nice set of equations describing the shapes:
https://mathworld.wolfram.com/Trapezohedron.html
#Comodo #ComputationalDesign #GeometryProcessing #OpenSource #JuliaLang
Meet the "Pyritohedron", named after the shapes seen in the crystals of the mineral pyrite.
https://en.wikipedia.org/wiki/Dodecahedron#Pyritohedron
These shapes are involved in the Weaire-Phelan bubble structure:
https://en.wikipedia.org/wiki/Weaire%E2%80%93Phelan_structure
I am working on these as I am implementing various foams and lattice structures in #Comodo #JuliaLang
Working on mesh edge angle analysis in #JuliaLang. Left is the @FreeCAD model, right is the #Comodo mesh edge angle analysis. This will enable surface feature segmentation, e.g. top, inner, sides etc.
#opensource #CAD #FreeCAD #ComputationalDesign #GeometryProcessing
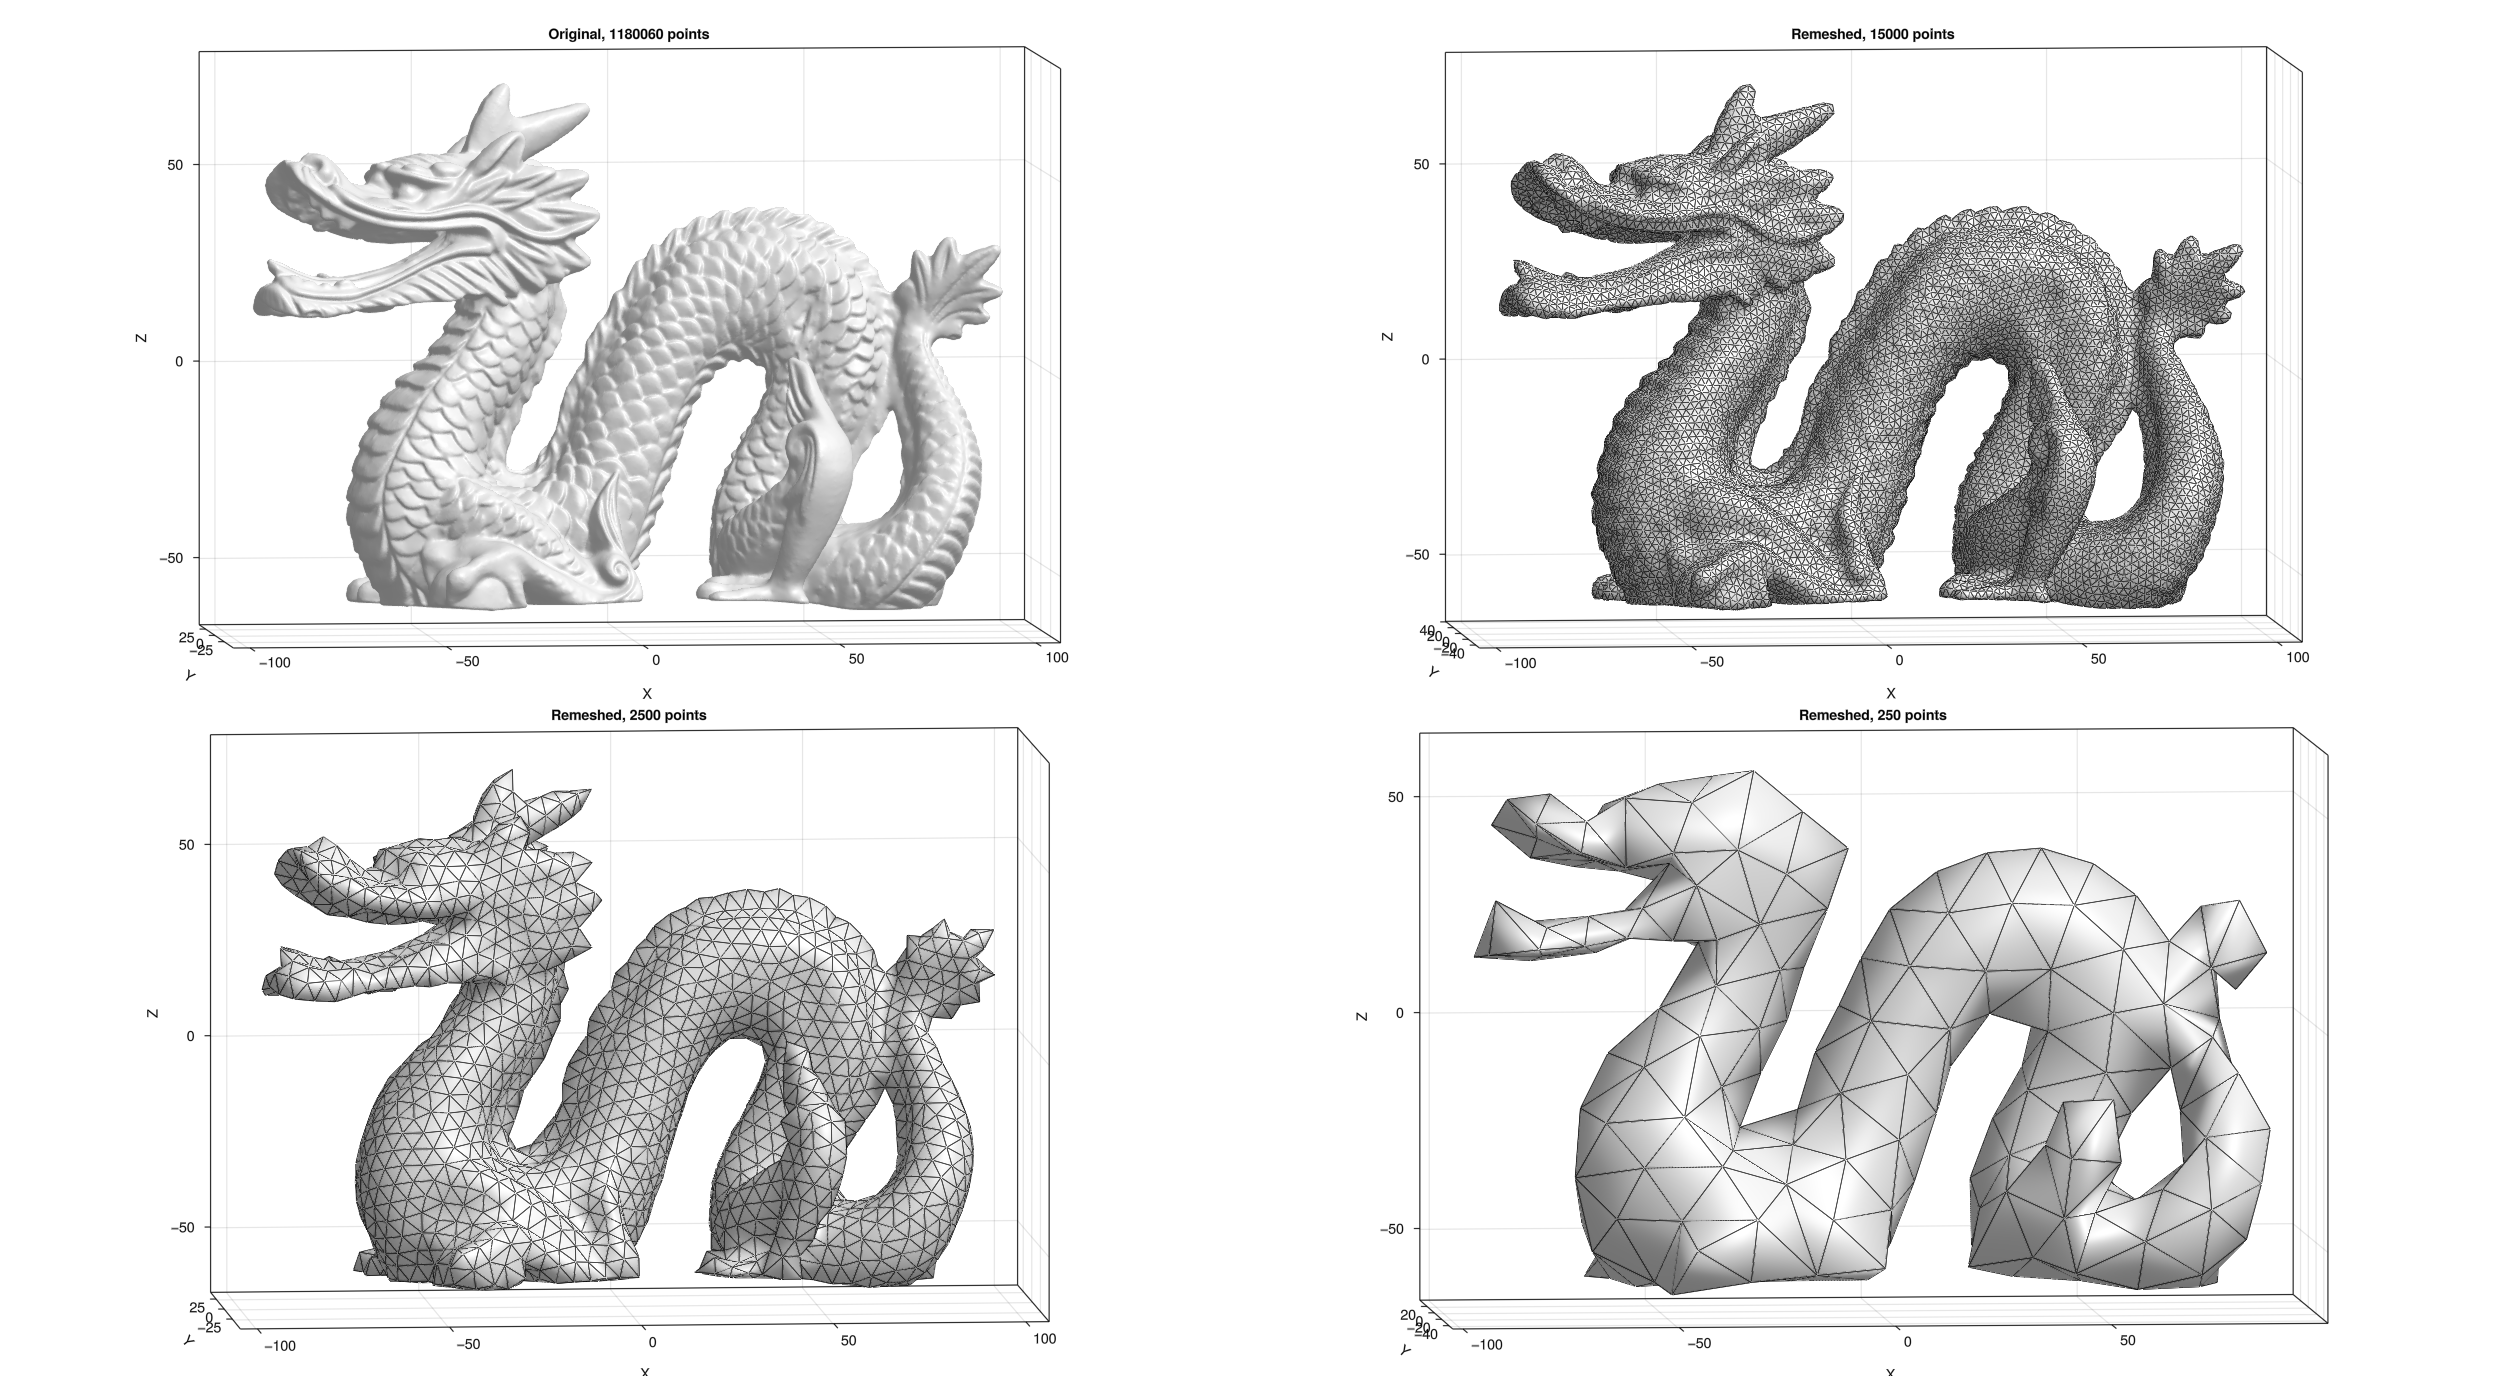
Went with another classic, the dragon statue.
This shows triangulated surface remeshing using a (very basic) #JuliaLang wrapper for @BrunoLevy01 et al.'s fantastic Geogram library (https://github.com/BrunoLevy/geogram).
#GeometryProcessing #Meshing #ComputationalMechanics #ComputationalDesign
Using colors it becomes clear how this relates to the mesh dual. The original mesh (fully orange) can be morphed into the dual mesh (fully purple). Intermediate results allow one to define two lattices, one obtained by connecting orange+green and one purple+green.
Now adding multi-region meshing whereby each meshed region can contain multiple meshed regions and holes, and each region can have its own point spacing defined.
Getting there. These images show tests of a triangulation algorithm I've developed that uses Delaunay triangulation. It features mostly equilateral triangles except for at the boundaries.
Coming soon to #comodo: constrained #Delaunay triangulations. Which I decided needs parameterized #Batman curves too for testing purposes 🦇
#julialang #GeometryProcessing #meshing #ComputationalDesign
Client Info
Server: https://mastodon.social
Version: 2025.04
Repository: https://github.com/cyevgeniy/lmst