#LearningStatistics

2025-03-26

The Graphs and Statistics are fascinating in this UN Report. It might provide good exercises for a data or statistcs class: redesign the pie charts, find the original figures and design tables... Just learn from it.. It's a shame the text was garbled when I tried to copy direct from the .pdf..
unodc.org/documents/data-and-a
#HomicideRates #MurderRate #StatisticsClass #LearningStatistics #UncertaintyGraphs #UncertaintyVisualization

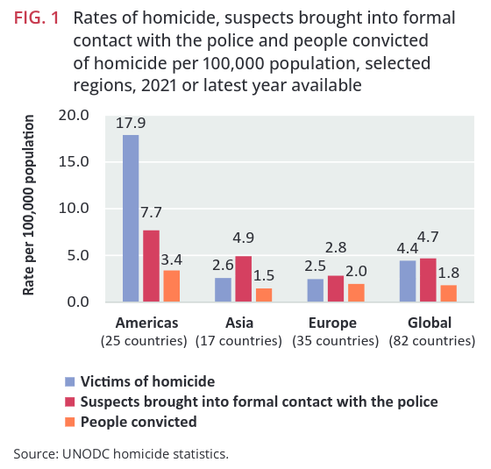
A screenshot of FIG. 1 on page 150 of the UN .pdf linked in the post. The figure shows the "Rates of homicide, suspects brought into contact with the police and people convicted of homicide per 100,000 population..>" for the "selected regions": Americas, Asia, Europe, Global. The data is from "2021 or latest year available".
The bar chart (nice thin bars, a decent ink-to-info ratio I guess) allows easy comparison of the "Victims of Homicide", "Suspects brought into formal contact with police", and "People Convicted" for each region. The figures are
Americas(25 countries), 17.9, 7.7, 3.4
Asia(17 countries), 2.6, 4.9, 1.5
Europe(35), 2.5, 2.8, 2.0
Global(82), 4.4, 4.7, 1.8 
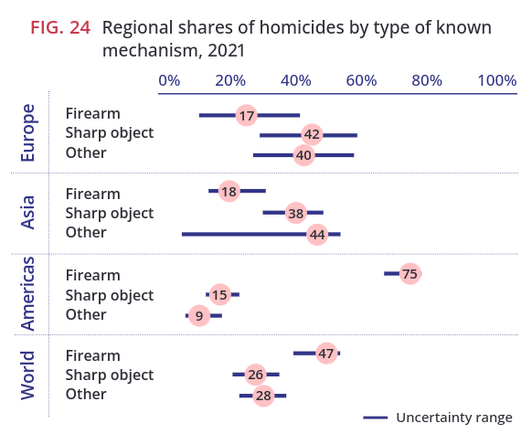
The Americas seem like an outlier region. Eduard Galeano probably points us towards an convincing explanation...Another screenshot of a FIG. from the UN .pdf linked in the post. This graph on page 132 shows "Regional shares of homicides by type of known mechanism, 2021" for the regions, Europe, Asia, Americas, and World. My attention was draw to visualization of an "uncertainty range" with a  blue line spanning a certain distance around (well up to in the case of 75% firearm murders in the Americas) the pink dot with a number for each observation. This graph could motivate learners of statistics working with confidence intervals and inferring uncertainty. Other parts of the document mention OLS regression ("Pooled cross-sectional OLS regression estimates predicting the (ln) homicide rate..") that could help motivate people to keep learning statistics in order to better understand documents like this, and to think of policy with greater confidence...
2022-11-19

An #introduction post: I love #Statistics and #Learning, which means that I love both #StatisticalLearning and #LearningStatistics. Currently, most of my professional focus is on #teaching #ResearchMethods and Statistics to #undergraduate #psychmajors. I also love #photography, #travel, and #food (who doesn’t), and have recently figured out a way to combine all of these loves into a three-week #StudyAbroad trip to #Japan where I get to teach a class on #PsychologyOfLanguage.

Client Info

Server: https://mastodon.social
Version: 2025.04
Repository: https://github.com/cyevgeniy/lmst