#WaterwayMapOrg

Amᵃᵖanda 🔜 CFCamapanda@en.osm.town
2025-06-12

awww yeah. 😎💪💫 After a few years, I've given in and added support for waterway relations in #WaterwayMapOrg code.

Notice how the Rhein, Elbe & Danube are all connected up as a single feature with the same name? It's using the `name` tag from the relation to match them up.

this is preview, WWM code will update haha soon enough. This'll mostly be useful for the River database list.
#maps #geodata #OSMDataProcessing
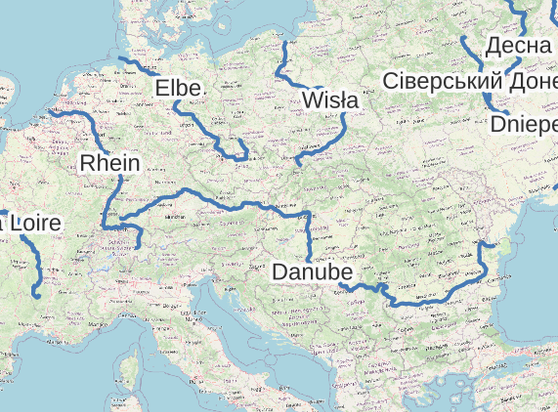
map of central europe, with a blue line for the following rivers & their names: Rhein, La Loire, Elba, Wisla, Danube
Amᵃᵖanda 🔜 CFCamapanda@en.osm.town
2025-05-19

Turns out the “weirdly long lengths” on #WaterwayMapOrg was … because the hand written distance function I wrote had some sort of bug.

I switched to a Proper Library™, and everything is Looking Sensible™

en.osm.town/@amapanda/11447282

Amᵃᵖanda 🔜 CFCamapanda@en.osm.town
2025-05-08

Hmmm, Wikipedia tells me the #Yukon River is 3,190 km long¹, but on #WaterwayMapOrg, (taken from #OpenStreetMap), I have it at 4,924 km long²…

I'm gonna have to figure out what's going on here. WWM's length is of the whole connected name group. Multiple connected side streams would increase the total length. But +1700 km?!

(yes the length is haversine distance, no web mercator/geometry stuff).

¹ en.wikipedia.org/wiki/Yukon_Ri
² waterwaymap.org/river/yukon-ri
#geo

2025-04-26

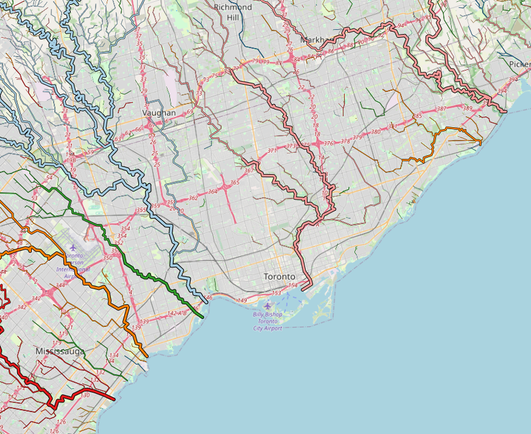
Sure I didn't do things I needed to this week, but look at this nifty #WaterwayMapOrg map showing watersheds!

(data © OpenStreetMap contributors, waterwaymap.org/#map=9.93/43.7 )

A map of Toronto and its near suburbs (Markham, Vaughan, and part of Mississauga), with baseline map from OpenStreetMap overlaid with rivers and streams. The rivers are drawn thicker further downstream, and (nearly) all river arms and streams that flow to the same river are drawn with the same colour. With this, the map effectively shows watersheds, because the finer-coloured tributary streams reach close to watershed boundaries.
Amᵃᵖanda 🔜 CFCamapanda@en.osm.town
2025-03-29
Amᵃᵖanda 🔜 CFCamapanda@en.osm.town
2025-03-29
2025-03-05

Current global loop count is 10023 (-0.2%).

✅ 3 new areas now have no loops!

❌ 1 new areas now have loops to be reviewed.

📉 The area with the greatest percentage decrease was DE at -5.0%

📈 The area with the greatest percentage increase was MX at +100.0%

Data: 26/02/2025 -> 03/03/2025
#OpenStreetMap #RiverMapping #WaterwayMapOrg

2025-02-26

Current global loop count is 10050 (+0.6%).

✅ 1 new areas now have no loops!

❌ 8 new areas now have loops to be reviewed.

📉 The area with the greatest percentage decrease was MK at -75.0%

📈 The area with the greatest percentage increase was IN-GA at +100.0%

Data: 19/02/2025 -> 25/02/2025
#OpenStreetMap #RiverMapping #WaterwayMapOrg

2025-02-19

Current global loop count is 10016 (-0.0%).

✅ 1 new areas now have no loops!

❌ 2 new areas now have loops to be reviewed.

📉 The area with the greatest percentage decrease was TR at -37.3%

📈 The area with the greatest percentage increase was US-TX at +100.0%

Data: 12/02/2025 -> 18/02/2025
#OpenStreetMap #RiverMapping #WaterwayMapOrg

Amᵃᵖanda 🔜 CFCamapanda@en.osm.town
2025-02-16

Just spent the weekend at Karlsruhe Hack Weekend at @geofabrik working on a cool new feature for #WaterwayMapOrg

I had to set up CGI on Hetzner’s web hosting, and it felt like I time-traveled back to the early 2000s—pure old-school web vibes. 🕹️✨

Now, fingers crossed that I can efficiently serve my millions of tiny files

2025-02-05

Current global loop count is 10007 (-0.1%).

✅ 4 new areas now have no loops!

❌ 1 new areas now have loops to be reviewed.

📉 The area with the greatest percentage decrease was US at -62.5%

📈 The area with the greatest percentage increase was SE at +100.0%

Data: 29/01/2025 -> 04/02/2025
#OpenStreetMap #RiverMapping #WaterwayMapOrg

2025-01-29

Current global loop count is 10018 (-0.2%).

✅ 9 new areas now have no loops!

❌ 5 new areas now have loops to be reviewed.

📉 The area with the greatest percentage decrease was ES at -71.4%

📈 The area with the greatest percentage increase was SL at +100.0%

Data: 22/01/2025 -> 28/01/2025
#OpenStreetMap #RiverMapping #WaterwayMapOrg

Amᵃᵖanda 🔜 CFCamapanda@en.osm.town
2025-01-25

I am using an #LLM (#ChatGPT) to learn how various hydrological features are called. 😂😭

“When river A flows into B, what do we call B from A's perspective?” etc 😂😂😂
#WaterwayMapOrg

OpenCage 👉🌍opencage@en.osm.town
2025-01-23

One of our 2025 New Year's resolutions was to restart our very long running #OpenStreetMap blog interview series, and I am pleased to share our first interview of the year - we chatted with @amapanda maker of WaterwayMap

blog.opencagedata.com/post/ope

#WaterwayMapOrg

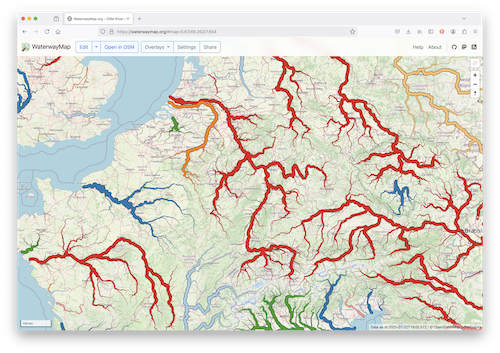
Screenshot of WaterwayMap.org
2025-01-22

Current global loop count is 10038 (+0.2%).

✅ 1 new areas now have no loops!

❌ 6 new areas now have loops to be reviewed.

📉 The area with the greatest percentage decrease was IN-CT at -33.3%

📈 The area with the greatest percentage increase was IN-WB at +50.0%

Data: 15/01/2025 -> 21/01/2025
#OpenStreetMap #RiverMapping #WaterwayMapOrg

2025-01-15

Current global loop count is 10016 (+1.4%).

✅ 3 new areas now have no loops!

❌ 1 new areas now have loops to be reviewed.

📉 The area with the greatest percentage decrease was SA at -55.0%

📈 The area with the greatest percentage increase was IN-CT at +50.0%

Data: 08/01/2025 -> 14/01/2025
#OpenStreetMap #RiverMapping #WaterwayMapOrg

2025-01-08

Current global loop count is 9775 (-0.2%).

✅ 5 new areas now have no loops!

❌ 0 new areas now have loops to be reviewed.

📉 The area with the greatest percentage decrease was MN at -92.0%

📈 The area with the greatest percentage increase was VE at +100.0%

Data: 01/01/2025 -> 07/01/2025
#OpenStreetMap #RiverMapping #WaterwayMapOrg

2025-01-01

Current global loop count is 9829 (-3.4%).

✅ 6 new areas now have no loops!

❌ 2 new areas now have loops to be reviewed.

📉 The area with the greatest percentage decrease was VE at -87.5%

📈 The area with the greatest percentage increase was IN-UT at +50.0%

Data: 25/12/2024 -> 31/12/2024
#OpenStreetMap #RiverMapping #WaterwayMapOrg

2024-12-25

Current global loop count is 10222 (-3.7%).

✅ 13 new areas now have no loops!

❌ 5 new areas now have loops to be reviewed.

📉 The area with the greatest percentage decrease was CL at -97.7%

📈 The area with the greatest percentage increase was PH at +66.7%

Data: 18/12/2024 -> 24/12/2024
#OpenStreetMap #RiverMapping #WaterwayMapOrg

Amᵃᵖanda 🔜 CFCamapanda@en.osm.town
2024-12-20

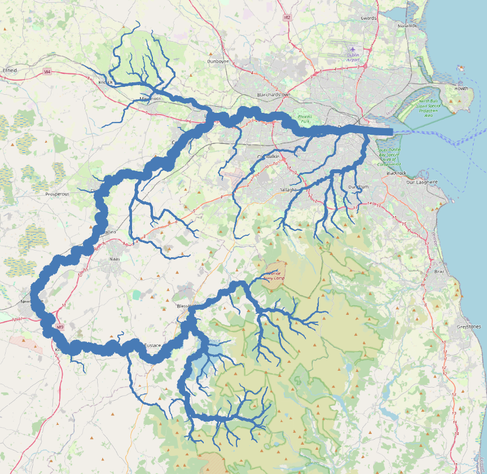
Wanna help make #maps of #waterways from #OpenStreetMap? #WaterwayMapOrg now includes a first attempt at data export for you.
read more: github.com/amandasaurus/waterw

I'd like people to try it out and give me feedback on that data, how it's structured, etc. Is this the best format/layout?

Share the maps you make please. 🙂

a map of dublin, ireland, with the river liffey and all it's tributaries mapped.

Client Info

Server: https://mastodon.social
Version: 2025.04
Repository: https://github.com/cyevgeniy/lmst