@arclight maybe #Ziaplot https://ziaplot.readthedocs.io/en/latest/
#Ziaplot
Quick #py5 + #Ziaplot experiment :)
I could have used the PNG output provided by Ziaplot, but I wish py5's convert_image (also using cairosvg under the hood) could handle in memory SVG-bytes (or maybe it does and I haven't figured it out) cc @codeismycanvas @py5coding
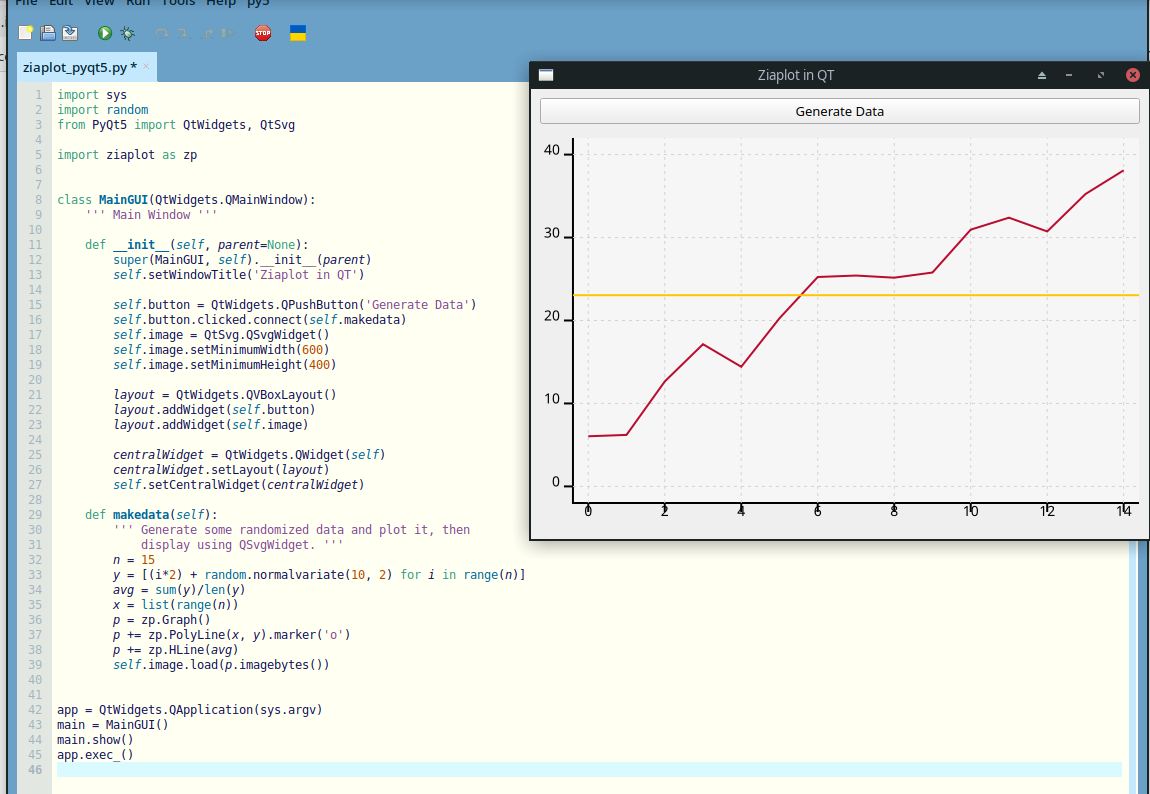
#Ziaplot & #PyQt5, SVG on a #Python GUI, example from the docs https://ziaplot.readthedocs.io/en/latest/gui.html (there is anotehr exemple that renders the graph as PNG for embeding on #TkInter)
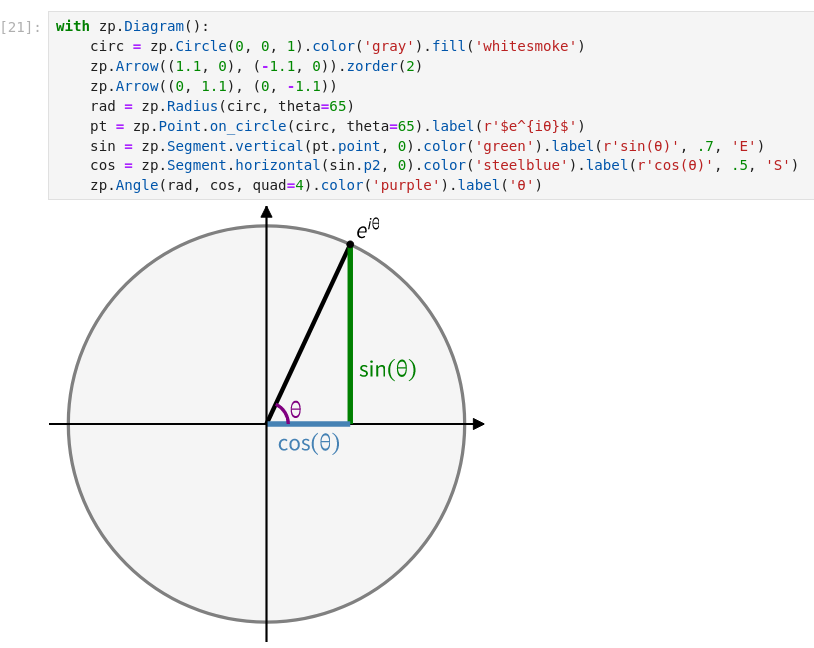
A new version of #Ziaplot (https://ziaplot.readthedocs.io) is out, thanks to @codeismycanvas "[Ziaplot is a] #Python package for drawing geometric #diagrams, #charts, and discrete data #plots. While the well-known plotting libraries focus on plotting discrete data points, ziaplot treats geometric diagrams...as first-class citizens...."
I just released a new version of ziaplot, my Python package for drawing geometric diagrams, charts, and discrete data plots. While the well-known plotting libraries focus on plotting discrete data points, ziaplot treats geometric diagrams, such as this unit circle illustration, as first-class citizens. No trig calculations or discretization required from the user.
Docs: https://ziaplot.readthedocs.io/
Source: https://github.com/cdelker/ziaplot
#ziaplot #python #plotting #datavis #geometry #graph #chart #diagram
Client Info
Server: https://mastodon.social
Version: 2025.04
Repository: https://github.com/cyevgeniy/lmst