#datascienceeducation

A super interesting episode with Professor Darren Mansfield on sleep, data, and sleep tracking devices.
“imagine if you go and run a one hour documentary on something that’s inconclusive. Here’s all the evidence for you is the evidence against and we can’t really don’t know. That’s not great television.”
” the truth is not always as clear cut and there are many layers of grey and there are many sides to a story”
“So you can see very rapidly that sleep apnea and for that matter other sleep […]
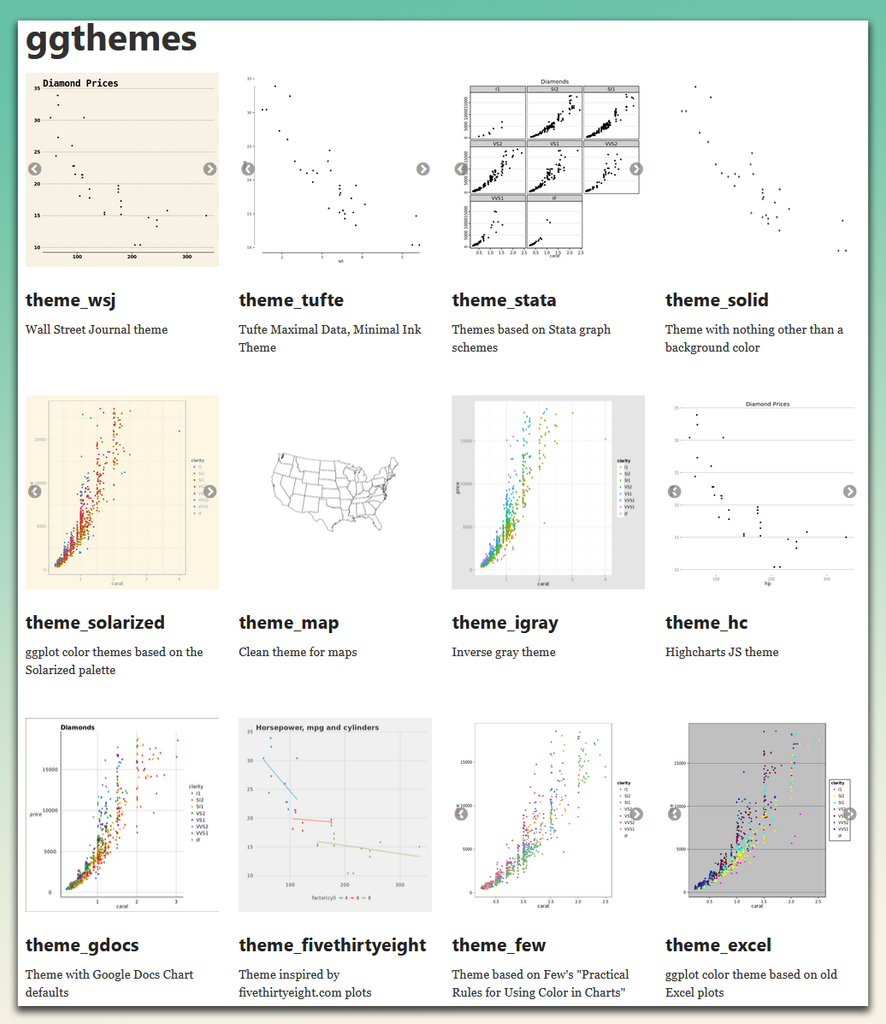
Make your plots more stylish and visually appealing! The ggthemes package offers a variety of pre-built themes that help you customize the look of your ggplot2 visualizations, drawing inspiration from popular design standards.
The visualization shown here is from the package website: https://yutannihilation.github.io/allYourFigureAreBelongToUs/ggthemes/
More: https://statisticsglobe.com/online-course-data-visualization-ggplot2-r
#datascienceeducation #coding #visualanalytics #tidyverse #ggplot2 #package
It’s important, when you’re making graphs, to think about the story you want to tell with the data, and what type of graph, and what features of the graph, will help you tell that story.
Likewise, when you’re looking at someone else’s graph, we all need to apply that critical data literacy and look at the scale on the y axis, as well as checking the labels, finding out the origin of the data, and considering whether the graph is accurate, a valid way to display that data, and what story it might be trying to tell you.


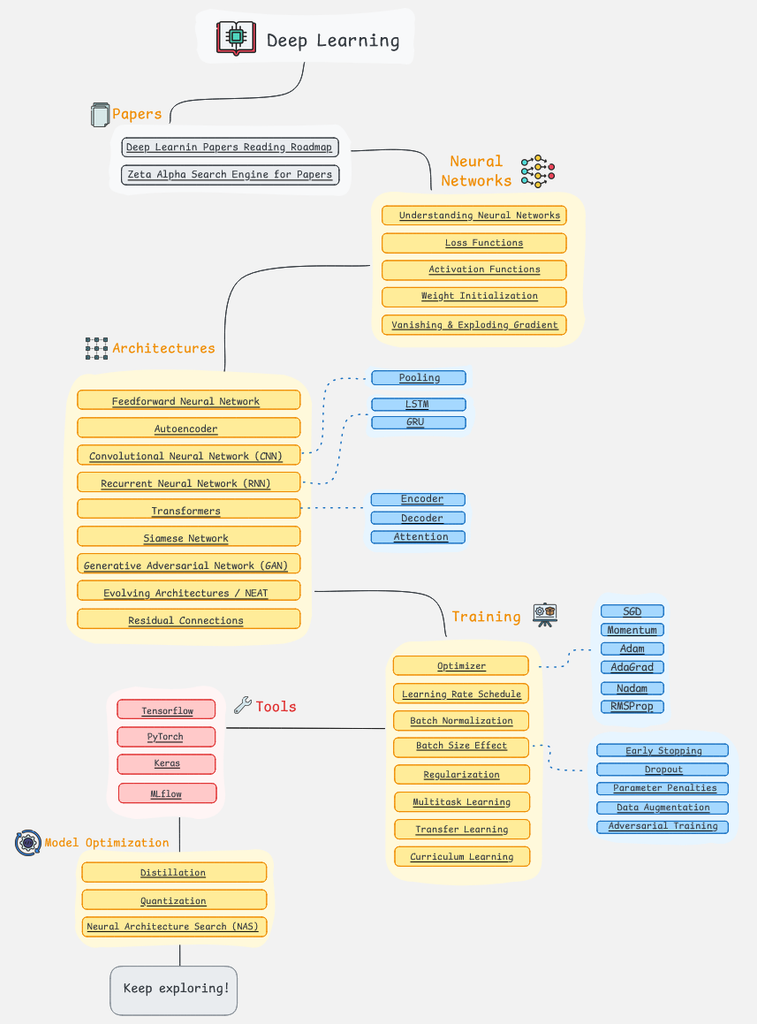
If you're looking to master Deep Learning, following a structured roadmap is key to navigating this advanced and ever-evolving field.
I came across this roadmap on the AIGENTS website, and what really stands out is its interactive format. Each element is clickable, offering AI-powered insights and resources that make it easier to dive deeper into each topic. Check out this link for more details: https://aigents.co/learn/roadmaps/deep-learning-roadmap
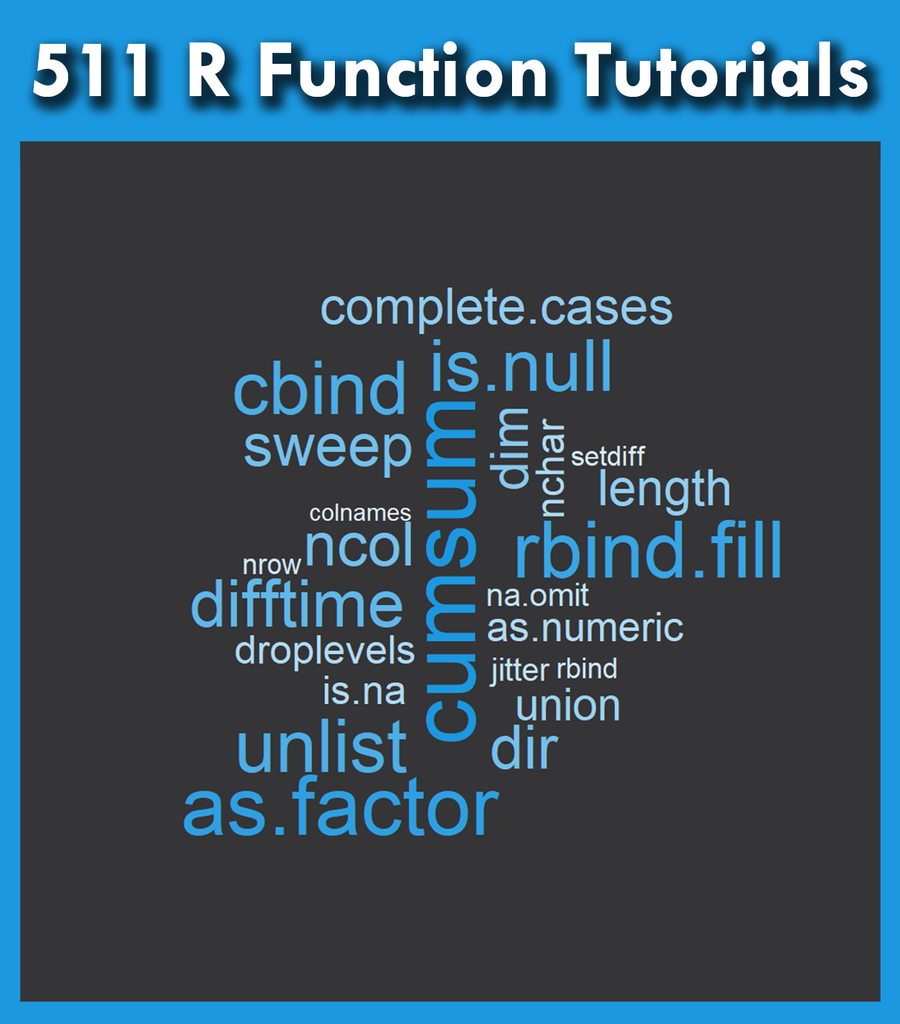
I've put together a comprehensive list of essential R programming functions, featuring 511 (!) tutorials and examples. This can serve as your go-to cheat sheet for mastering R programming!
All tutorials: https://statisticsglobe.com/r-functions-list/
Learn more by visiting this link: https://statisticsglobe.com/online-course-r-introduction
When I’m trying to get a piece of work out the door, I can often be heard muttering to myself “Perfect is the enemy of done.” Because the urge to fuss, and edit, and polish until not a blemish can be seen is absolutely fatal to the need to get something finished. I know that, but I often need reminding. Because I am a perfectionist at heart.
My kids (and, when I was a teacher, my students) […]
What we can build this way is a world where policy is evidence based. Where we make data informed decisions, while understanding that the data isn’t perfect. Where kids are empowered to learn all of the skills they need to solve problems in their own communities. Where technological solutions are rationally evaluated, rather than uncritically worshipped.
https://adsei.org/2024/11/23/from-hypnotised-to-heretic-immunising-society-against-misinformation/
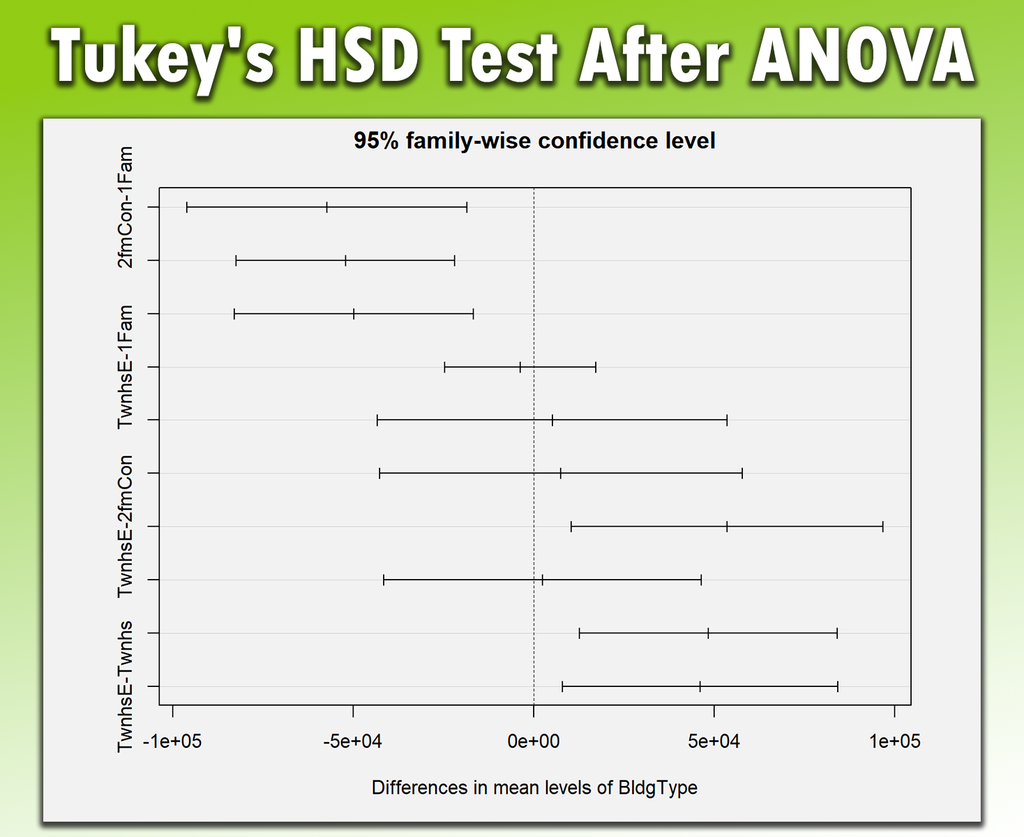
ANOVA can be used to test whether there are differences among group means, but it doesn't tell you which specific groups differ from each other. That's where Tukey's HSD test comes in—it helps pinpoint exactly which group means are significantly different.
For more on Tukey's HSD and other statistical methods, join my online course on Statistical Methods in R.
More details are available at this link: https://statisticsglobe.com/online-course-statistical-methods-r
The central limit theorem (CLT) is a fundamental concept in statistics, with wide-ranging applications. It states that the distribution of sample means approximates a Gaussian distribution (normal distribution) as the sample size grows, regardless of the population's original distribution.
Visualization link: https://en.wikipedia.org/wiki/Central_limit_theorem#/media/File:IllustrationCentralTheorem.png
Comprehensive tutorial link: https://statisticsglobe.com/central-limit-theorem
Further details: https://statisticsglobe.com/central-limit-theorem

If we assume girls aren’t capable of doing computing, we won’t give them the opportunity to learn computing.
https://adsei.org/2024/10/20/the-place-of-women-in-computing/
The tech industry is taking our data and taking us for a ride. It’s time to make noise!
https://adsei.org/2024/10/14/taken-for-granted-and-for-a-ride/
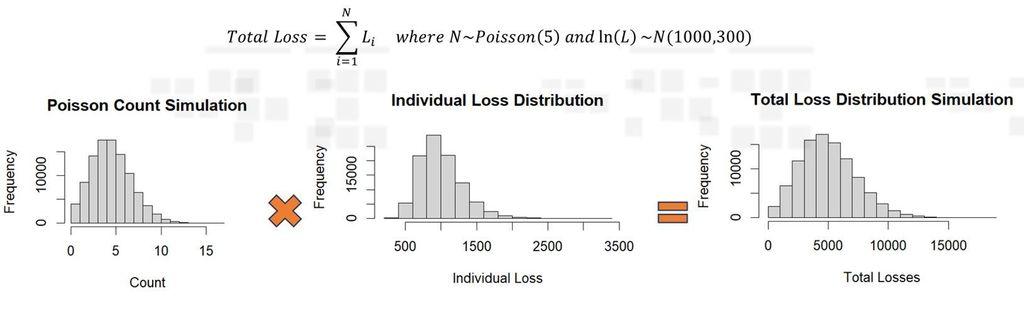
Risk modeling is a fascinating aspect of data science, particularly in the context of Frequency-Severity modeling and Monte Carlo simulations.
Thanks to Gabriel Ryan for sharing this graph in a recent post, which explains the topic in further detail.
More information: http://eepurl.com/gH6myT
#datavisualization #data #statisticians #pythonlearning #datascienceeducation #bigdata
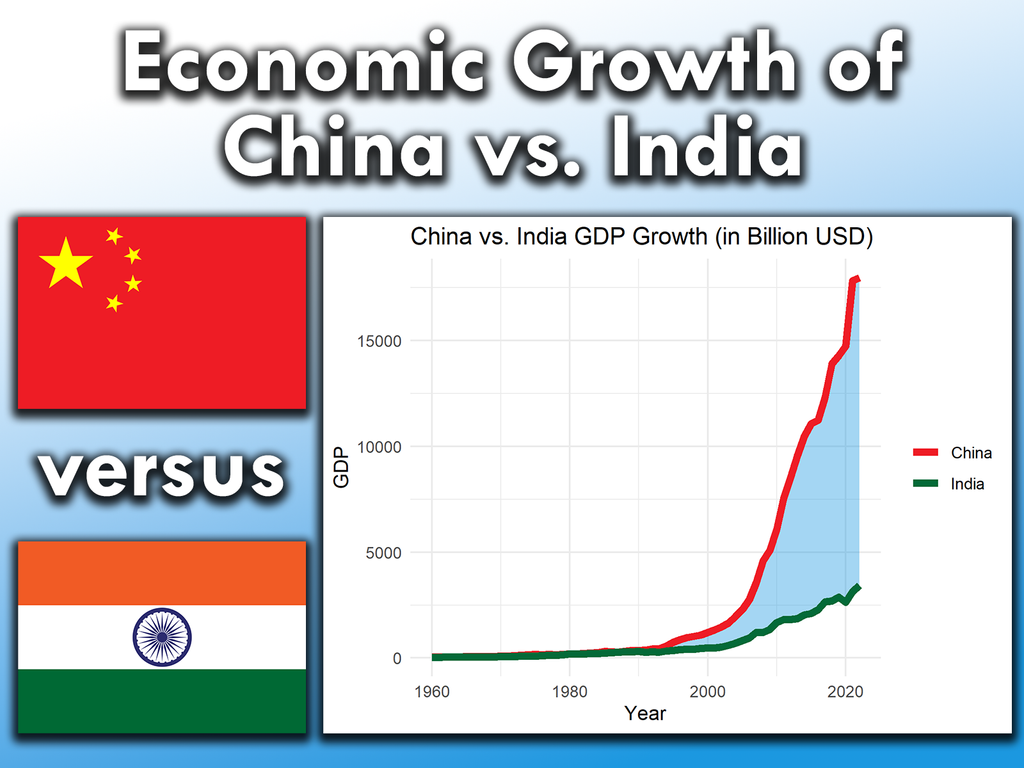
Did you know that China and India together account for over a third of the world's population? 🇨🇳🇮🇳 Their rapidly growing economies are transforming the global economic landscape.
Both countries face unique challenges but have the potential for continued economic growth.
I have created an extensive article on this topic for those who want to dive deeper into the GDP comparison between China and India. More details: https://statisticsglobe.com/gdp-china-vs-india
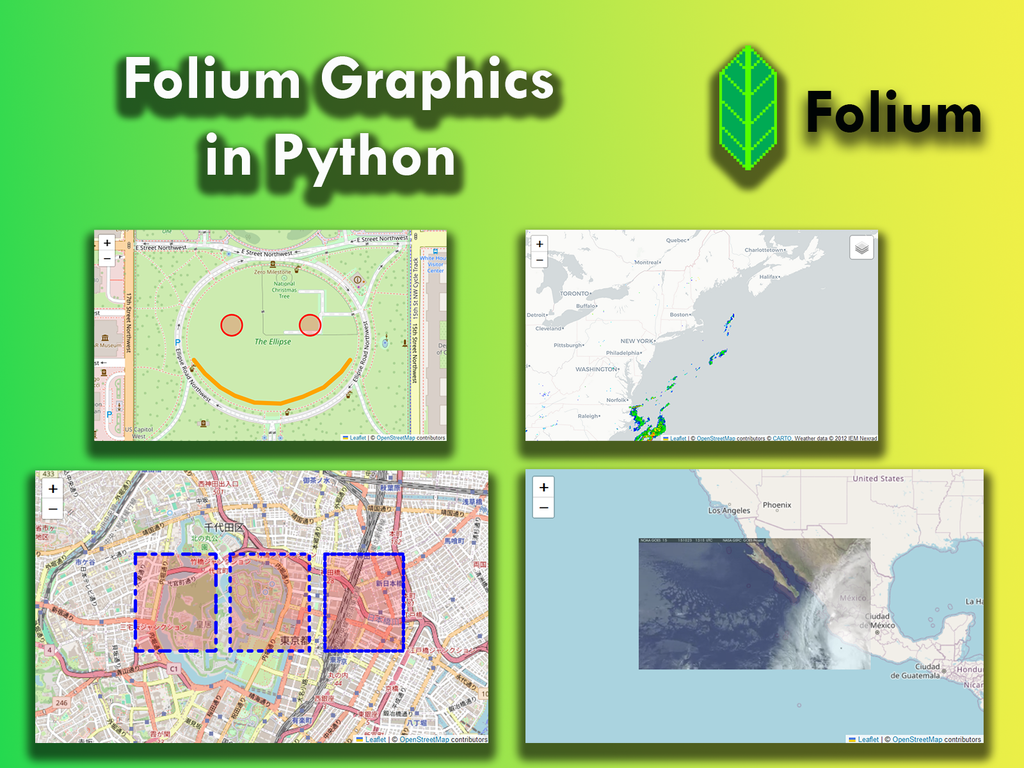
Folium is a powerful Python library that lets you create stunning interactive maps using Leaflet.js. It's a fantastic tool for visualizing geographic data in a dynamic way.
With Folium, you can transform your data into beautiful maps with minimal effort, making it perfect for data analysts, geographers, and anyone interested in geographic visualizations.
More details are available at this link: http://eepurl.com/gH6myT
#datascienceeducation #Data #Python #datastructure #DataScientist
“I grew up under the threat of nuclear war. Carl Sagan told us it was inevitable. It didn’t happen, and we’re not worried about nuclear war anymore, so obviously panicking about climate change is the same – in a few years we’ll realise there was nothing to be scared of. It’s not the crisis we think it is.”
I completely […]
https://adsei.org/2024/08/01/the-difference-between-climate-change-and-the-threat-of-nuclear-war/
Legends in plots are like road signs! They guide readers through the maze of your data, making sure they don't get lost along the way.
Learn more: https://statisticsglobe.com/add-legend-plot-matplotlib-seaborn-python
#datascienceeducation #statisticians #Python #database #DataViz #pythoncode #DataVisualization #DataAnalytics

What I love about projects like this is the opportunity for students to consider issues that don’t normally impact them, and then quantify them, and come up with ways to improve those numbers.
https://adsei.org/2024/07/08/using-data-science-to-investigate-discrimination-part-1-mobility/