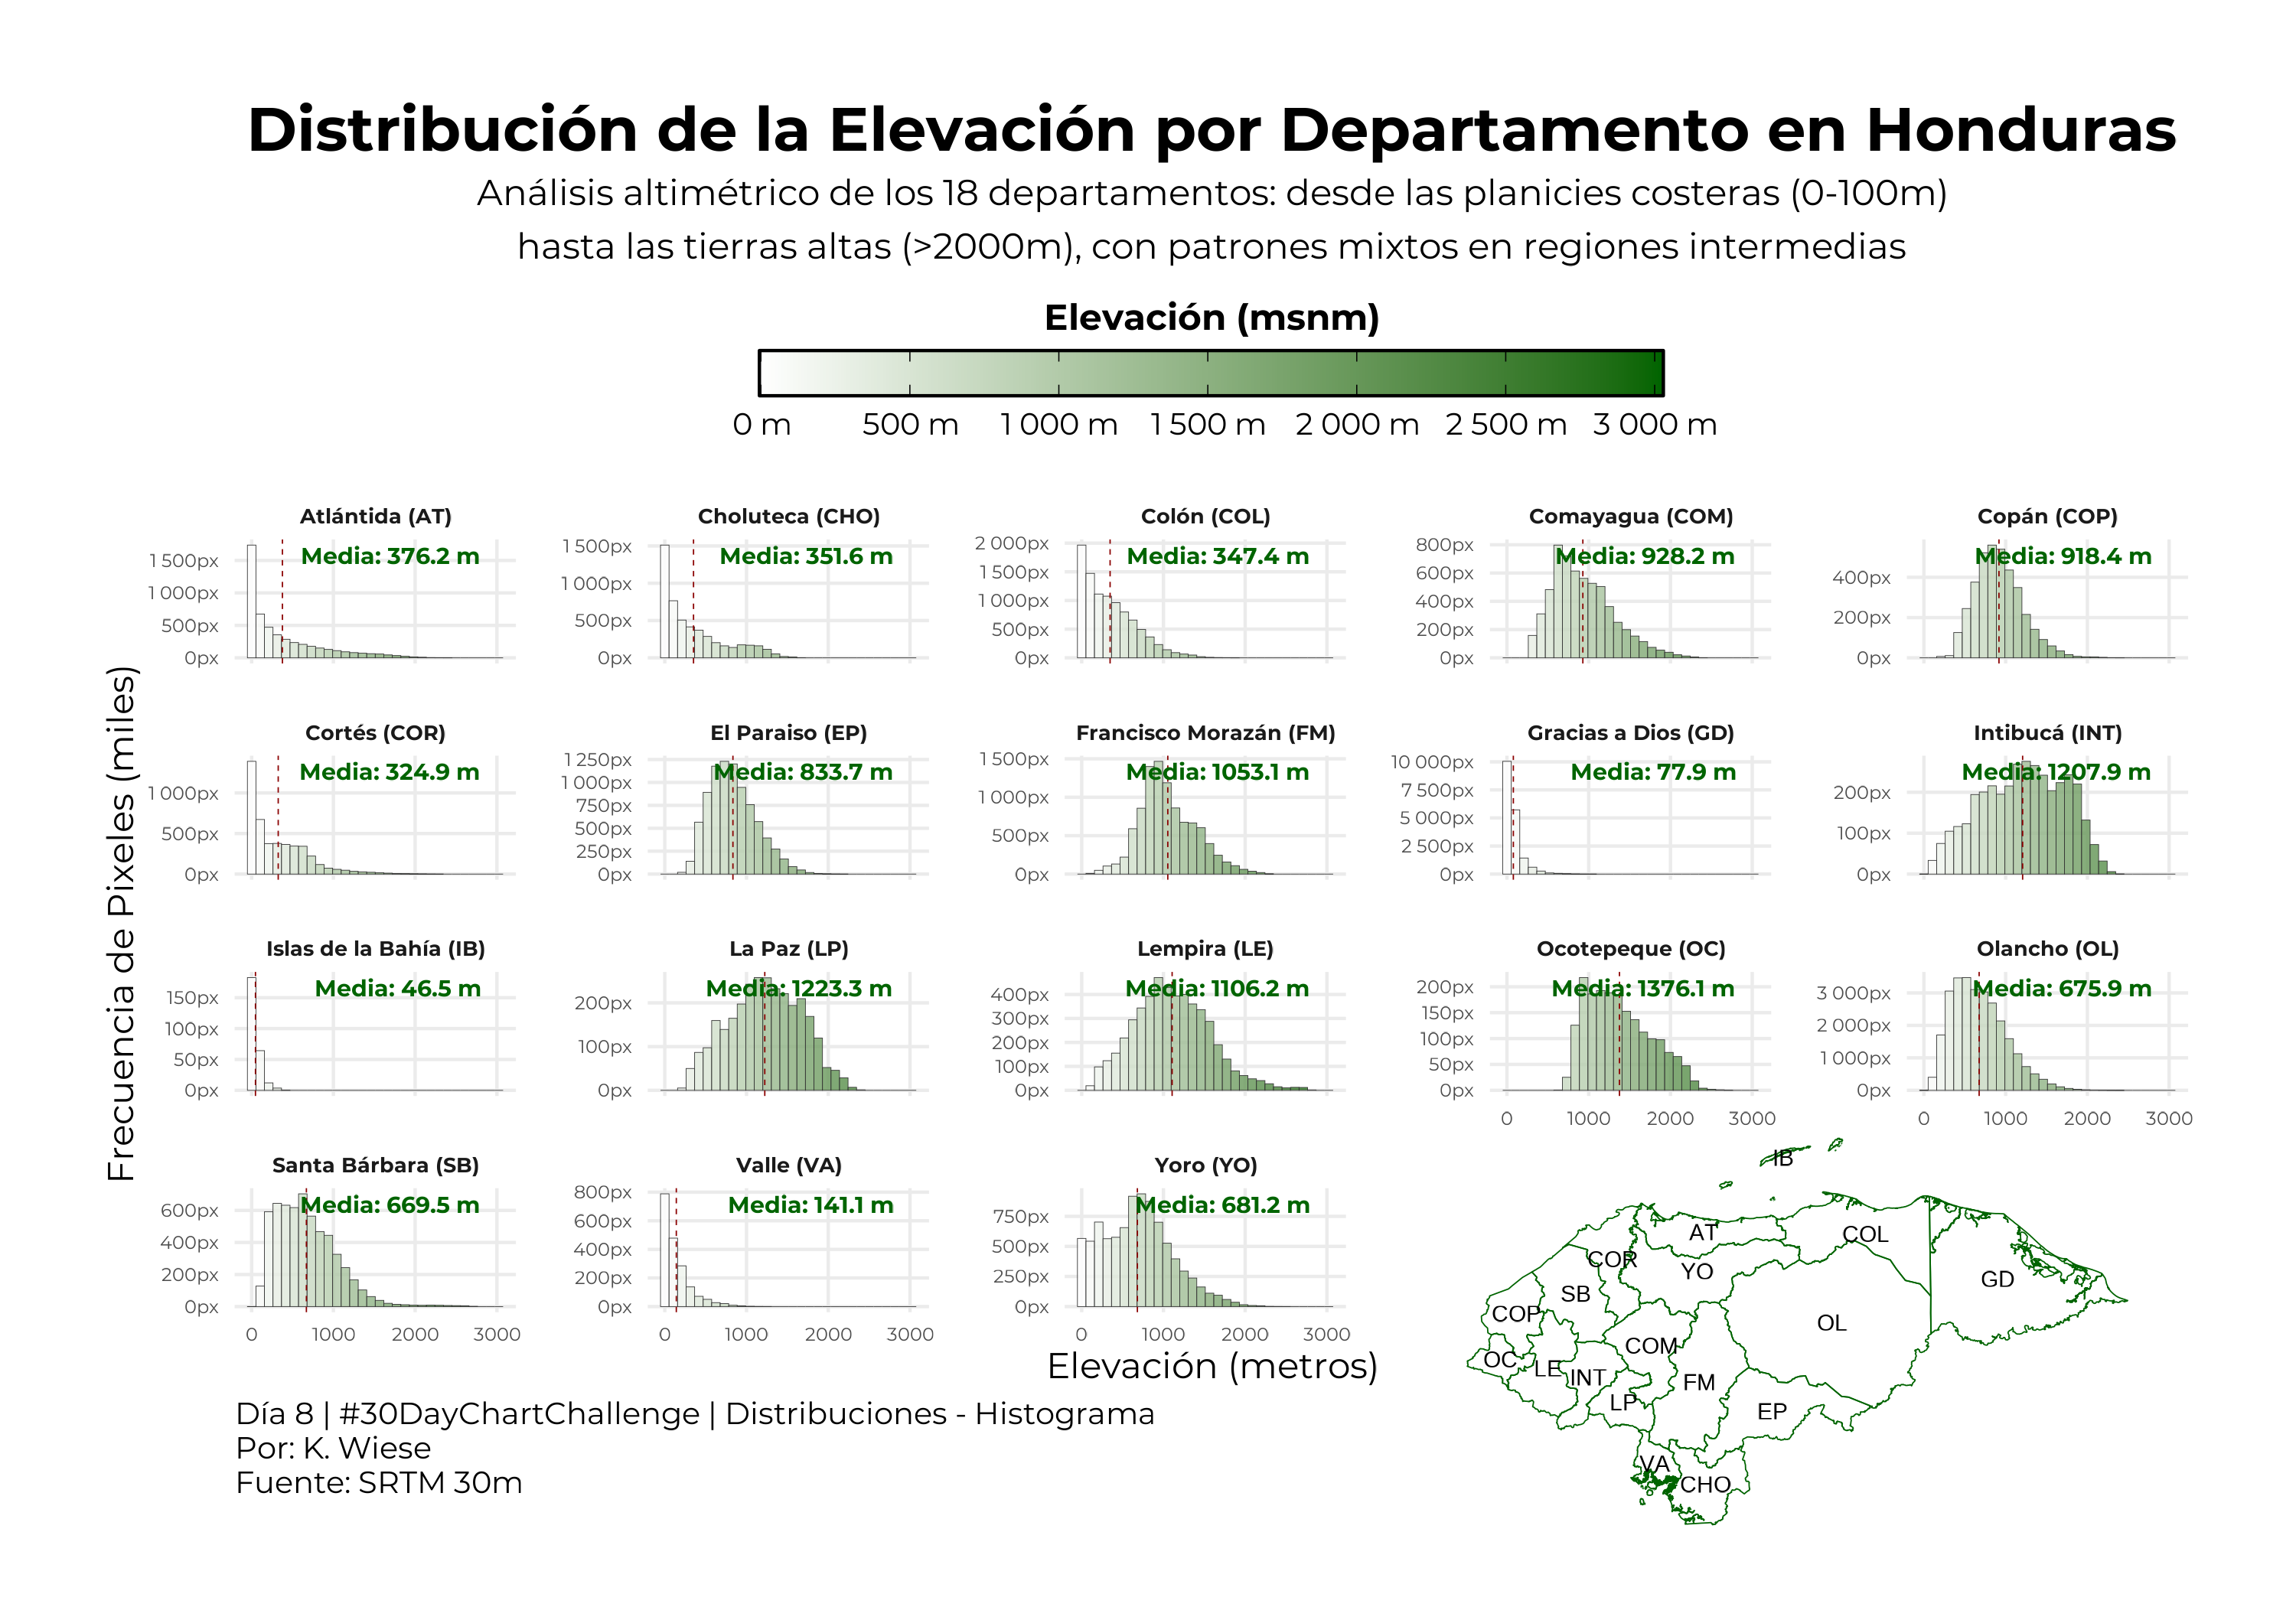
Día 8 | Distribuciones – Histograma | #30DayChartChallenge. | Visualización hecha usando R con los paquetes #ggplot2, #dplyr, #patchwork, #sf, #ggtext, #showtext, #raster, #exactextractr, #ggscale y #scales.
Client Info
Server: https://mastodon.social
Version: 2025.04
Repository: https://github.com/cyevgeniy/lmst