Scaling our observability platform by embracing wide events and replacing OTel
https://clickhouse.com/blog/scaling-observability-beyond-100pb-wide-events-replacing-otel
#ycombinator #OpenTelemetry #OTel #logging #observability
#openTelemetry
ClickHouse scales beyond 100 petabytes of logs
https://clickhouse.com/blog/scaling-observability-beyond-100pb-wide-events-replacing-otel
#ycombinator #OpenTelemetry #OTel #logging #observability
#OpenTelemetry for #GoLang: measuring the overhead
https://coroot.com/blog/opentelemetry-for-go-measuring-the-overhead/
Sending up the Bat Signal that the #OpenTelemetry project is looking for documentation help - specifically translation into Bengali, Spanish, French, Portuguese, Chinese & Japanese (with a Ukrainian translation incubating as well) #opensource
A new 🌩️ Thunder episode is live! Huzzah!
OpenTelemetry is a model for translating raw system events into highly correlated data that is useful for observability. It’s vendor-neutral, open source, and built to handle traces, metrics, logs, and more.
Watch now & learn how OpenTelemetry helps you make sense of complex systems. With guest Austin Parker!
What Is OpenTelemetry?
https://youtu.be/0WIyBbGn4fU
#OpenTelemetry #Observability #DevOps #Monitoring #CloudNative
#OTel Community Day is around the corner! Will we see you in Denver?
On June 26, join members of the #OpenTelemetry governance and technical committees, project maintainers, contributors and end users for a day of knowledge sharing, community building, and collaboration!

⚠️ Action required! ⚠️
The #CNCF Slack workspace is shifting to a free plan on Friday, June 20, 2025. Read the latest #OpenTelemetry blog post to find out what you should consider doing before then.

Good news! After some fiddling and understanding the repository layout I finally have working OpenTelemetry Collector packages for @opensuse!
Packages for the "core" or "classic" collector, the contrib distribution and the otlp distribution are working fine in my tests and have been submitted to the server:monitoring devel project. This includes the packages required to build them.
Here is a vagrant-libvirt setup to play around with the packages (three branches currently).
https://codeberg.org/johanneskastl/opentelemetry-collector_opensuse_vagrant_libvirt_ansible
https://github.com/johanneskastl/opentelemetry-collector_opensuse_vagrant_libvirt_ansible
Once I find some information on how to use the ebpf-profiler distribution, I will test that package and add a branch for it.
#openSUSE #Tumbleweed #Observability #OpenTelemetry #OpenTelemetryCollector #metrics #Ttracing #DevOps #PackagersLife #HellYeah
CI/CD Observability with #OpenTelemetry
#devops #sre #pipeline
https://signoz.io/blog/cicd-observability-with-opentelemetry/
OpenTelemetry Plugin for JetBrains Rider: Observability Inside Your IDE | by Sasha Ivanova.
buff.ly/UOm147O
#opentelemetry #visualstudio #rider #observability #dotnet #csharp
OpenTelemetry Plugin for JetBr...
OpenTelemetry Plugin for JetBrains Rider: Observability Inside Your IDE | by Sasha Ivanova.
https://blog.jetbrains.com/dotnet/2025/06/16/opentelemetry-plugin-for-jetbrains-rider/
#opentelemetry #visualstudio #rider #observability #dotnet #csharp
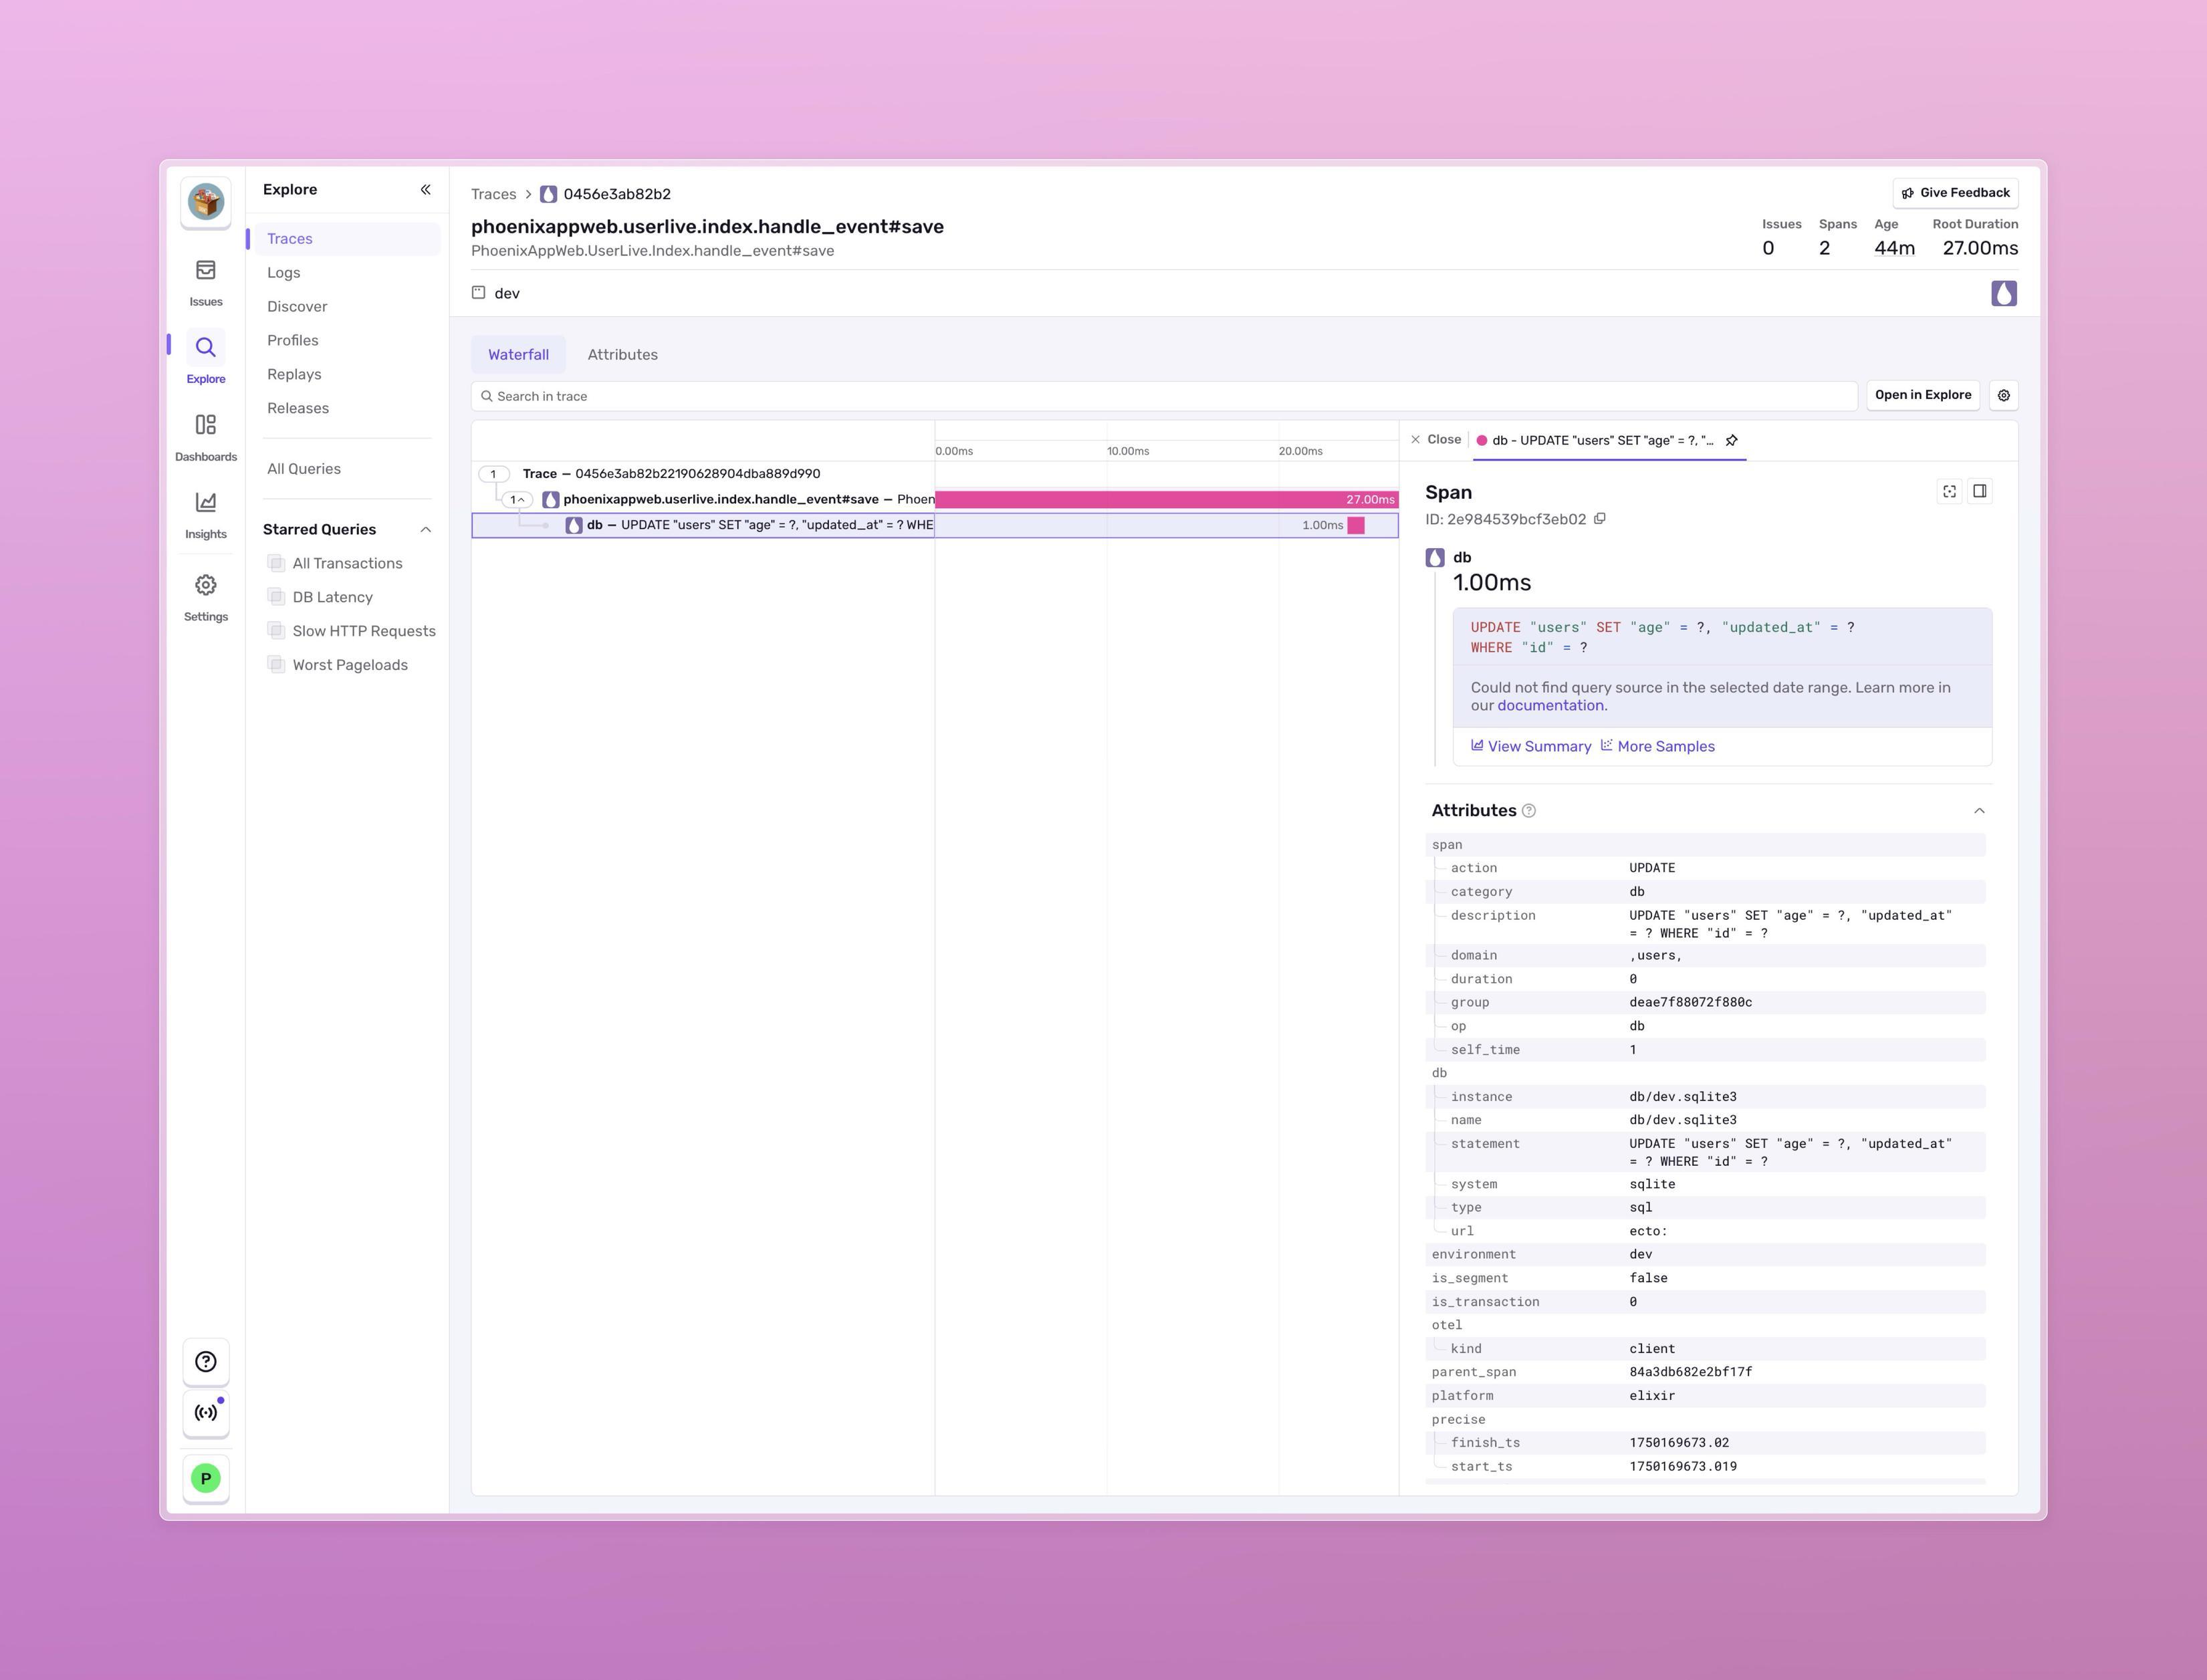
Sentry Elixir SDK 11.0.0 was just released with beta support for Tracing using #OpenTelemetry! 🎉
Please give it a go and report any issues you may find - this is early stage and feedback is much appreciated!
#ElixirLang #Observability #Monitoring #DevOps
👇🏻
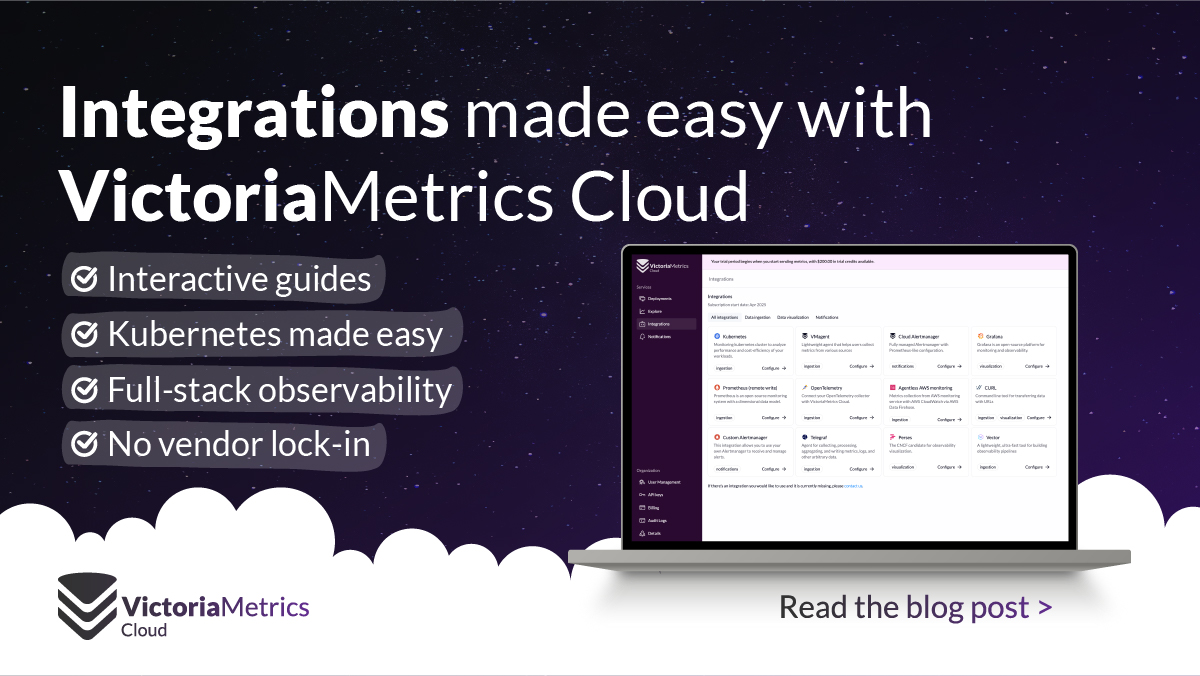
🚀 Setting up #observability with #VictoriaMetrics #Cloud is easy. It provides interactive guides and code snippets for quick integration.
💡 You can use #Kubernetes, #Prometheus, #OpenTelemetry, or AWS CloudWatch—everything needed is in the Cloud Console without extra agents. Our updated Integrations Docs help you start in just a few clicks. 🔌 Supported integrations:
✅ #AWS #CloudWatch
✅ Kubernetes (via vmagent)
✅ OpenTelemetry
✅ Prometheus
✅ #Telegraf
✅ #Vector
✅ #vmagent
Rider 2025.2 EAP 5: Reimagined Monitoring tool window and New OpenTelemetry Plugin | by Sasha Ivanova.
buff.ly/4uHf9Nx
#jetbrainsrider #dotnet #opentelemetry #rider #csharp #observability
Rider 2025.2 EAP 5: Reimagined...
Rider 2025.2 EAP 5: Reimagined Monitoring tool window and New OpenTelemetry Plugin | by Sasha Ivanova.
https://blog.jetbrains.com/dotnet/2025/06/16/rider-eap-5-new-monitoring-tool-opentelemetry-plugin/
#jetbrainsrider #dotnet #opentelemetry #rider #csharp #observability
Hey everyone, how are you testing #OpenTelemetry logging and tracing in your CI/CD pipelines?
Are you using ephemeral #Jaeger or #Tempo deployments, something more lightweight maybe?
🌕 Go 語言 OpenTelemetry 效能測量:架設成本評估
➤ 瞭解 OpenTelemetry 對 Go 應用程式效能的影響
✤ https://coroot.com/blog/opentelemetry-for-go-measuring-the-overhead/
本文探討了在 Go 應用程式中使用 OpenTelemetry 引入的效能成本。作者透過一個簡單的 HTTP 伺服器,在有和無 OpenTelemetry SDK 的情況下進行基準測試,比較了 CPU 使用率、記憶體消耗、延遲和網路流量等指標。測試結果顯示,啟用 OpenTelemetry 後,CPU 使用率增加了約 35%,記憶體使用率略有增加,而延遲也略微上升。然而,吞吐量保持穩定。作者利用 Coroot 的 eBPF CPU 分析器發現,CPU 成本主要來自 OpenTelemetry 的 span 處理管道,而非應用程式的核心邏輯。
+ 這篇文章很實用,讓我更瞭解 OpenTelemetry 的實際效能成本,在導入時可以更謹慎評估。
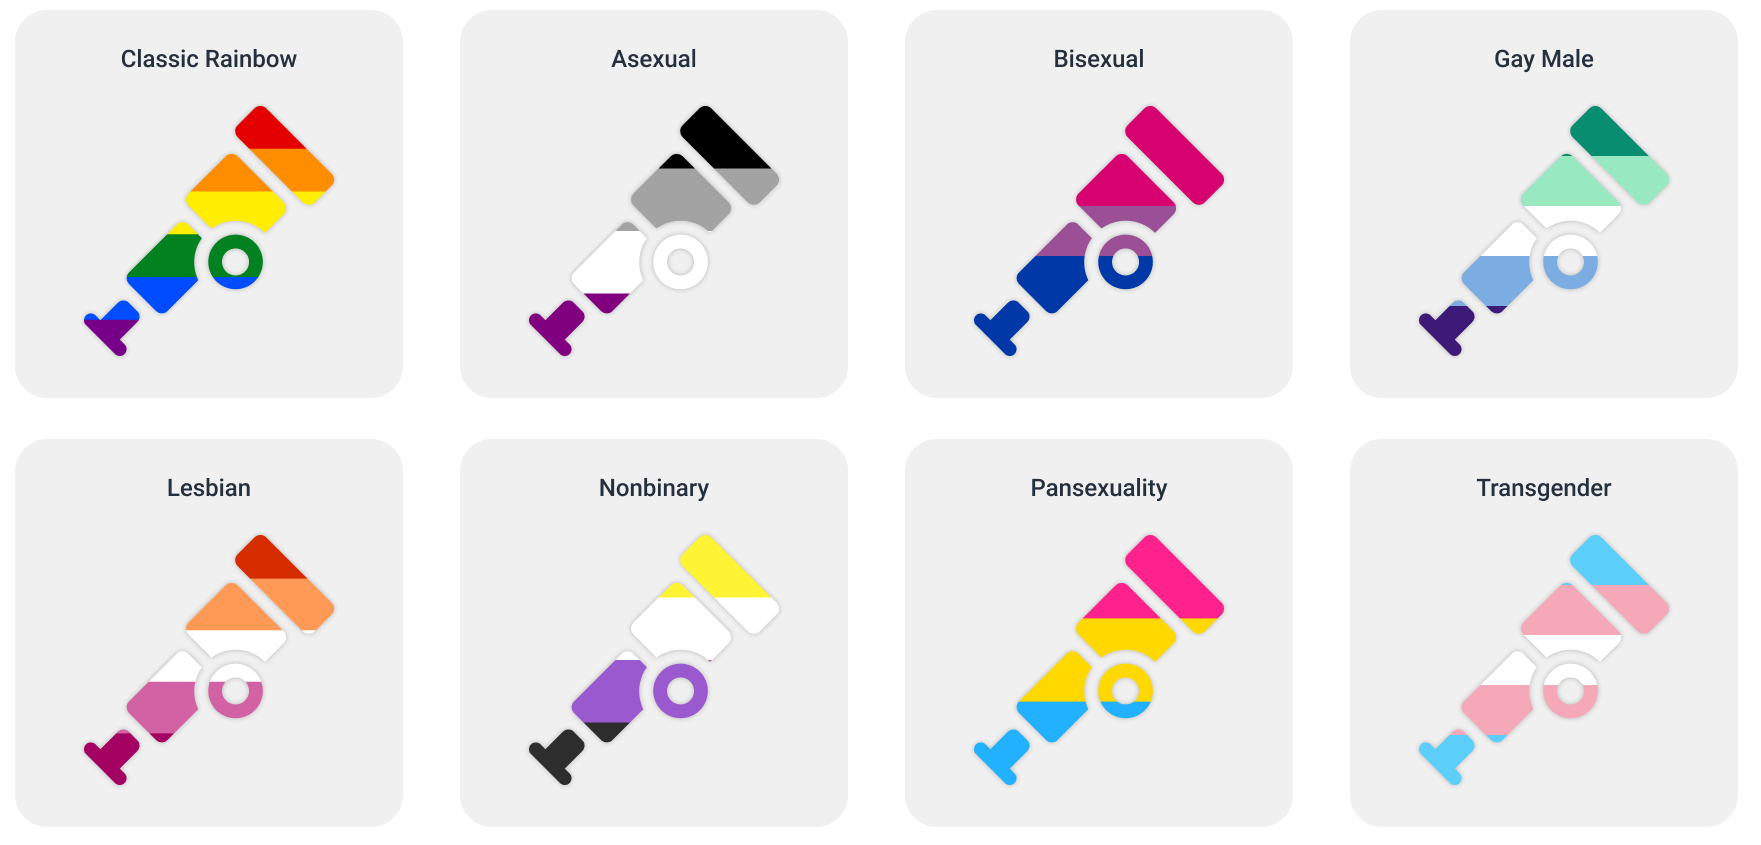
#OpenTelemetry is celebrating #Pride Month!
Download, use, and share our new logos! Happy Pride!
I recently found Signoz. It's amazing ❤️ It uses less RAM for than jaeger (Probably Elasticsearch vs Clickhouse), and the UI is far more flexible.
🚀 Oh joy, yet another deep dive into the exhilarating world of OpenTelemetry—for Go! Because who doesn't want to measure overhead in the most thrillingly mundane way possible? 😴 Spoiler alert: adding #observability costs time, money, and brain cells, but at least you get to feel like a ✨pro✨ while doing it!
https://coroot.com/blog/opentelemetry-for-go-measuring-the-overhead/ #OpenTelemetry #Go #MeasuringOverhead #DevLife #TechHumor #HackerNews #ngated
Client Info
Server: https://mastodon.social
Version: 2025.04
Repository: https://github.com/cyevgeniy/lmst