Examples of creative data visualizations, mostly ggplot: https://github.com/tashapiro/tanya-data-viz #ggplot #dataviz #rstats
#ggplot
#statstab #350 Communicating causal effect heterogeneity
By @matti
Thoughts: Cool guide on properly communicating uncertainty in effects.
#bayesian #uncertainty #ggplot #r #brms #tidybayes #heterogeneity
If you set limits for a scale (e.g. x-axis) in ggplot, how would you like data outside of that range be handled? There is the oob parameter for that and a set of functions to use with it: https://scales.r-lib.org/reference/oob.html #rstats #ggplot #dataviz
Add some swag to your ggplots, with fontawesome symbols and colors: https://nrennie.rbind.io/blog/adding-social-media-icons-ggplot2/ #rstats #ggplot #fontawesome #ggtext
You dont like the default color palett of #ggplot? You can change it: https://stackoverflow.com/questions/10504724/change-the-default-colour-palette-in-ggplot #rstats #dataviz
{ggchicklet}: library for rounded Segmented Column Charts: https://github.com/hrbrmstr/ggchicklet #ggplot #rstats #dataviz @hrbrmstr
r-graph-gallery.com provides example code for a variety of chart types, both in base R and ggplot: https://r-graph-gallery.com/ #rstats #ggplot #design
Add richer tooltips to ggiraph with kableExtra and friends: https://uncharteddata.netlify.app/posts/2022-09-30-interactive-tooltip-tables/ #dataviz #ggplot #ggiraph #UI
Enrich your ggplots with extra panels along the x and y axis: https://github.com/jtlandis/ggside #ggplot #dataviz #rstats
Using fonts in R graphics can be tricky at times. {showtext} aims to make it easier: https://cran.rstudio.com/web/packages/showtext/vignettes/introduction.html #rstats #dataviz #ggplot
Find the best contrast between one color and a list of options, e.g. for labels in geom_tile: {prismatic::best_contrast()} https://emilhvitfeldt.github.io/prismatic/reference/best_contrast.html #rstats #dataviz #ggplot #colors
#dataviz #rstats
A new release, v. 1.7.4 of my {heplots} pkg just dropped to CRAN. It features a new utility `noteworthy(x,y,method)` to identify
unusual points in a 2D plot, by a variety of criteria. Working on a `stat_noteworthy()` to bring this to #ggplot,
labeling those points.
http://friendly.github.io/heplots/
I did not know about ggplot_build() before. It can come in handy in situations where you want to access computed metrics of a #ggplot. https://ggplot2.tidyverse.org/reference/ggplot_build.html. Thanks @thedatainklab for sharing. #rstats #ci
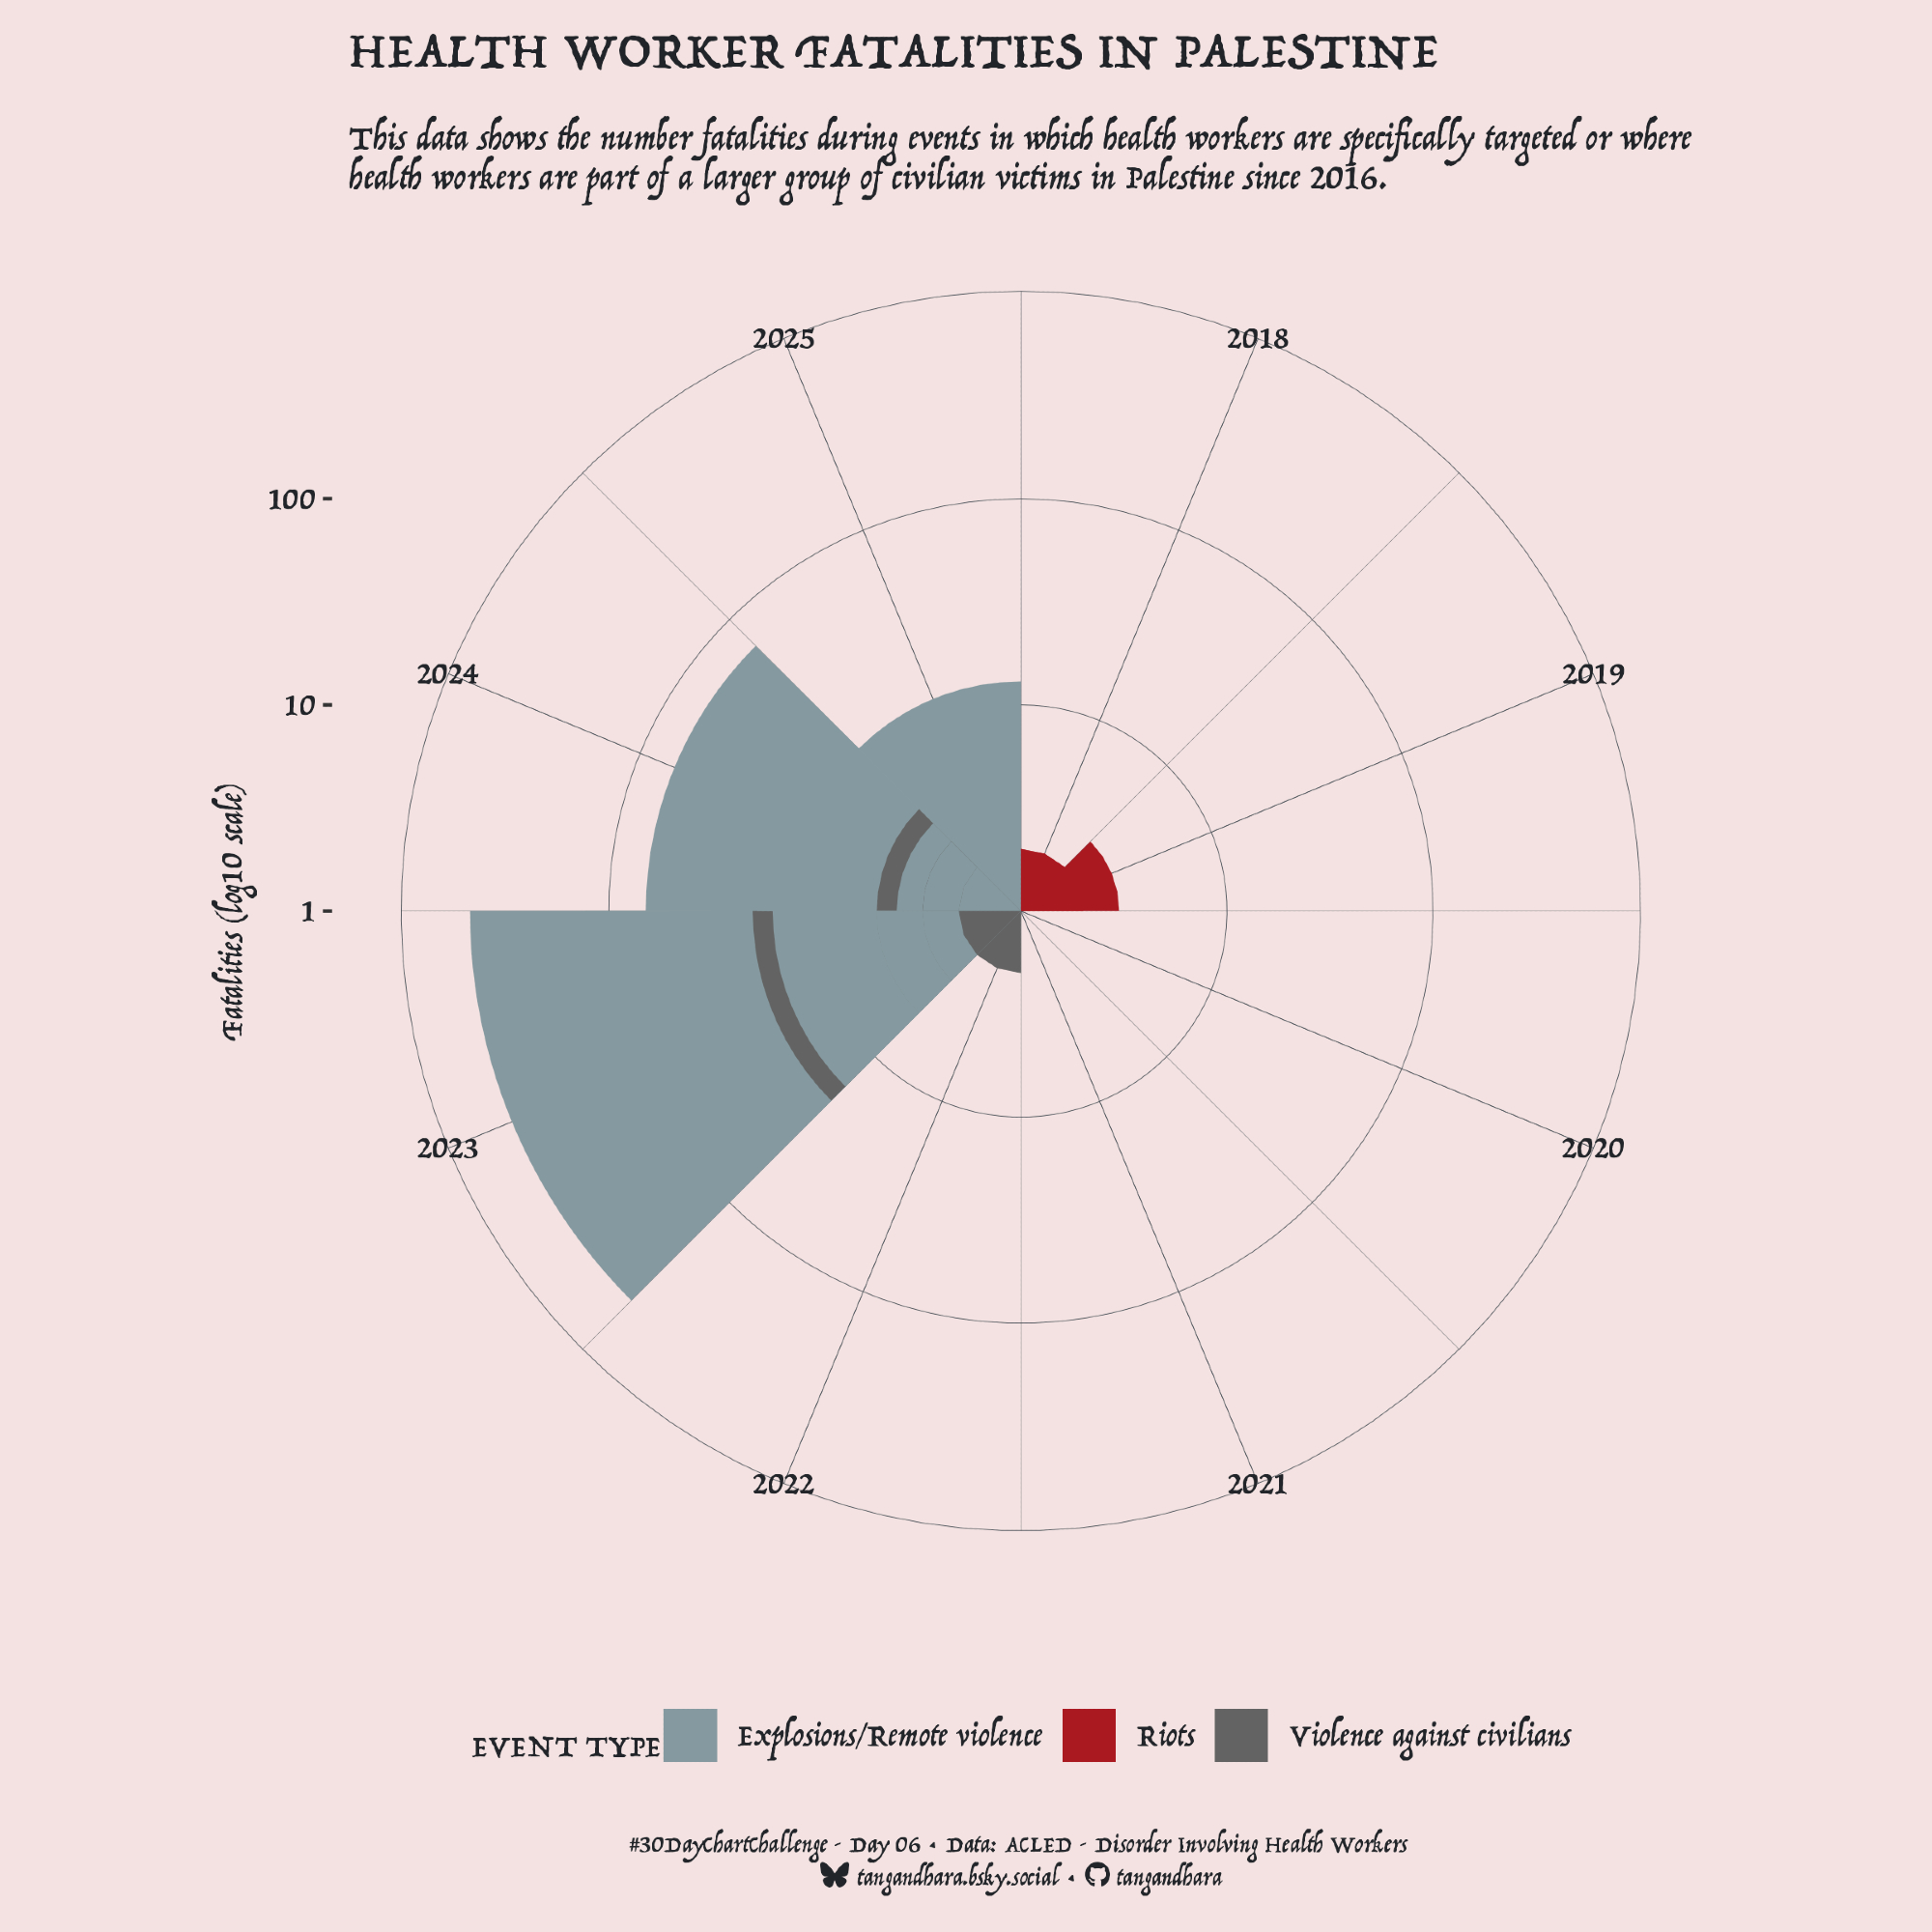
#30DayChartChallenge - Day 6: Florence Nightingale theme Using ACLED data, here's a look at fatalities (log10 scaled) of health workers in Palestine during events where they are specifically targeted or are part of a larger group of civilian victims. #rstats #dataviz #ggplot
Jazz up your ggplots:
‘Useful tricks to elevate your data viz via `ggplot` extension packages in R”
Custom themes, fonts, annotations, arrows & more
By the USGS
https://waterdata.usgs.gov/blog/ggplot-jazz/
#RStats #ggplot2 #ggplot #Dataviz
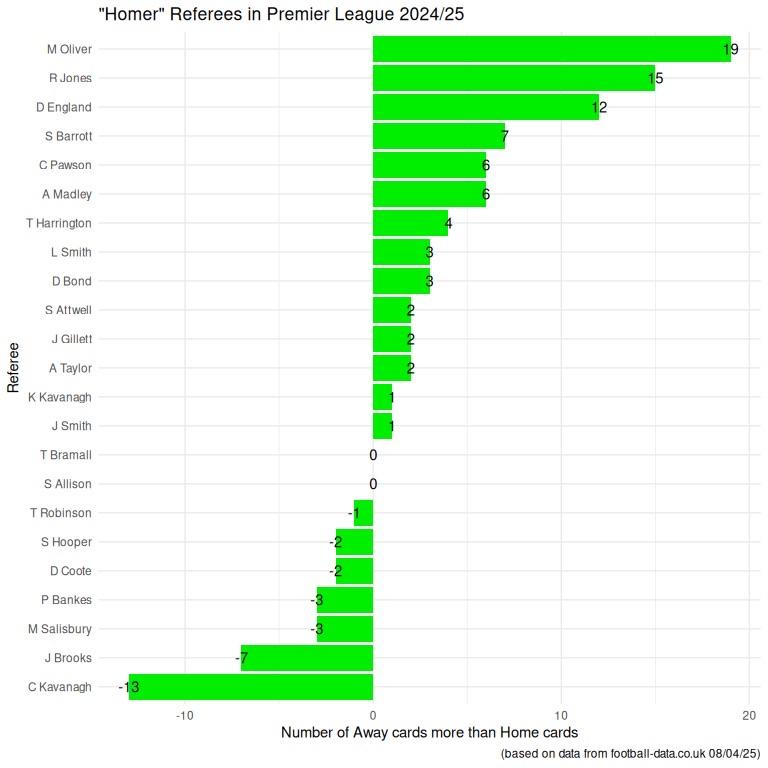
first #rstats code - a #ggplot bar chart showing “homer” referees in the premier league this season, based on the number of red and yellow cards given to home and away teams.
Listen, #ggplot: Iove you, I do. But 90% of the time when I want to set fill or color manually I don't want to have to look up and figure out an entire fucking palette of colors. I want 2 or 3 colors, the end. I want to specify them easily.
#ItsNotYouItsMe I realize this
I just want firebrick and navy. That's all. It always takes me 10 minutes of searching to remember that scale_color_manual exists; I always end up seeing pages for scale_color_discrete first.
r-charts.com provides example code for a variety of chart types, both in base R and ggplot: https://r-charts.com/ #rstats #ggplot #design
The truly important reason to try the #positron R/Python editor is that it can work in parallel with another R session open in #RStudio for a different project...
Also amazed by the #Pluto notebook for #Julia scientific work. One of its nice features is that the associated file is in text format and the code can be easily extracted. Not yet ready to switch from #ggplot to #VegaLite though.
https://positron.posit.co/start.html
https://plutojl.org/
#rstat
Client Info
Server: https://mastodon.social
Version: 2025.04
Repository: https://github.com/cyevgeniy/lmst