TabPFN-2.5 – SOTA foundation model for tabular data
https://priorlabs.ai/technical-reports/tabpfn-2-5-model-report
#HackerNews #TabPFN2.5 #SOTA #TabularData #FoundationModel #AIResearch
TabPFN-2.5 – SOTA foundation model for tabular data
https://priorlabs.ai/technical-reports/tabpfn-2-5-model-report
#HackerNews #TabPFN2.5 #SOTA #TabularData #FoundationModel #AIResearch
🚨 Breaking news: Java developers discover Pandas rip-off with a name that sounds like a cheap gym 💪. #Fahmatrix promises to make tabular data “fahm” easy, but let's be real—it's just another way to make Java developers wish they had chosen Python instead 🐍.
https://github.com/moustafa-nasr/fahmatrix #JavaDevelopers #PandasRipOff #TabularData #PythonVsJava #HackerNews #ngated
⭐️ What you’ll learn ⭐️
✅ Detecting and fixing errors in tables
• Learn to work with #tabulardata
• Don’t get lost when validating your spreadsheet
• Clean up your spreadsheets to gain valuable insights
👉🏾 More: https://buff.ly/9XVJxq4
🧵

Design patterns for presenting and manipulating tabular data.
"Datatable Design Patterns"
https://bootcamp.uxdesign.cc/data-table-design-patterns-4e38188a0981
⭐️ What you’ll learn ⭐️
✅ Detecting and fixing errors in tables
• Learn to work with #tabulardata
• Don’t get lost when validating your spreadsheet
• Clean up your spreadsheets to gain valuable insights
🧵

OK this still need some ironing but... in #LeagueCSV 9.22.0 a new interface is added `TabularData` which enables the following magic 😍 #PHP #interoperability #extension #tabulardata for more information and limitations check the documentation https://csv.thephpleague.com/9.0/reader/resultset/#instantiation
When you're dealing with small datasets, Tablib is all you need. Eirik Berge, PhD explains everything you need to know about Tablib in his latest article. Read now!
https://towardsdatascience.com/use-tablib-to-handle-simple-tabular-data-in-python-fa9e6f0af37f
#Design #Challenges
Invisible success · Showcasing a well-designed, accessible table component https://ilo.im/15yldl
_____
#Table #TabularData #Accessibility #Component #DesignSystem #UiDesign #WebDesign #Development #WebDev #Frontend
The Design Philosophy of Great Tables
https://posit-dev.github.io/great-tables/blog/design-philosophy/
#Design #Guides
The design philosophy of great tables · Principles and guidelines for designing impactful tables https://ilo.im/15yhdj
_____
#Table #TabularData #DesignPattern #ProductDesign #UxDesign #UiDesign #WebDesign #Development #WebDev #Python
I ran a quick Gradient Boosted Trees vs Neural Nets check using scikit-learn's dev branch which makes it more convenient to work with tabular datasets with mixed numerical and categorical features data (e.g. the Adult Census dataset).
Let's start with the GBRT model. It's now possible to reproduce the SOTA number of this dataset in a few lines of code 2 s (CV included) on my laptop.
1/n
#sklearn #PyData #MachineLearning #TabularData #GradientBoosting #DeepLearning #Python

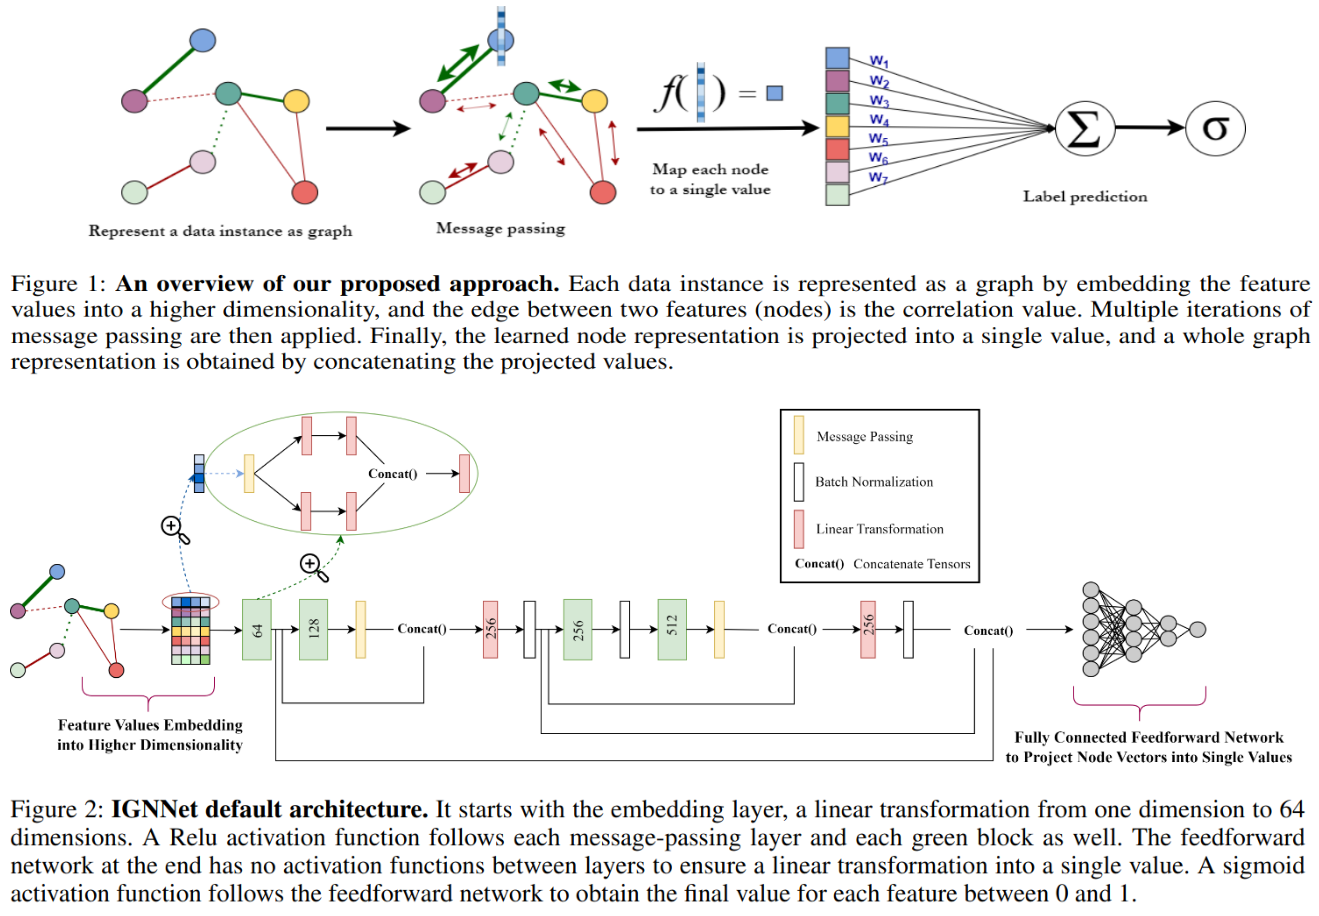
Interpretable Graph Neural Networks for Tabular Data
https://arxiv.org/abs/2308.08945
Discussion: https://news.ycombinator.com/item?id=37269376
* GNN essentially deep NN black-box models
* IGNNet: Interpretable Graph Neural Network for tab data
* notable HN comment, resp. to critique: " Right, the significance of orig. article & related research is ChatGPT-like models don't handle tabular data well & there's need for things that do"
#DataProcessing #GraphNeuralNetworks #GNN #TabularData #GPT #LLM #IGNNet
#Development #Techniques
Tabular numbers · Number alignment with an underrated CSS property https://ilo.im/14qchr
_____
#WebDev #Frontend #CSS #NumberAlignment #TabularData #MovingNumbers #Readability
The Wildland Fire Trends Tool (WFTT) is a #datavisualization and analysis tool that calculates and displays #wildfire #trends and #patterns for the western U.S. based on user-defined regions of interest, time periods, and ecosystem types. Users can use the tool to easily generate a variety of #maps, #graphs, and #tabulardata products that are informative for all levels of expertise. https://www.usgs.gov/centers/forest-and-rangeland-ecosystem-science-center/science/wildland-fire-trends-tool
Our #DataPackage 📦 intro #jsNotebooks 📚 on Observable for #tabularData loading/meta/info & display:
https://observablehq.com/collection/@randomfractals/datapackage
More info and some ported and runnable Observable notebooks in #VSCode and #QuartoPub with #QuartoPreview in our github repo:
https://github.com/RandomFractals/observable-data-tools
#dataNotebooks / #dataTools 🛠️ ...

The Italian #OpenData portal http://dati.gov.it has a new functionality to better visualise #TabularData.
Check it out 👀📈!
@DatiGovIT
RT @DatiGovIT: 📰 Nuove funzionalità disponibili su https://dati.gov.it/ per la visualizzazione degli #OpenData in formato tabellare.
Per saperne di più leggi la news 👇https://dati.gov.it/notizie/datigovit-nuova-funzionalita-la-visualizzazione-dei-dati
🐦🔗: https://nitter.eu/EU_opendata/status/1573960500408627200