@rempsyc
No no, the plot type itself is totally fine. I'm just confused that you invoke plot() and get something that I would expect from #tinyplot or ggplot2.
#tinyplot
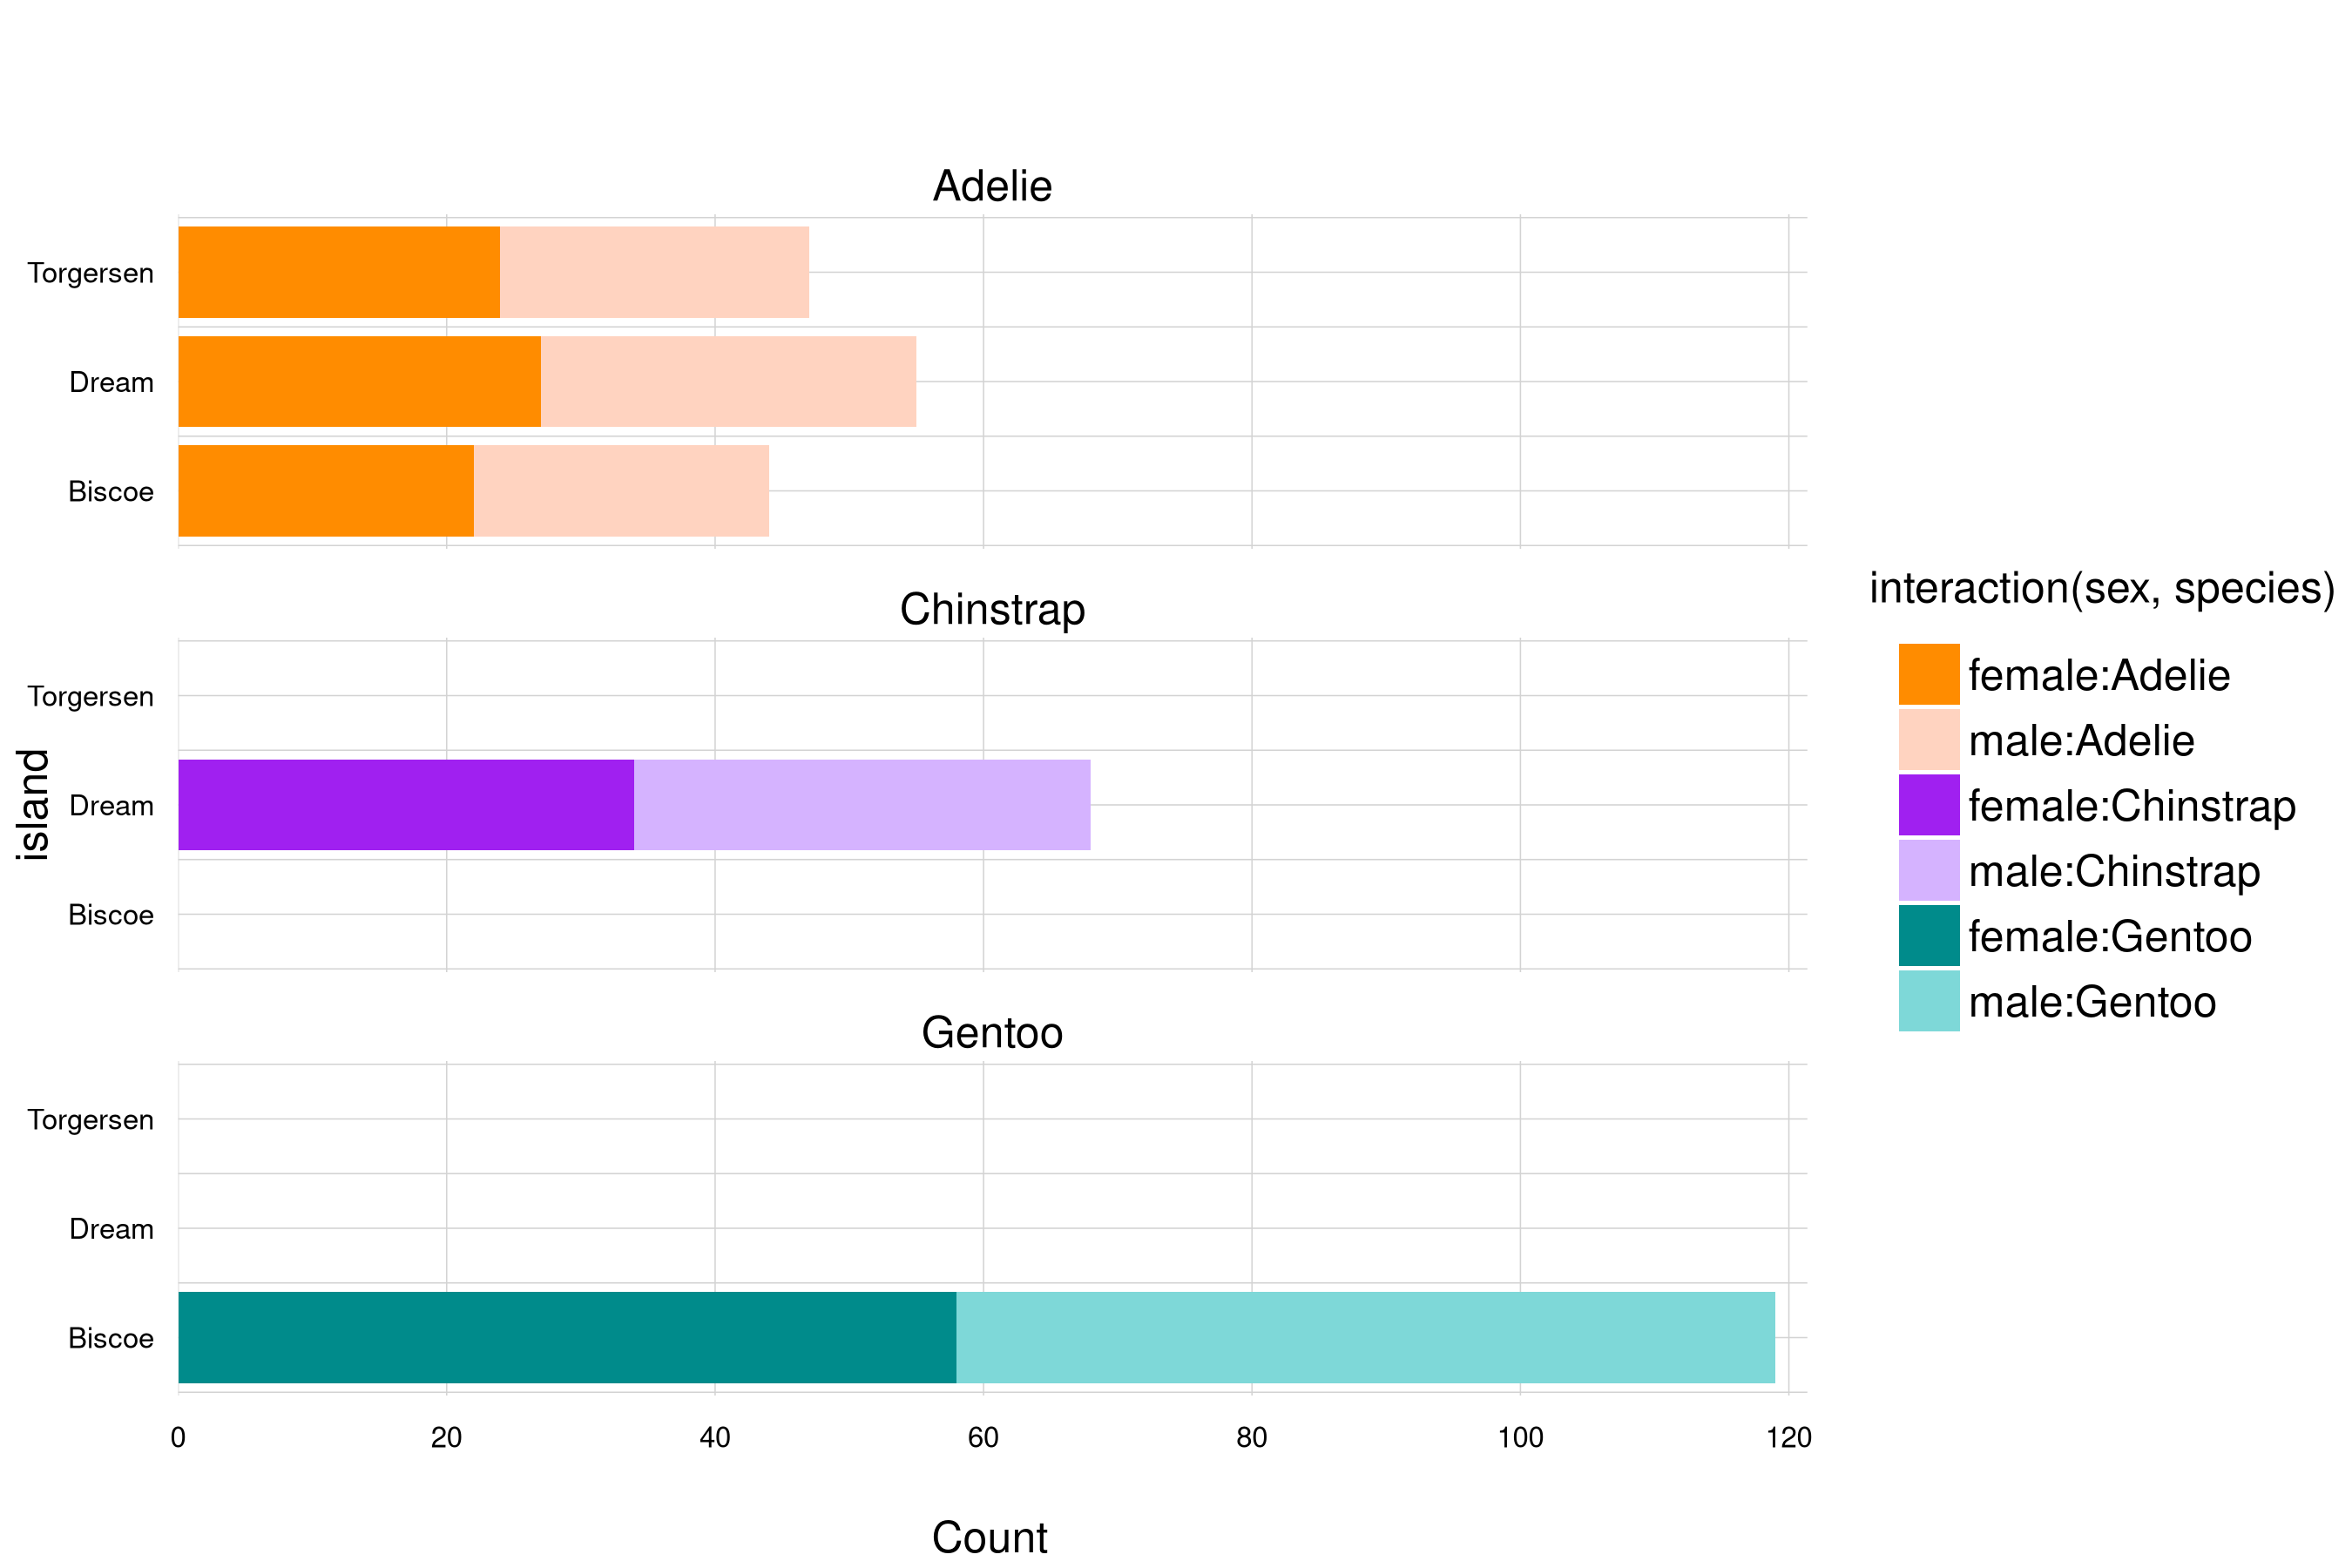
🚨 The #tinyplot pkg for #rstats #dataviz now also has support for barplots (in the R-universe version).
Grouping and faceting can be done using tinyplot's formula-based syntax.
Example: Frequencies of penguin species by island, stacked by sex. (Code in alt text).
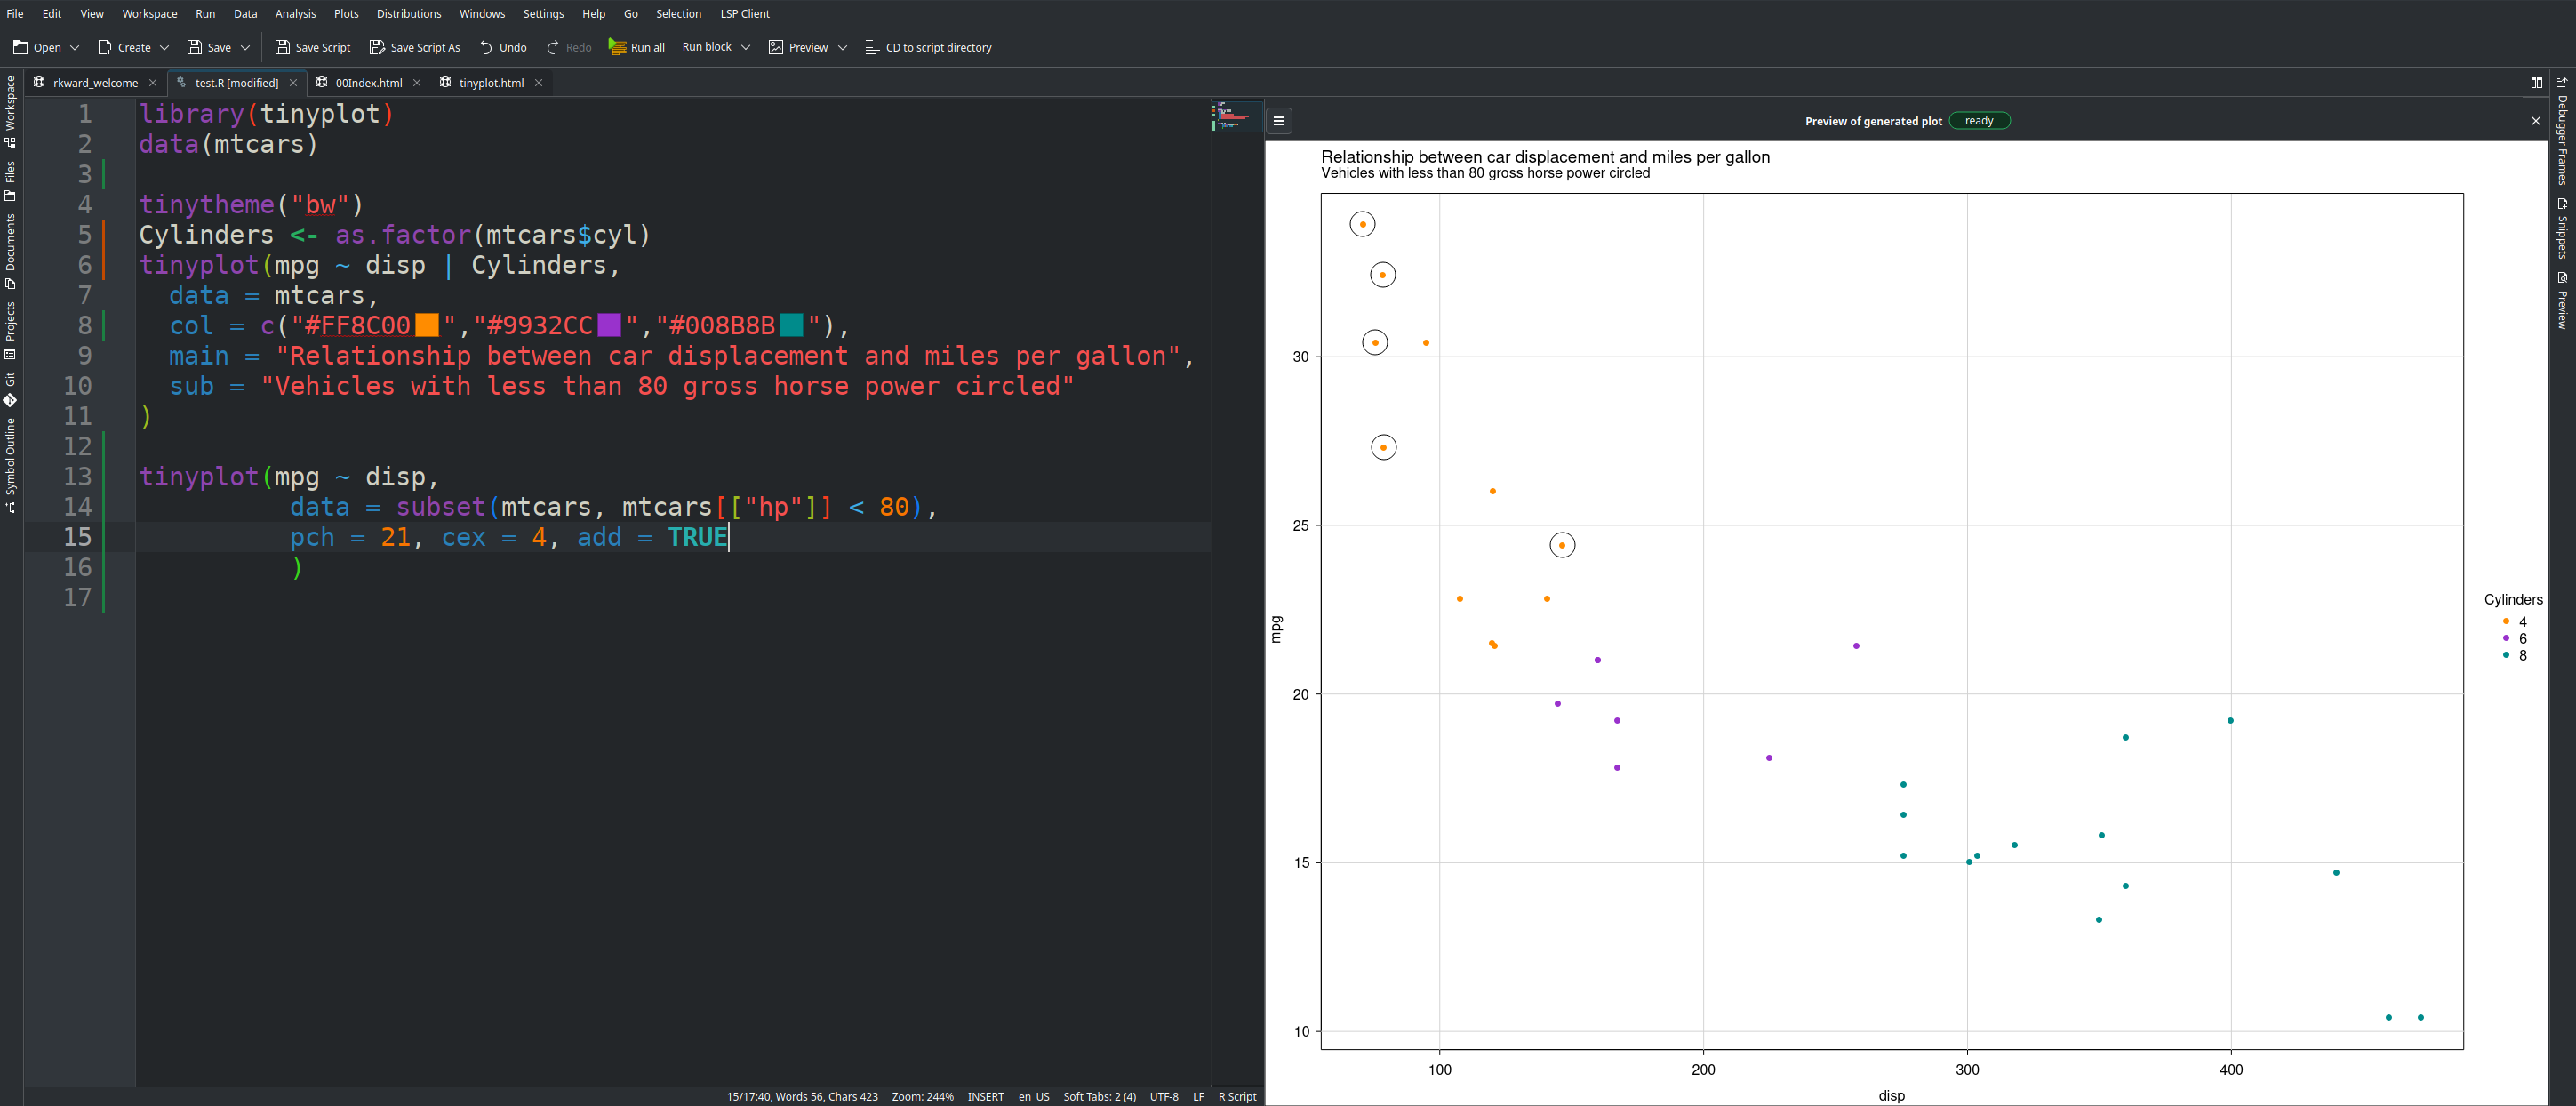
@lwpembleton I just came across your post. I took it as inspiration to achieve sth similar with base #Rstats and #tinyplot
There is one small issue that I could not solve instantly with the Cylinder as a factor. Therefore, this `Cylinders <- as.factor(mtcars$cyl)` hack. Maybe @gmcd or @zeileis has a quick suggestion?
Gráficos feitos com #RStats, usando #RDataTable para ler e tabular os dados, e #TinyPlot (@gmcd) para plotar
#rdatatable is a pleasure to work with. Sometimes mind bending (why does it not work? 🤔 … ahh, lists 🤦♂️)
but most of the time great.
I use it in combination with #tinyplot. I had situations where my code got faster and shorter by doing this.
Enjoy
# objetivo: Actualizar script en el tinyverso
# contexto: Gráfico millas en función del peso por cilindro
# entrada : mtcars
# plot : Con leyenda sin esfuerzo
# - leyenda continua ?
#tinyplot #rstats #Lecheria #ANZ #anzoátegui #CostaRica #tinyverso #baseR #Palette
Christmal special for the R base plot folks:
take a look at the latest #tinyplot developments.
@gmcd et al. have a nice tool for you.
install.packages("tinyplot", repos = "https://grantmcdermott.r-universe.dev")
#tinyverse starter pack
|> pipeOp {base}
#tinyplot https://doi.org/10.32614/CRAN.package.tinyplot
#rdatatable https://doi.org/10.32614/CRAN.package.data.table
#poorman https://doi.org/10.32614/CRAN.package.poorman
What did I forget?
Hi #rstats
Can anybody point me to good base R plot resources (templates, tutorials …) please?
Something like #tinyplot and Zeileis & Murrell, "Coloring in R's Blind Spot", The R Journal, 2023 https://doi.org/10.32614/RJ-2023-071
Starting with #RMarkdown is a great way to introduce students to the world of #rstats. It's not just about teaching programming skills, but also about explaining other technologies like #LaTeX, #YAML, #Rnw, #markdown & #Rscript! 💻 And I'm convinced that we should focus on building a small solid foundation (#smallR 🙂 ). Think of base R (aggregate, subset, …), #rdatatable and graphics (#tinyplot) instead of diving straight into popular packages like #tidyverse. Let's keep it simple! Who's with me?
Client Info
Server: https://mastodon.social
Version: 2025.04
Repository: https://github.com/cyevgeniy/lmst