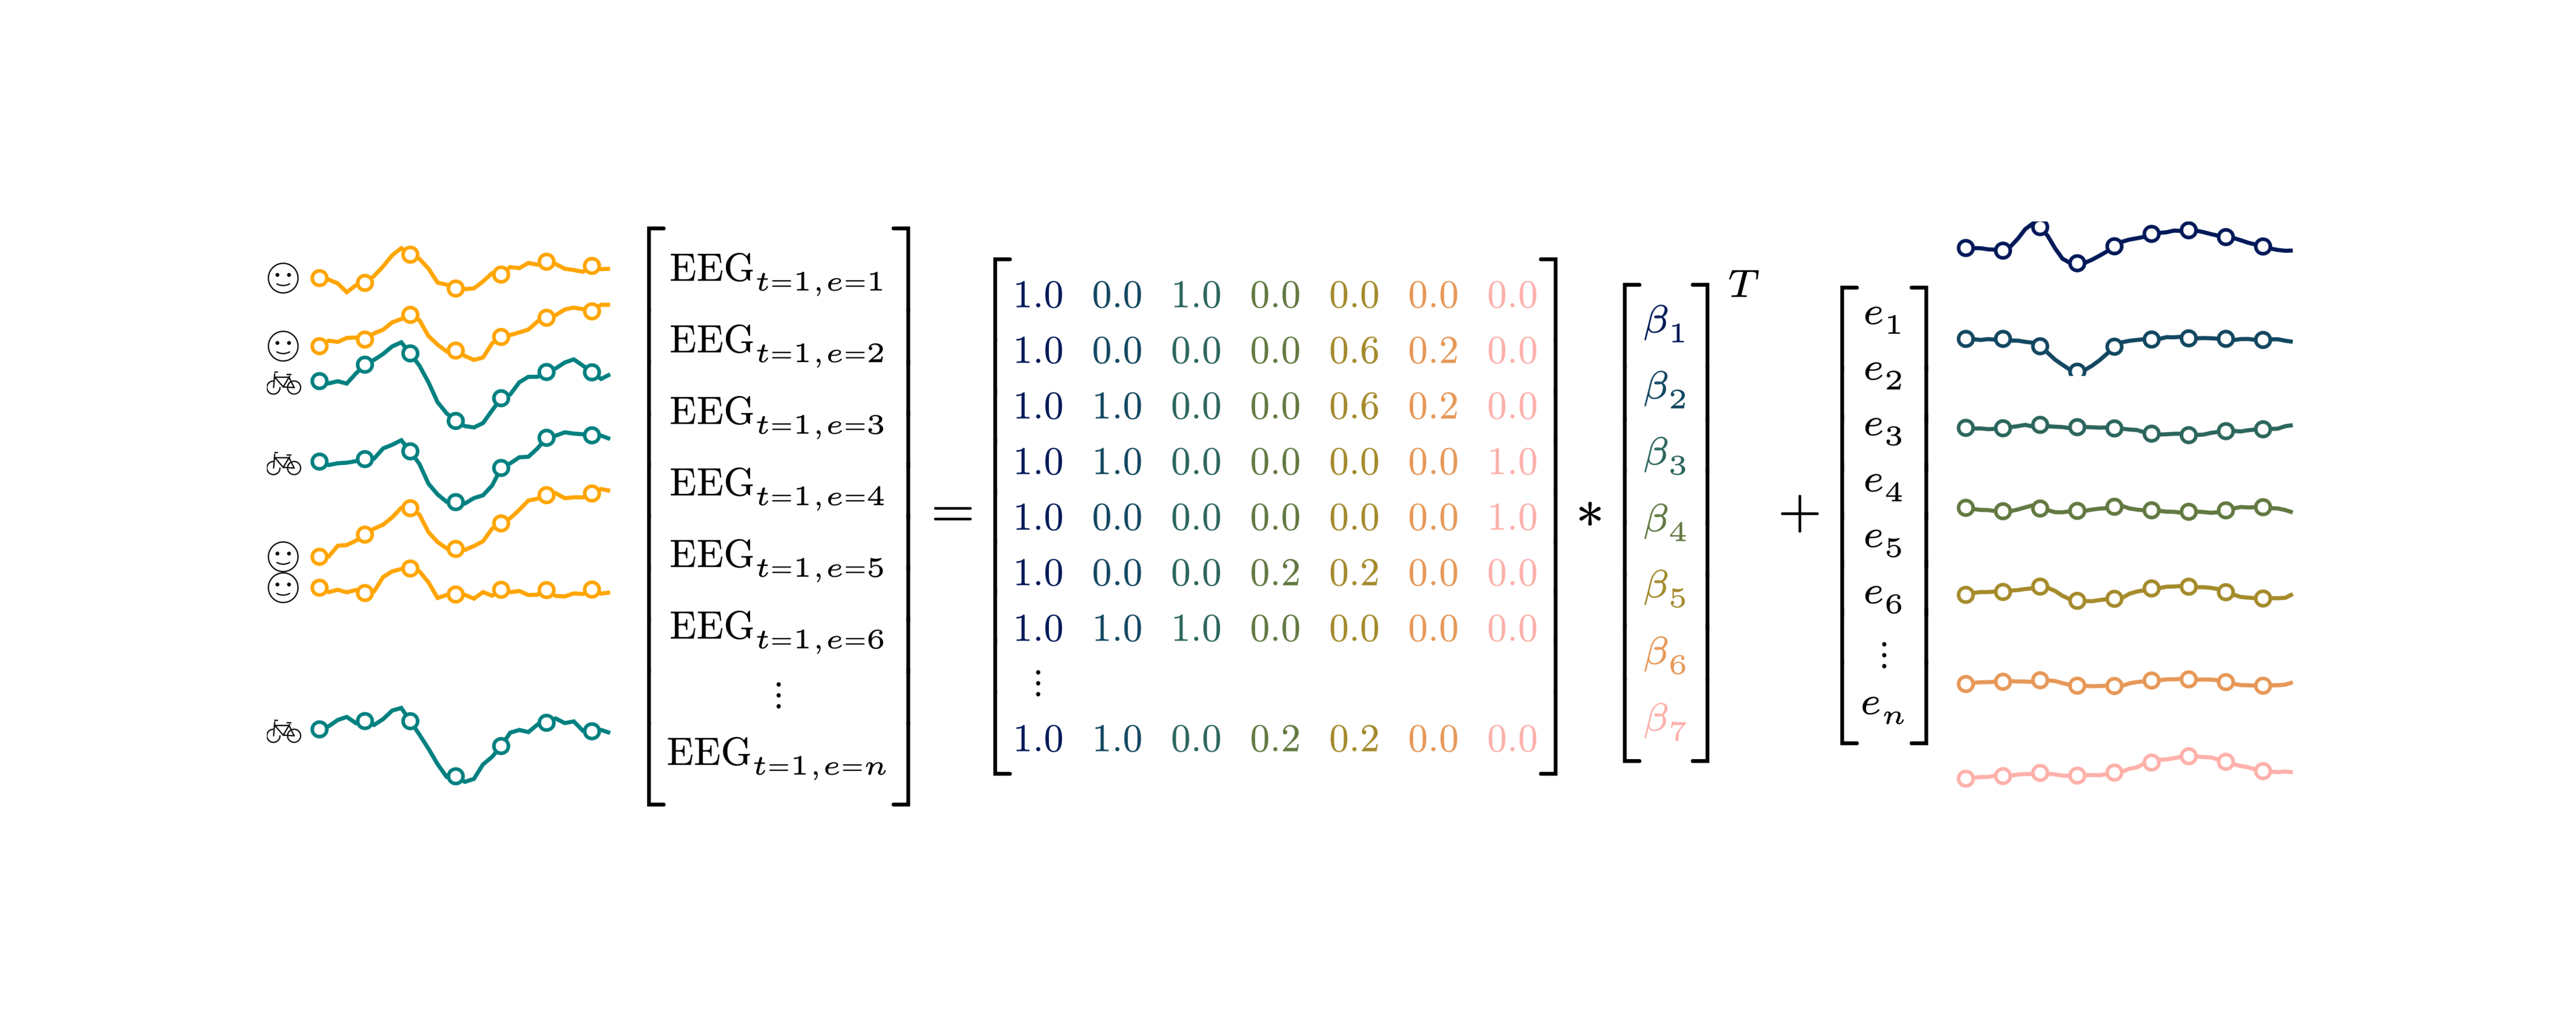
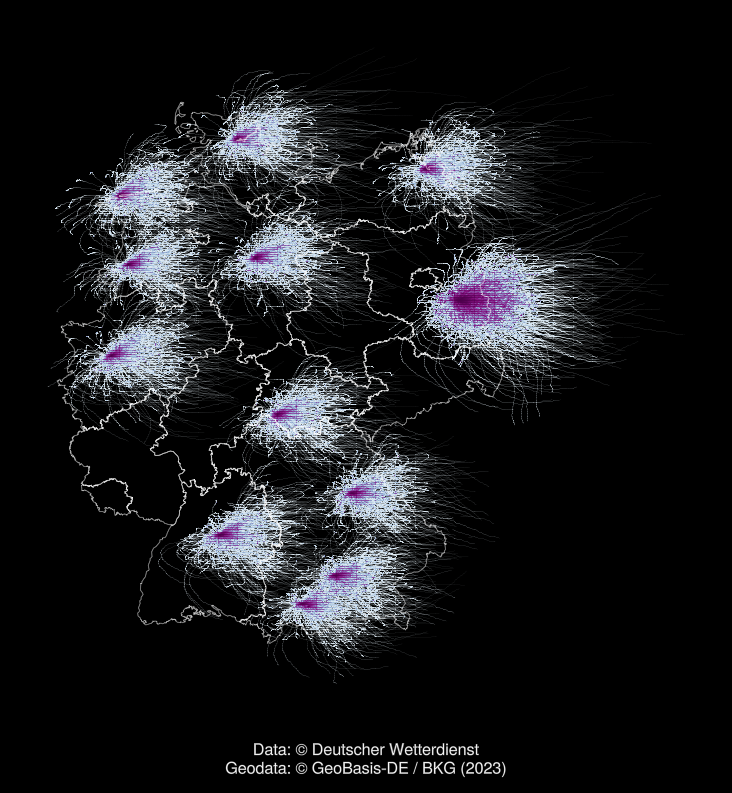
I'd never expected that it would be actually easy to programmatically generate a vector-plot like this: combining #typst / #latex with actual data plotting
@makie #visualization #julialang
Edit: I had a small mistake in coloring
Edit2: pluto-gist for simplified plot: https://gist.github.com/behinger/f279ade01879de3dd0e48dddda6d505e - see response for more details