Buckaroo – The data table UI for Notebooks
#DataTable
💡 Curious about the differences between base R, dplyr, and data.table for table creation?
My latest article covers it all! Learn how to choose the right method for your data needs.
Read it here: https://www.spsanderson.com/steveondata/posts/2025-02-24/ and let me know what you think!
#R #RStats #Programming #table #data #Blog #dplyr #datatable

I'm doing some analysis on weekly precipitation. But I have daily data. So I'm using #rstats #datatable to get the accumulated precipitation (isoweek function).
I just found out that, based on ISO specs, 2014-12-31 belongs to the 1st week of 2015. But my code is adding 2014-12-31 precip to the first week of 2014!
I have to figure out how to get the weekly precip correct
Are duplicates messing up your R analysis? 😱 Our latest blog post offers practical solutions to clean your data!
Dive into the details at https://www.spsanderson.com/steveondata/posts/2025-01-28/ and tell us how you handle duplicates!
#R #RStats #Programming #Rdata #Clean #Blog #RProgramming #dplyr #baser #datatable
💡 Did you know there are multiple ways to add rows to data frames in R? My latest post breaks it down for you!
Check it out at https://www.spsanderson.com/steveondata/posts/2025-01-21/ and comment with your experiences!
#R #RStats #Programming #Data #Tips #Blog #dplyr #datatable #RProgramming
💡 Did you know there are multiple ways to add rows to data frames in R? My latest post breaks it down for you!
Check it out at https://www.spsanderson.com/steveondata/posts/2025-01-21/ and comment with your experiences!
#R #RStats #Programming #Data #Tips #Blog #dplyr #datatable #RProgramming
#stackoverflow question: Is there an equivalent to plyr::ddply's .drop=FALSE in data.table?#rstats #plyr #data.table stackoverflow.com/q/18878854/175…
📊 Want to make your R data manipulation more efficient? Discover 4 essential subsetting techniques in our new post!
Visit https://www.spsanderson.com/steveondata/posts/2024-11-12/ and share your thoughts in the comments!
#R #RStats #Programming #Data #Learn #Blog #dplyr #datatable
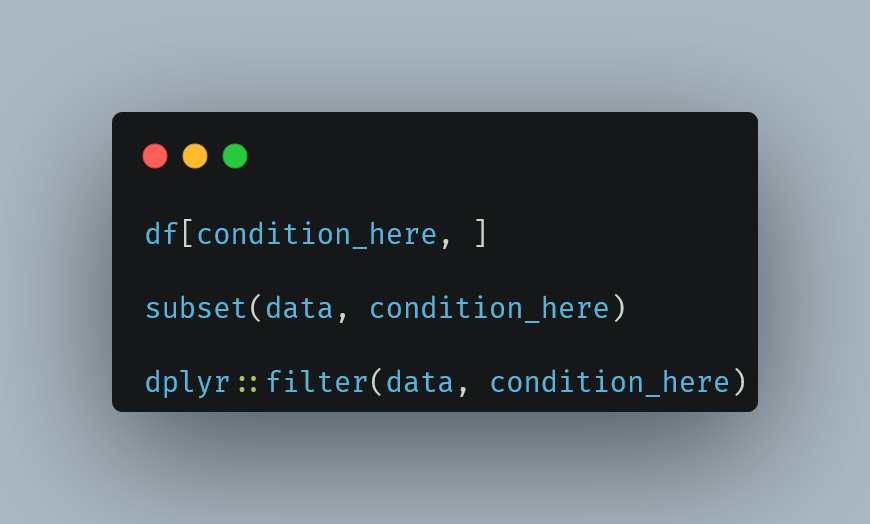

🚀 Dive into the world of R with our latest guide on subsetting data frames! Learn 4 practical methods to streamline your data analysis.
Check it out at https://www.spsanderson.com/steveondata/posts/2024-11-12/ and let us know your favorite method!
🌟 New to R? Learn how to iterate over data frame rows with ease!
Check out my latest guide: "How to Iterate Over Rows of Data Frame in R: A Complete Guide for Beginners" at https://www.spsanderson.com/steveondata/posts/2024-10-28/
Dive into practical examples and boost your coding skills! 💻
#R #RStats #Programming #Data #LearnR #RProgramming #tidyverse #datatable #apply #lapply #blog
📊 Want to master data frame combinations in R?
My latest post covers everything from base R to dplyr and data.table. Perfect for beginners!
Post: https://www.spsanderson.com/steveondata/posts/2024-10-10/
🛠️ Want to master data manipulation in R?
My latest post covers everything you need to know about splitting data into equal groups.
Dive in here: https://www.spsanderson.com/steveondata/posts/2024-10-03/
#R #RStats #Programming #DataScience #Tips #ggplot2 #dplyr #datatable
📊 New to R?
Learn how to split data into equal-sized groups using Base R, ggplot2, dplyr, and data.table!
Check out our comprehensive guide: https://www.spsanderson.com/steveondata/posts/2024-10-03/
#R #RStats #Programming #Data #LearnR #ggplot2 #dplyr #datatable
📊 Want to master data frame splitting in R?
My latest post at https://www.spsanderson.com/steveondata/posts/2024-10-01/ covers everything you need to know, from basic to advanced techniques.
Ideal for beginner R programmers looking to boost their skills! Read and comment your thoughts!
#R #RStats #Programming #DataScience #Tips #dplyr #datatable #RProgramming
🚀 New to R programming? Learn how to split data frames like a pro!
Check out our comprehensive guide for beginners at https://www.spsanderson.com/steveondata/posts/2024-10-01/
Discover methods using base R, dplyr, and data.table. Perfect for enhancing your data manipulation skills!
#R #RStats #Programming #Data #Learn #dplyr #datatable #RProgramming
🖥️ Ready to transform your data frames?
Discover the art of stacking columns in R with my comprehensive guide.
Dive into practical examples and tips at https://www.spsanderson.com/steveondata/posts/2024-09-30/
Let's make data manipulation easy!
#R #RStats #Programming #DataScience #Code #dplyr #tidyr #reshape2 #melt #stack #datatable
📊 New to R? Learn how to stack data frame columns like a pro!
Check out my latest guide: "Mastering Data Manipulation in R" at https://www.spsanderson.com/steveondata/posts/2024-09-30/
Perfect for beginners looking to enhance their data skills.
#R #RStats #Programming #Data #LearnR #tidyr #datatable #melt #reshape2
should I use data.table in my RandomWalker package to generate the random walks? I don't think it is necessary, I dont really see people generating 1mm walks of 1mm periods on a regular basis, thoughts?
Client Info
Server: https://mastodon.social
Version: 2025.04
Repository: https://github.com/cyevgeniy/lmst