#plotnine

2026-03-06

@nrennie

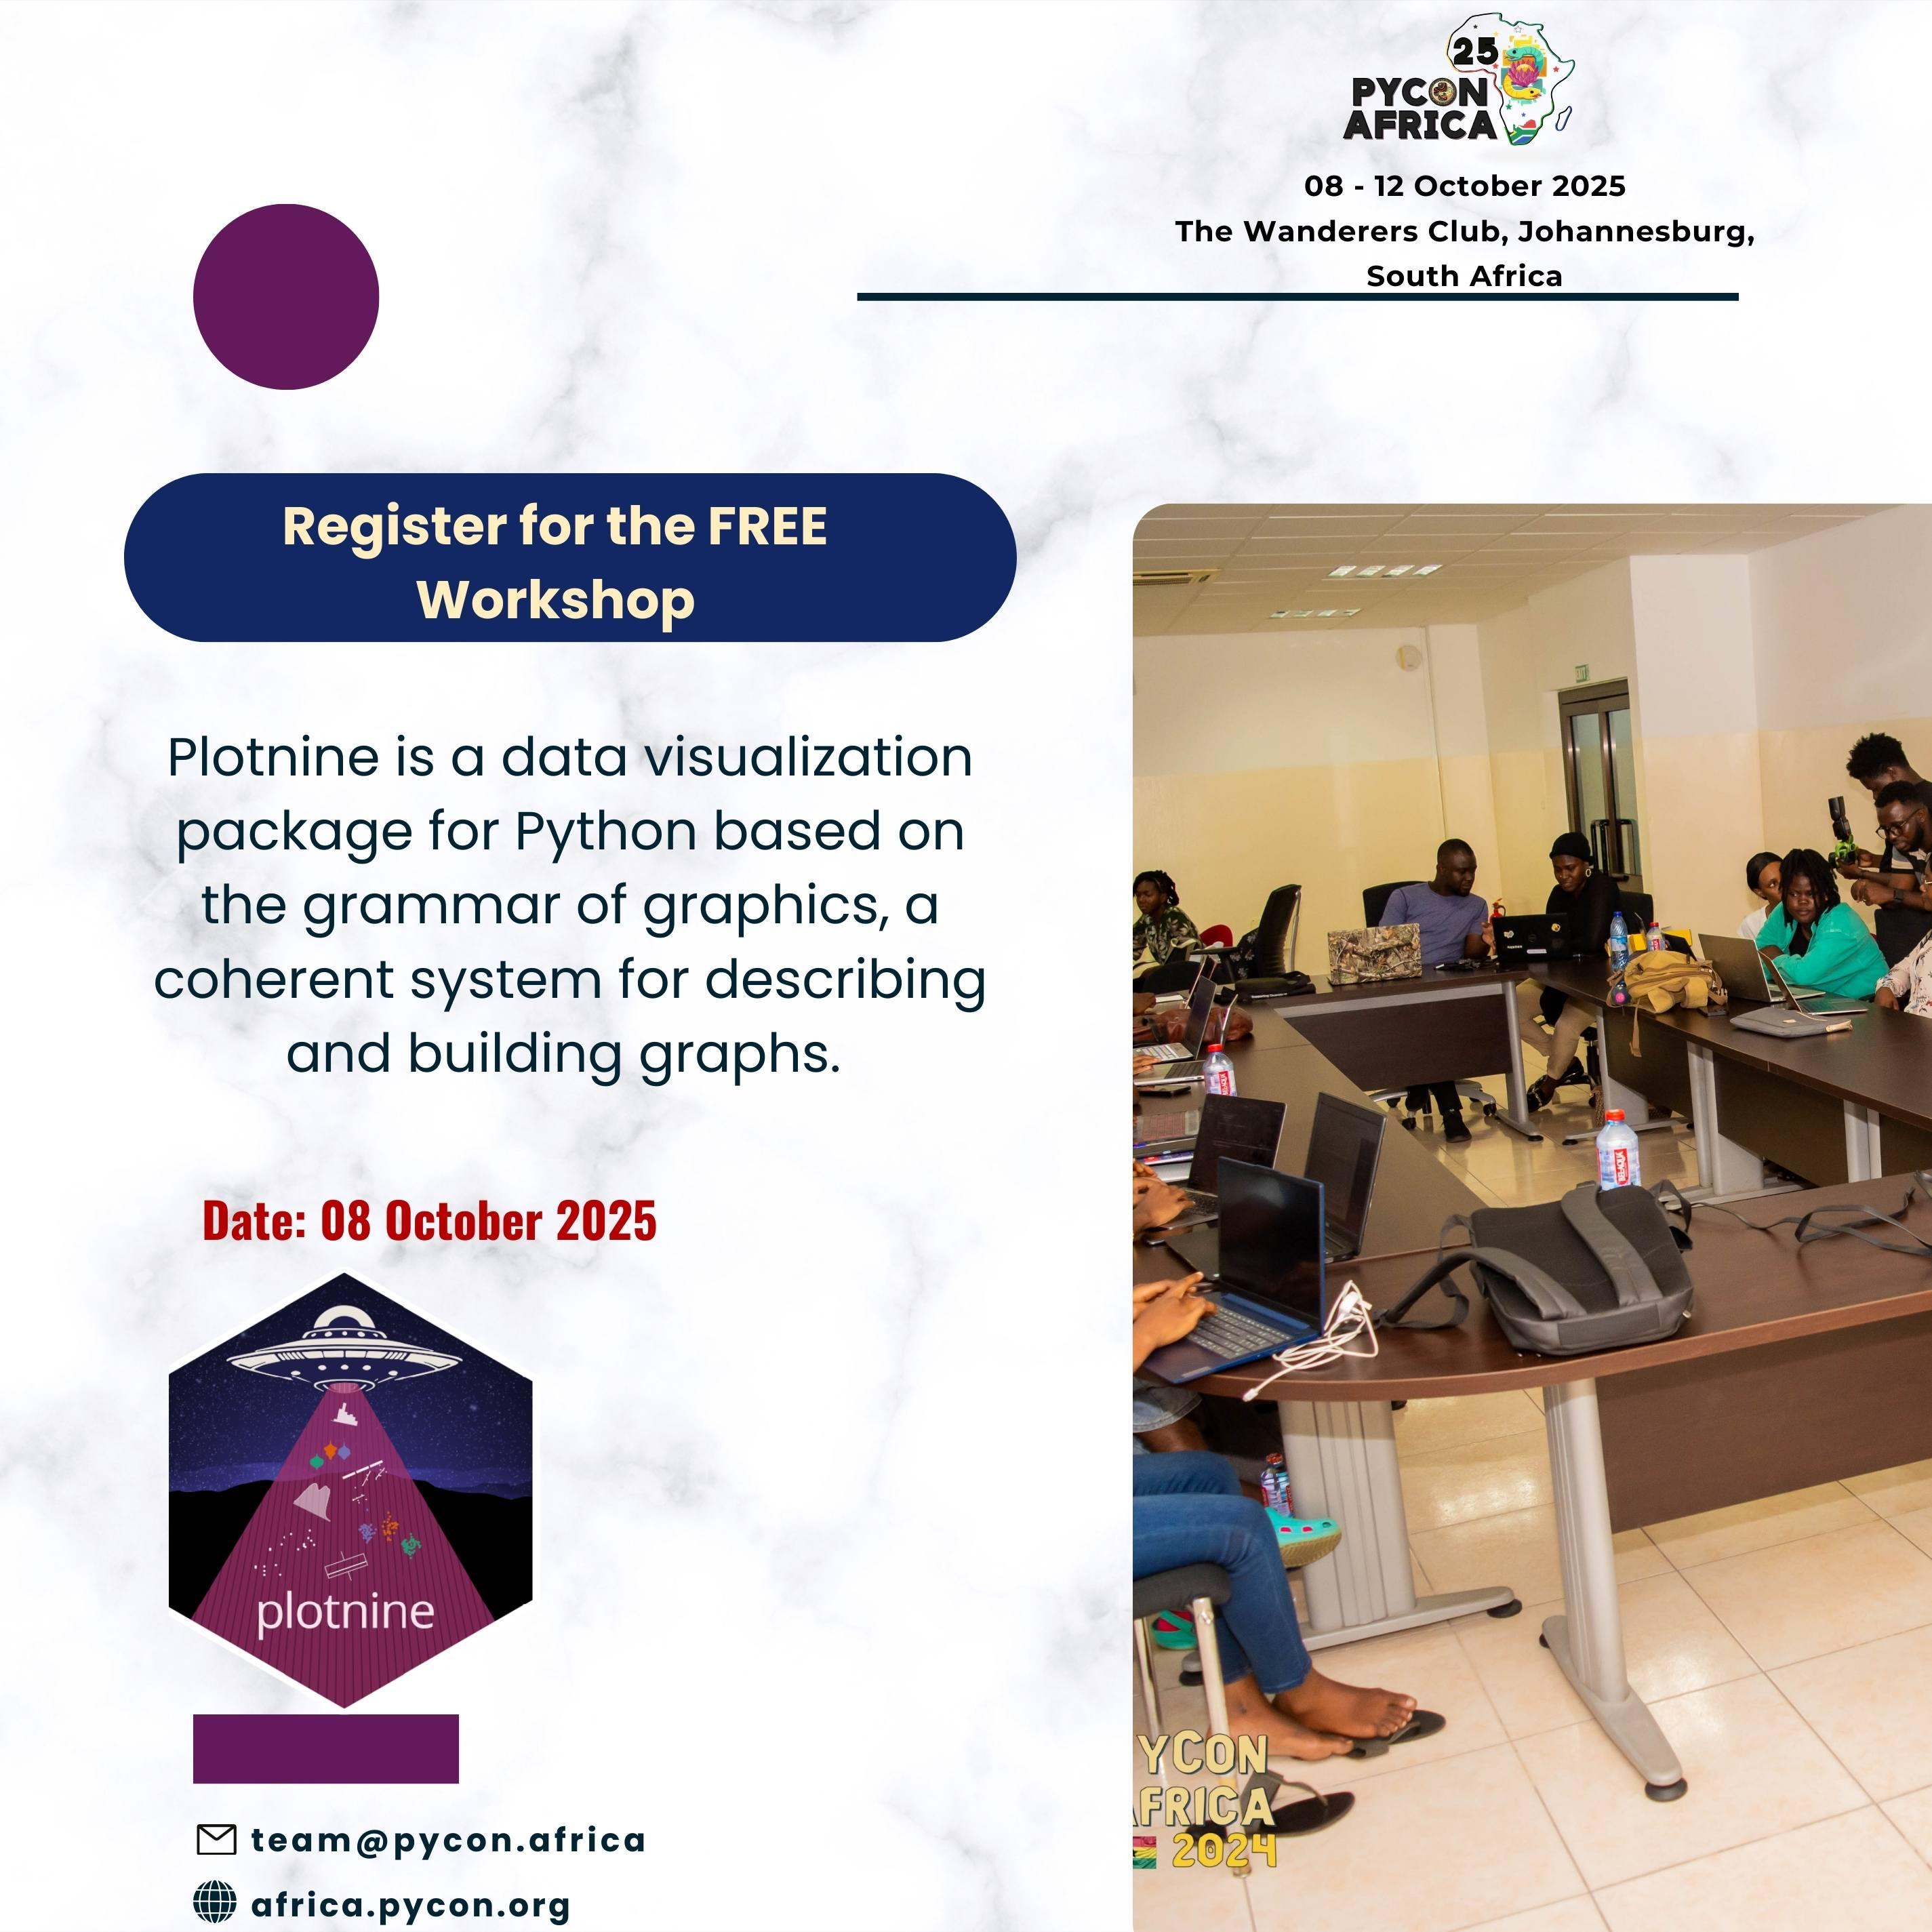
inspired by some of your posts I did a talk at PyData Exter this week on the Grammar of Graphics and plotnine (python implementation)

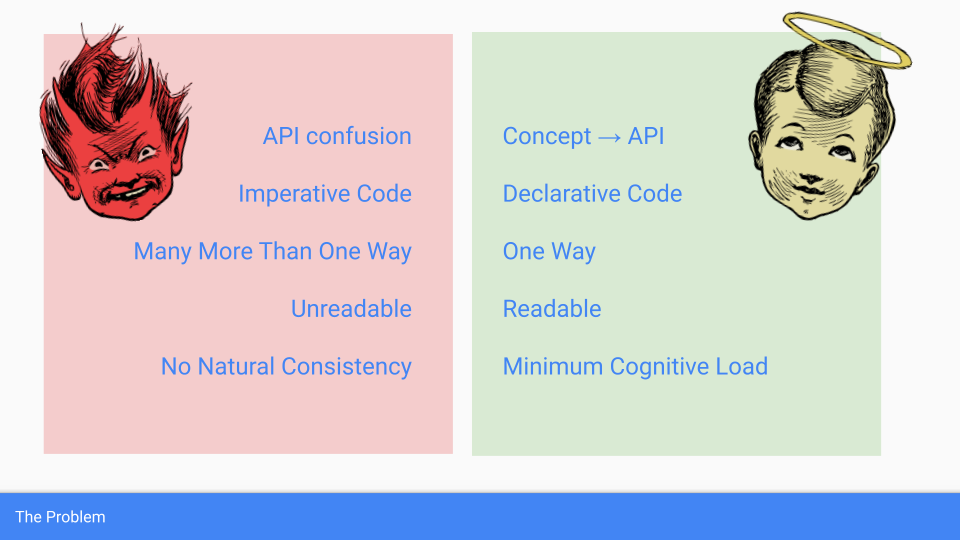
I focussed on the conceptual strength which leads to a good "API" and compared it with the weaker conceptual framework of matplotlib

#plotnine #dataviz #python

API confusion
Imperative Code
Many More Than One Way
Unreadable
No Natural Consistency

--


Concept β†’ API
Declarative Code
One Way
Readable
Minimum Cognitive Load
2026-03-03

A simple stacked bar chart for #TidyTuesday this week, looking at disparities in the number of male and female tortoises 🐒

Made with Plotnine in #Python πŸ“Š

Code: github.com/nrennie/tidytuesday

#DataViz #PydyTuesday #Plotnine

Stacked bar chart showing percentage of female tortoises compared to male, between 2010 and 2023 for three different locations. The first two locations are a reasonable even split, but the third location (plateau) has a consistently low female percentage always below 6%.
2026-01-11

What do round brackets with code inside do in Python?

(
something
something_else
)

I've only ever seen round brackets contain parameters to functions.

I'm asking because plotnine code seems to do it, and I wonder if it is some special overloaded operator ?

#python #plotnine #dataviz

Paison Tiunnpaisontiunn
2025-11-09
2025-09-26

🎨🐍 Plotnine Free Workshop!
Master data visualization in Python with the grammar of graphics. Perfect for all levels! πŸ’»βœ¨
πŸ“… 8 Oct | πŸ“ PyCon Africa, Johannesburg | πŸŽ‰ FREE
🎟️ Register for FREE: za.pycon.org/tickets
#PyConAfrica #Plotnine #Python #DataScience

PyCon Africapyconafrica
2025-09-26

🎨🐍 Plotnine Free Workshop!
Master data visualization in Python with the grammar of graphics. Perfect for all levels! πŸ’»βœ¨
πŸ“… 8 Oct | πŸ“ PyCon Africa, Johannesburg | πŸŽ‰ FREE
🎟️ Register for FREE: za.pycon.org/tickets

2025-09-16

Join our FREE workshops on 8 October for PyCon Africa’s Beginners Day! No experience needed. Connect with the Python community: za.pycon.org/beginners-day

Share and help us open doors!

#Python #PyCon #DjangoGirls #HumbleData #PyGame #Apify #Plotnine

2025-09-15

Join our FREE workshops on 8 October for PyCon Africa’s Beginners Day! No experience needed. Connect with the Python community: za.pycon.org/beginners-day

Share and help us open doors!

#Python #PyCon #DjangoGirls #HumbleData #PyGame #Apify #Plotnine

PyCon Africapyconafrica
2025-09-13

Join our FREE workshops on 8 October for PyCon Africa’s Beginners Day! No experience needed. Connect with the Python community: za.pycon.org/beginners-day

Share and help us open doors!

2025-09-13

Join our FREE workshops on 8 October for PyCon Africa’s Beginners Day! No experience needed. Connect with the Python community: za.pycon.org/beginners-day

Share and help us open doors!

#Python #PyCon #DjangoGirls #HumbleData #PyGame #Apify #Plotnine

So far, I have been a very enthusiastic user of #rstats, #rdatatable , #rmarkdown and #ggplot2 in #RStudio . I am looking for an equally effective, modern #python based setup . So far, I think I will go for #polars, #quarto and #plotnine in #vscode with #uv as package manager . Does anybody have suggestions about pitfalls in switching or advice for the setup? Or are there potentially better alternatives?

2025-06-05

Warm recommendations for #plotnine for #python visualisation: it's feels a bit like emacs in that it takes time to grok its mental model, certainly if, like me you have no previous experience with its ancestor ggplot. But in the end it just does the job.

2025-05-30

I was going to sit down and learn the {plotnine} python library today, but turns out there's nothing really to learnβ€”it's literally {ggplot2} code wrapped in parentheses. If you know {ggplot2} in R, turns out you also know how to make plots on Python!

#Rstats #plotnine #Python

2025-04-15

The recording of my PyData Global talk about data visualisation with Plotnine in #Python is now available! 🐍

Give it a watch if you're interested in:

πŸ“Š customising plotnine plots
πŸ“ˆ combining with matplotlib functions
✍️ adding custom annotations with HighlightText

(or if you're an #RStats user wondering about Plotnine vs #ggplot2)

Link: youtube.com/watch?v=NBGJuaBF2r

#DataViz #Plotnine

2025-03-12

Did you know you can now access #TidyTuesday data in #Python as well as #RStats?

Here's a plot of this week's data about Pixar films made with Plotnine! πŸ“Š

πŸ’» Import data using PyDyTuesday
🎨 Coloured subtitle text added with highlight_text
πŸ–ŠοΈ Fonts installed with pyfonts by Joseph Barbier

Code: github.com/nrennie/tidytuesday

#DataViz #ggplot2 #plotnine #PydyTuesday

The chart compares critic ratings for 13 Pixar films released between 1995 and 2019, using scores from Rotten Tomatoes, Metacritic, and Critics Choice. Each movie is represented by three horizontal bars, showing variation in ratings across different review platforms. The data highlights a dip in scores for Cars 2 before a gradual recovery, with Toy Story and Toy Story 2 achieving the highest Rotten Tomatoes ratings.

Gan nad ydwy'n gwneud cyfrifiadau ystadegol cymhleth rhagor, y prif reswm ro'n i'n dal i ddefnyddio R oedd i ddelweddu data gyda ggplot2. Ond rwy newydd ddarganfod plotnine ar gyfer Python, sy'n gweithio'n arbennig o dda, felly'n annhebygol o fynd yn Γ΄l i R!

#R #Python #ggplot2 #plotnine

2024-12-03

PyData Global starts today! This evening I'll be talking about customising charts with Plotnine, and building better data visualisations πŸ“Š

πŸ“… Tue 3 Dec 2024
⏰ 18:30 UTC (13:30 EST)

#PyData #Plotnine #Python #DataViz

A presentation slide titled "Practical Techniques for Polished Visuals with Plotnine" by Nicola Rennie for PyData Global 2024. It features a hexagon design on the left and Nicola’s contact details on the bottom right, including social media and website links.
2024-11-18

I'm super excited to be speaking at PyData Global in December! I'll be talking about:

πŸ“Š customising plotnine plots
πŸ“ˆ combining with matplotlib functions
✍️ adding custom annotations with HighlightText

I'll be using this chart πŸ‘‡πŸ‘‡πŸ‘‡ as an example!

Link: buff.ly/3Z9R9k6

#DataViz #Plotnine #Python #PyData #ggplot2

Area plot of different types of coal production with custom annotations instead of a legend
2024-10-06

2441 runestones in Sweden.
#pydata #python #plotnine #dataviz

Map of Sweden with dots showing the location of runestones.
2024-09-30

Trying out #plotnine and loving it so far! I guess being used to #ggplot2 helps.
#pydata #datavisualization

A heatmap visualization of Stockholm mean temperatures per day between 2013-2023

Client Info

Server: https://mastodon.social
Version: 2025.07
Repository: https://github.com/cyevgeniy/lmst