#seaborn

InterData VNinterdatavn
2025-04-18

Seaborn là gì? Các hàm vẽ biểu đồ trong Seaborn (Python)

Nếu bạn đang tìm cách trực quan hóa dữ liệu trong Python một cách hiệu quả và dễ dàng, Seaborn chính là lựa chọn tuyệt vời. Được xây dựng trên nền tảng Matplotlib, Seaborn giúp bạn tạo ra những biểu đồ đẹp mắt chỉ trong vài dòng mã. Bài viết này sẽ giải thích chi tiết về Seaborn, tính năng nổi bật và so sánh nó với Matplotlib để bạn có thể lựa chọn công cụ phù hợp.

Xem ngay: interdata.vn/blog/seaborn-la-g

2025-04-01

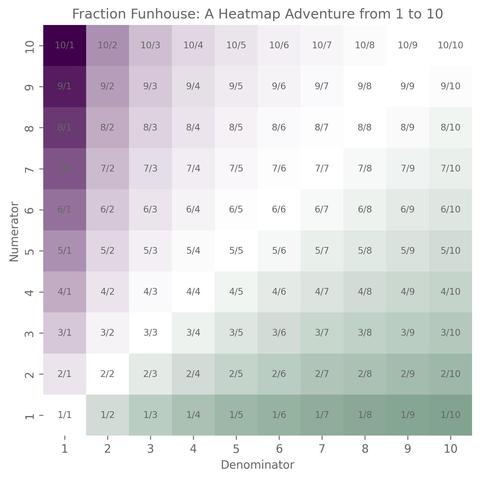
let's go! This was for a bit of practice, and I could *not* have sorted out the non-linear gradient for 1 > n > 0 without . Made with and patience 🎨

A 10 by 10 heatmap where the y-axis is the numerator, and the x-axis is the denominator. These fractions are shaded--increasingly dark purple for numbers greater than one, white for numbers equal to one (the diagonal of the heatmap), and increasingly dark green for numbers approaching zero.
2025-03-26

Инструменты Python для анализа данных на примере данных стриминг-сервиса

В данной статье рассмотрены некоторые методы и инструменты библиотек python для анализа данных. Используем три самые популярные библиотеки: Pandas, Numpy, Seaborn

habr.com/ru/articles/894530/

#pand #numpy #seaborn #python3 #analytics #jupyter_notebook

2025-02-24

Compare the Best Data Visualisation Libraries for Python and Pandas

Stack choices for Python Data Visualisation – you will need to choose different tools for interactive environments, data manipulation, and data visulisation. A common and flexible setup comprises Jupyter notebooks, the Pandas library, and Matplotlib.
2025-02-20

Python Histogram Plotting: Visualizing Multiple Datasets with Seaborn
Master Python Histogram Plotting for effective data visualization! Learn to create clear histograms with multiple datasets using Matplotlib & Seaborn. Improve your data analysis skills today!
tech-champion.com/programming/

Mike Driscolldriscollis
2025-02-13

How to create a pie chart with and 🐍🔥

2025-02-11

Visualize atmospheric data using Python Heatmap Analysis! Learn to create scatter plots & heatmaps with Seaborn & Matplotlib for insightful weather pattern analysis. PythonHeatmap
tech-champion.com/data-science

2025-02-04
2025-01-27

Before prettifying: a colourful riot of indecipherable lines. After: much better.

Hypsometry across 22 study sites, grouped by whether the site is a lake-terminating or land-terminating.

#dataviz #matplotlib #seaborn #hypsometry

Two plots, title 'lake' and 'land' showing the distribution of elevation across 13 and 7 sites respectively. Each line is a different colour. It is hard to read.Distribution of elevations across 21 study sites, sorted by median elevation, lines coloured blue for lake sites, orange for land sites. Below each line, the site id# is shown.
2024-12-16

#DataViz Decision-Making Guide

"How do you decide between #Plotly and #Seaborn?
* If you need interactive and dynamic visualizations, especially for dashboards or 3D data, Plotly is the way to go.
* If you’re focused on statistical analysis, creating publication-ready visuals, or conducting exploratory data analysis, Seaborn is likely your best choice."
by Amit Yadav: medium.com/@amit25173/plotly-v

#dataDev #retrieval #dataMining

2024-11-16

Me: #datavisualization is so boring and annoying 😑
Also me: Learns and becomes proficient in the usage of #matplotlib #seaborn #plotly and #ggplot2 and codes #dash and #shiny dashboards with my eyes closed.
😂
I can’t explain it either.
#DataScience #DataScientist

2024-11-03

Возможности функции scatterplot() библиотеки seaborn

Функция scatterplot() из библиотеки seaborn предназначена для построения диаграммы рассеяния, позволяя визуализировать взаимосвязь между двумя числовыми переменными. Она предоставляет множество параметров для настройки внешнего вида точек, цветовых оттенков и размеров, что делает её полезной для анализа данных с несколькими переменными.

habr.com/ru/articles/855758/

#Seaborn #scatterplot

2024-11-02

Nom.

fediscience.org/@tlohde/113412
@tlohde - Croissant Distribution🥐 📊

or, where am I most likely to have my next croissant, assuming (something something) independence from my previous croissant. 🥐^k * e^(-🥐) / k!
--
2d kernel density estimation of the location of bakeries (blue) and farms (red) across France.

Locations taken from OpenStreetMap, with #osmnx & plotted with #matplotlib & #seaborn. font: Borel, by Rosalie Wagner.

#30DayMapChallenge Day 2: Lines

2024-11-02

Croissant Distribution🥐 📊

or, where am I most likely to have my next croissant, assuming (something something) independence from my previous croissant. 🥐^k * e^(-🥐) / k!
--
2d kernel density estimation of the location of bakeries (blue) and farms (red) across France.

Locations taken from OpenStreetMap (considered paying attention to the size of the farm, but didn't), with #osmnx & plotted with #matplotlib & #seaborn. font: Borel, by Rosalie Wagner.

#30DayMapChallenge Day 2: Lines

Minimalistic map of France, showing a series of nested contour lines in blue and red. Blue contours represented the density of bakeries; red farms. Above the main plot, the longitudinal distribution of bakeries and farms are shown (with a prominent bakery mode inline with Paris), and to the right the latitudinal distributions.
Python Job Supportpythonjobsupport
2024-09-21

Python – Seaborn – Data Visualization Masterclass [Crash Course]

Python Welcome to the Python Data Visualization with Seaborn. Following is the repository of the code ... source

quadexcel.com/wp/python-seabor

2024-09-10

Playing with #Kaggle today...
File similarity work bleeding over into my weekend mindspace.

kaggle.com/code/osunderdog/fil

#python #seaborn #datavis

2024-09-01

Are Power Rangers shows getting better? Episodes in 2019 and 2020 seem to be rated higher compared to previous seasons. I didn't even know the show was still going 👀 😅

My contribution to the #TidyTuesday challenge week 35 using the Kaggle Power Rangers data set. #Dataviz made in #python using #matplotlib + #seaborn.

🔗Full code (a bit messy though) github.com/Lisa-Ho/small-data-

Chart that shows the average IMDB ratings for each Power Rangers episode and season overall between 1993 and 2020. The last two seasons' episodes are all rated 7 or above which is higher than for any other season. Although, the overall season rating (6.8) is only slightly above the average (6.3).
2024-08-25

Client Info

Server: https://mastodon.social
Version: 2025.04
Repository: https://github.com/cyevgeniy/lmst