Today's post in on #Python #ControlFlow.
I'm learning as I go so be kind :)
Post: https://www.spsanderson.com/steveondata/posts/2025-05-28/
New Book: https://packt.link/oTyZJ | R - install.packages("healthyverse") | #SQL | opinions are mine | #rstats | Mainly though my wife and kids :) | Advisor to DoTadda - All posts delete in 12 months.
Today's post in on #Python #ControlFlow.
I'm learning as I go so be kind :)
Post: https://www.spsanderson.com/steveondata/posts/2025-05-28/

Want to generate random numbers from a distribution? Todays article has you covered: https://www.spsanderson.com/steveondata/posts/2025-05-26/
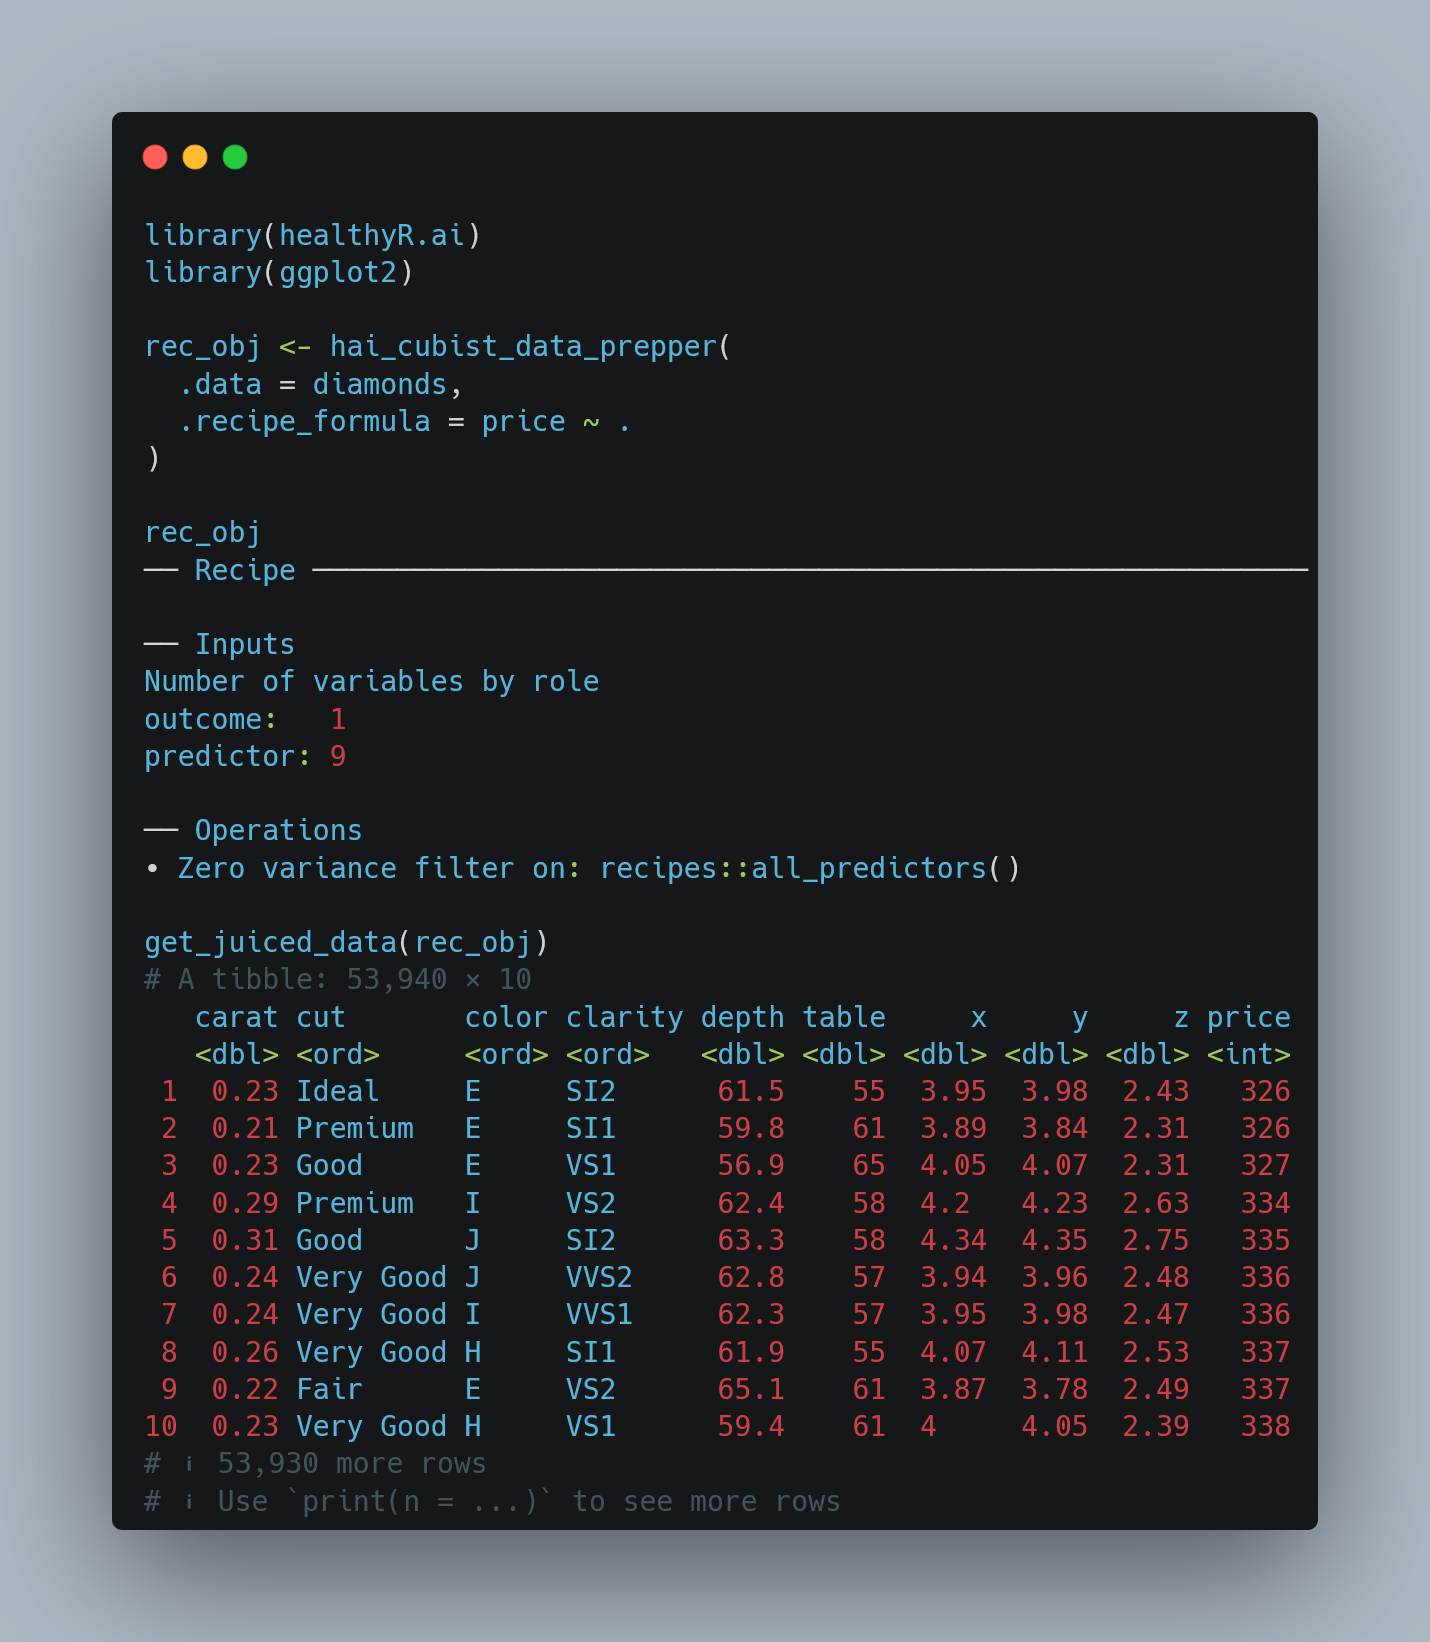
If you are looking to use the cubist algo for regression and want to get it into shape then use the healthyR.ai package and the hai_cubist_data_prepper() function.
Link: https://www.spsanderson.com/healthyR.ai/reference/hai_cubist_data_prepper.html
Finally got on the #Python bandwagon, sort of. Today I started my series on python programming. I'm learning as I go.
Link: https://www.spsanderson.com/steveondata/posts/2025-05-23/

Today I'm talking about those pesky random samples again: https://www.spsanderson.com/steveondata/posts/2025-05-19/
Today's article went back to #Linux I tried my best to write about #Arrays and to provide some simple practical examples.
If you want to read more then just follow this link -> https://www.spsanderson.com/steveondata/posts/2025-05-16/
Today's Title: Arrays in Linux: A Complete Guide for Beginners
Happy Coding 🚀

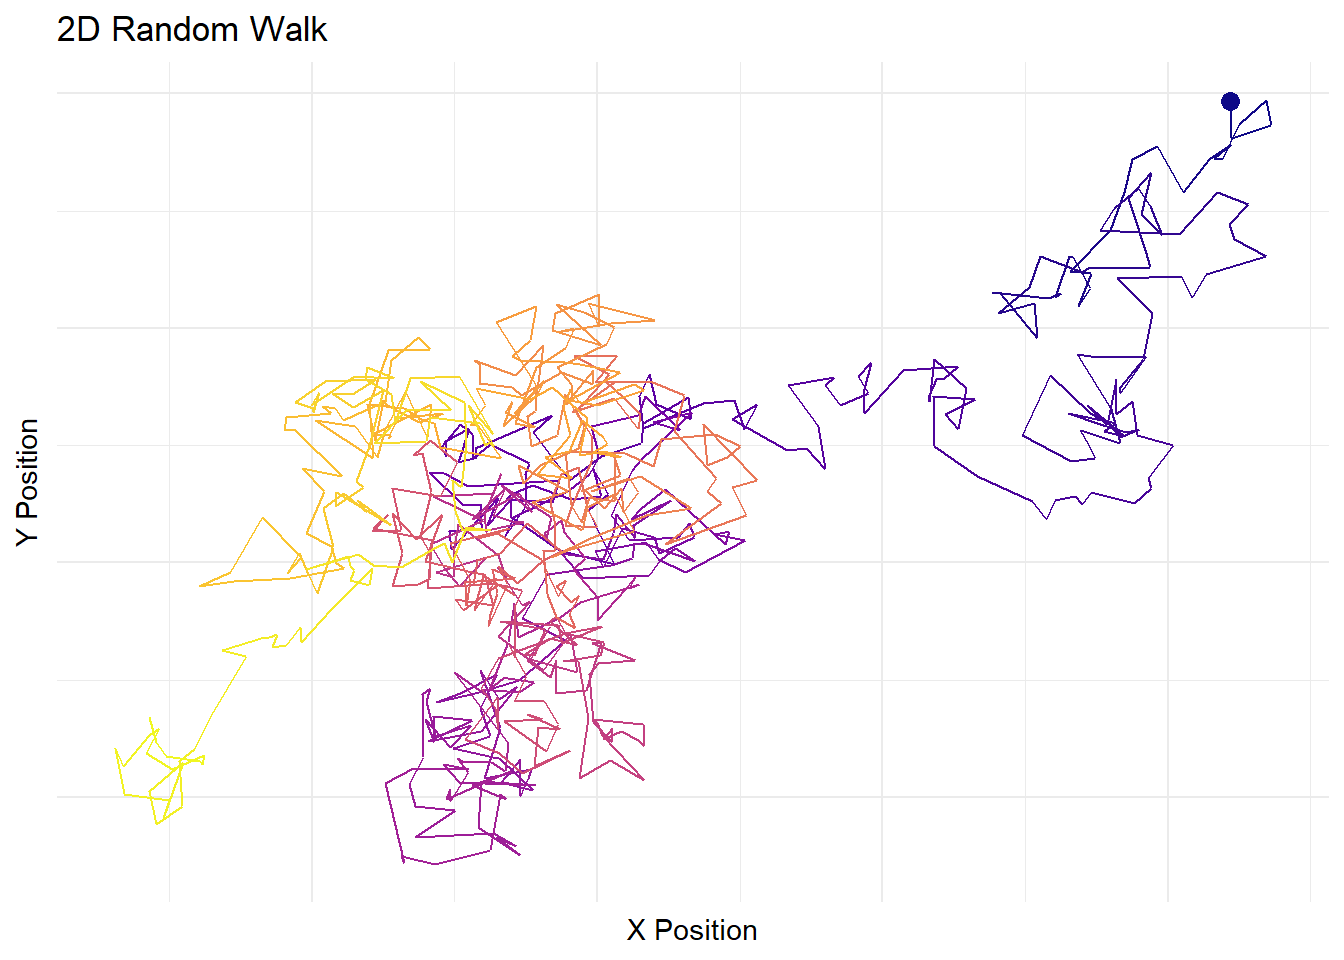
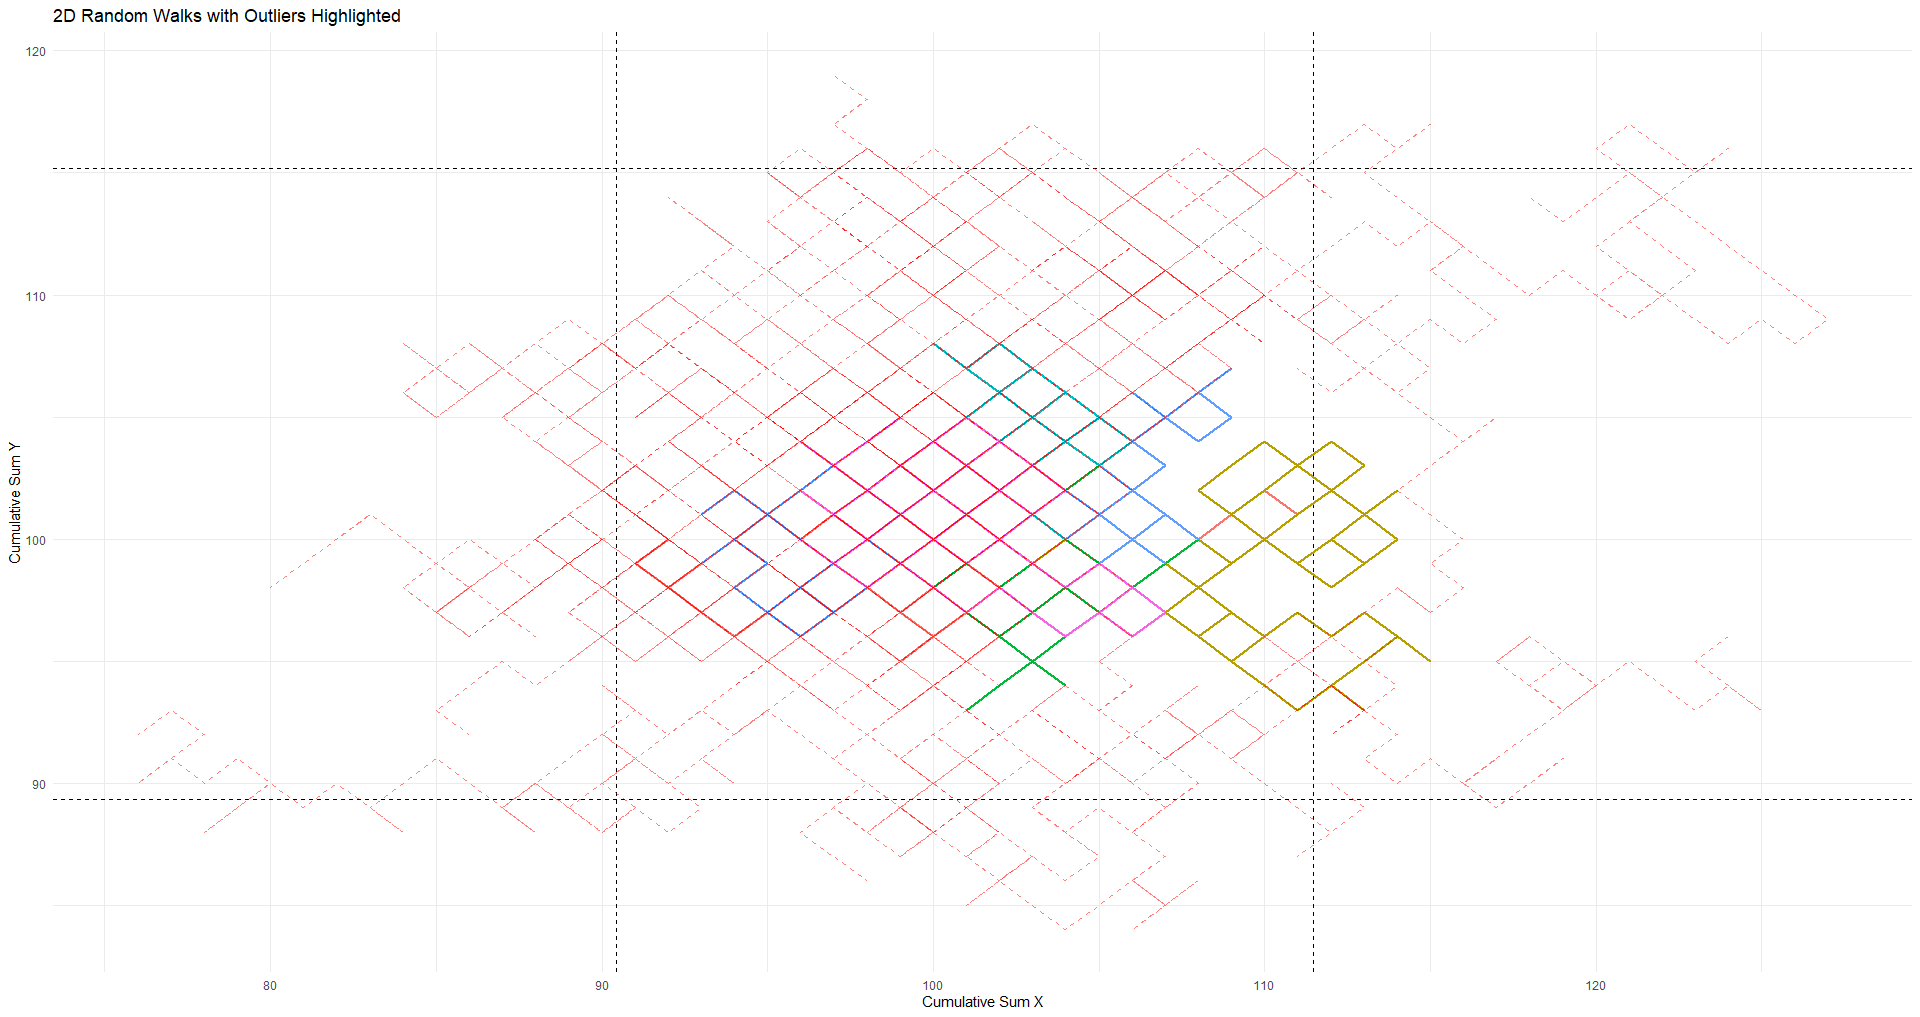
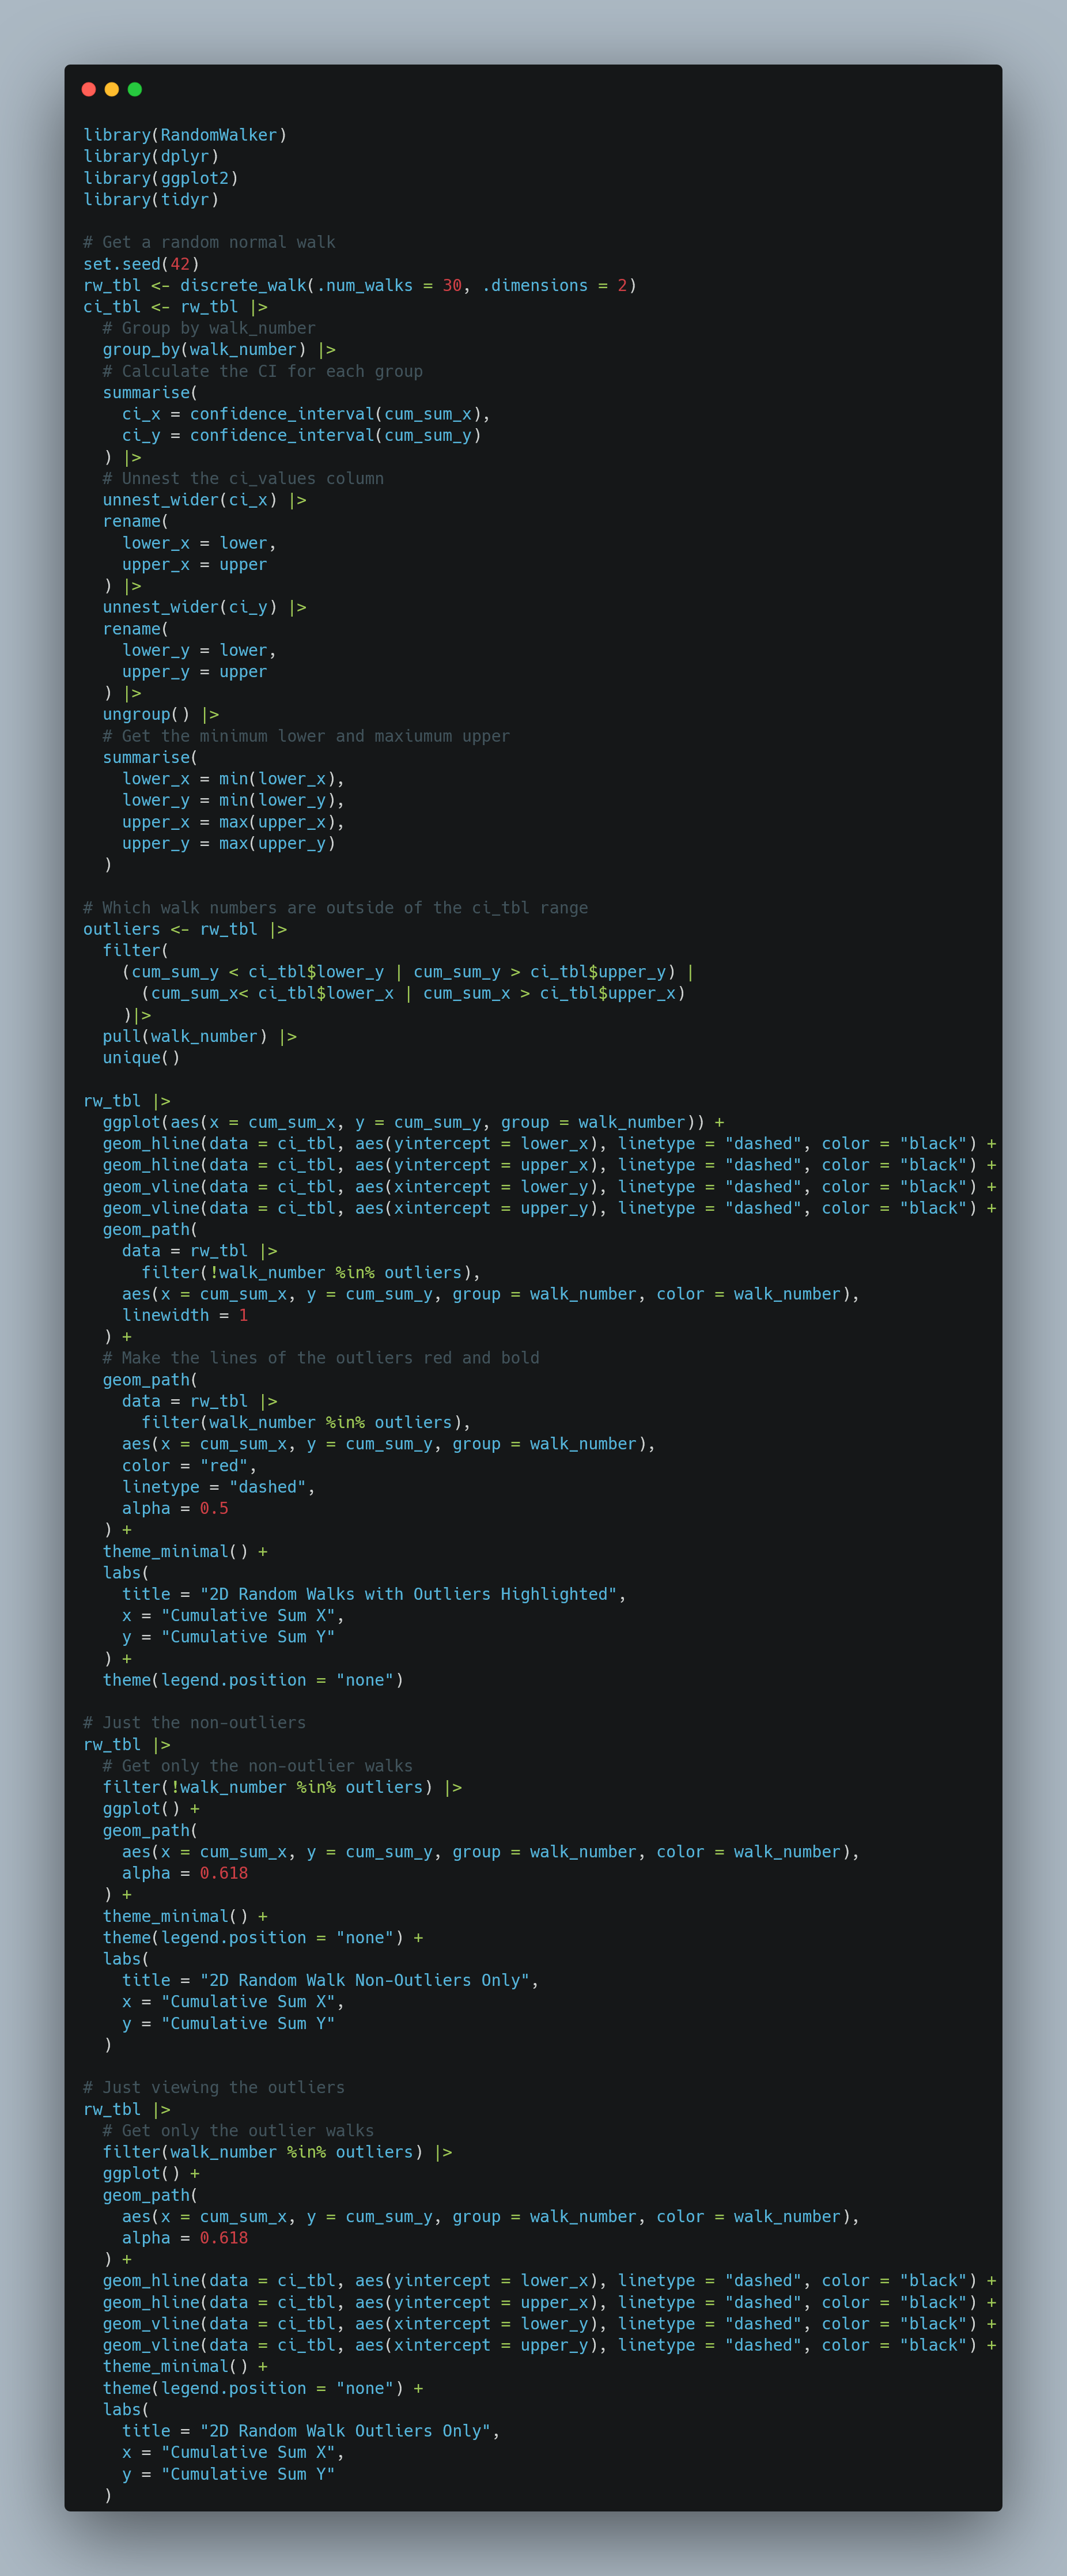
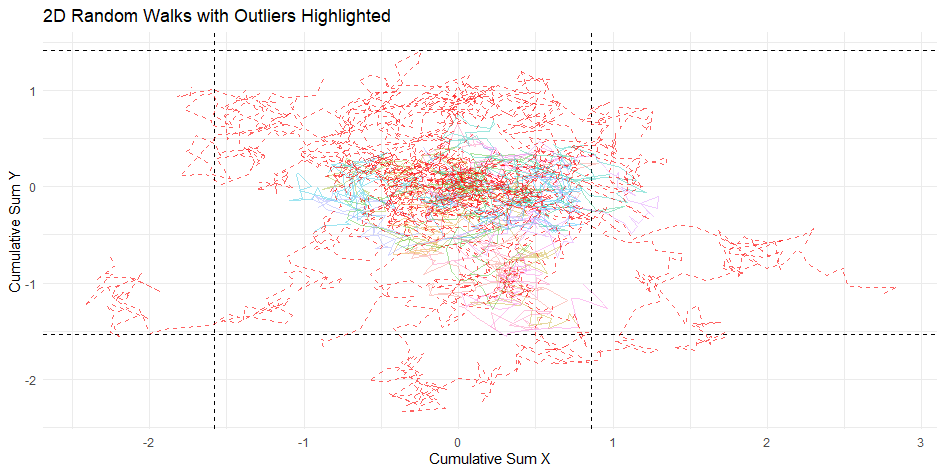
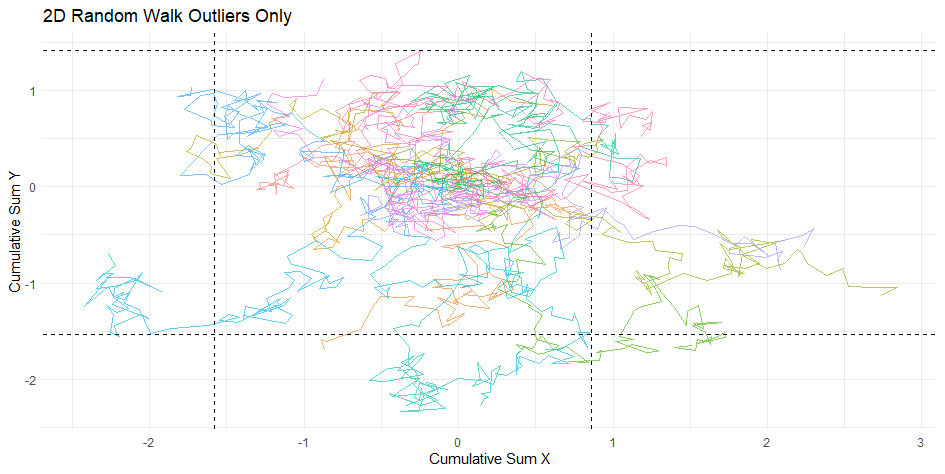
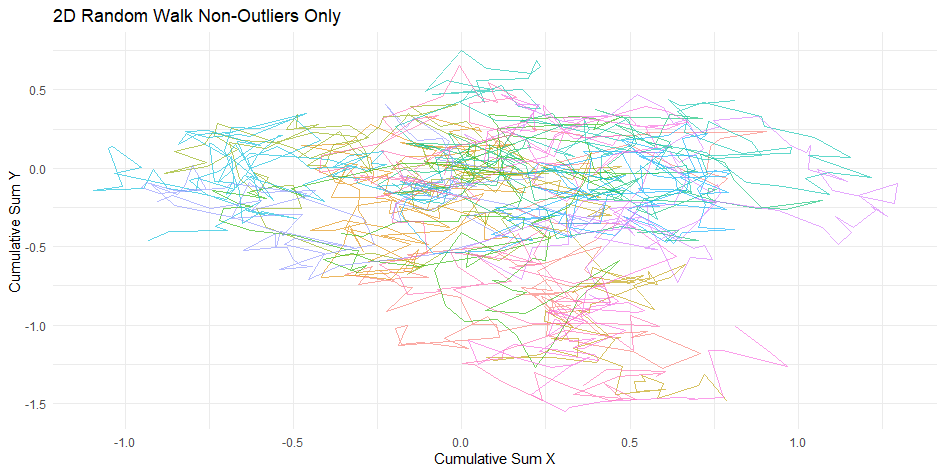
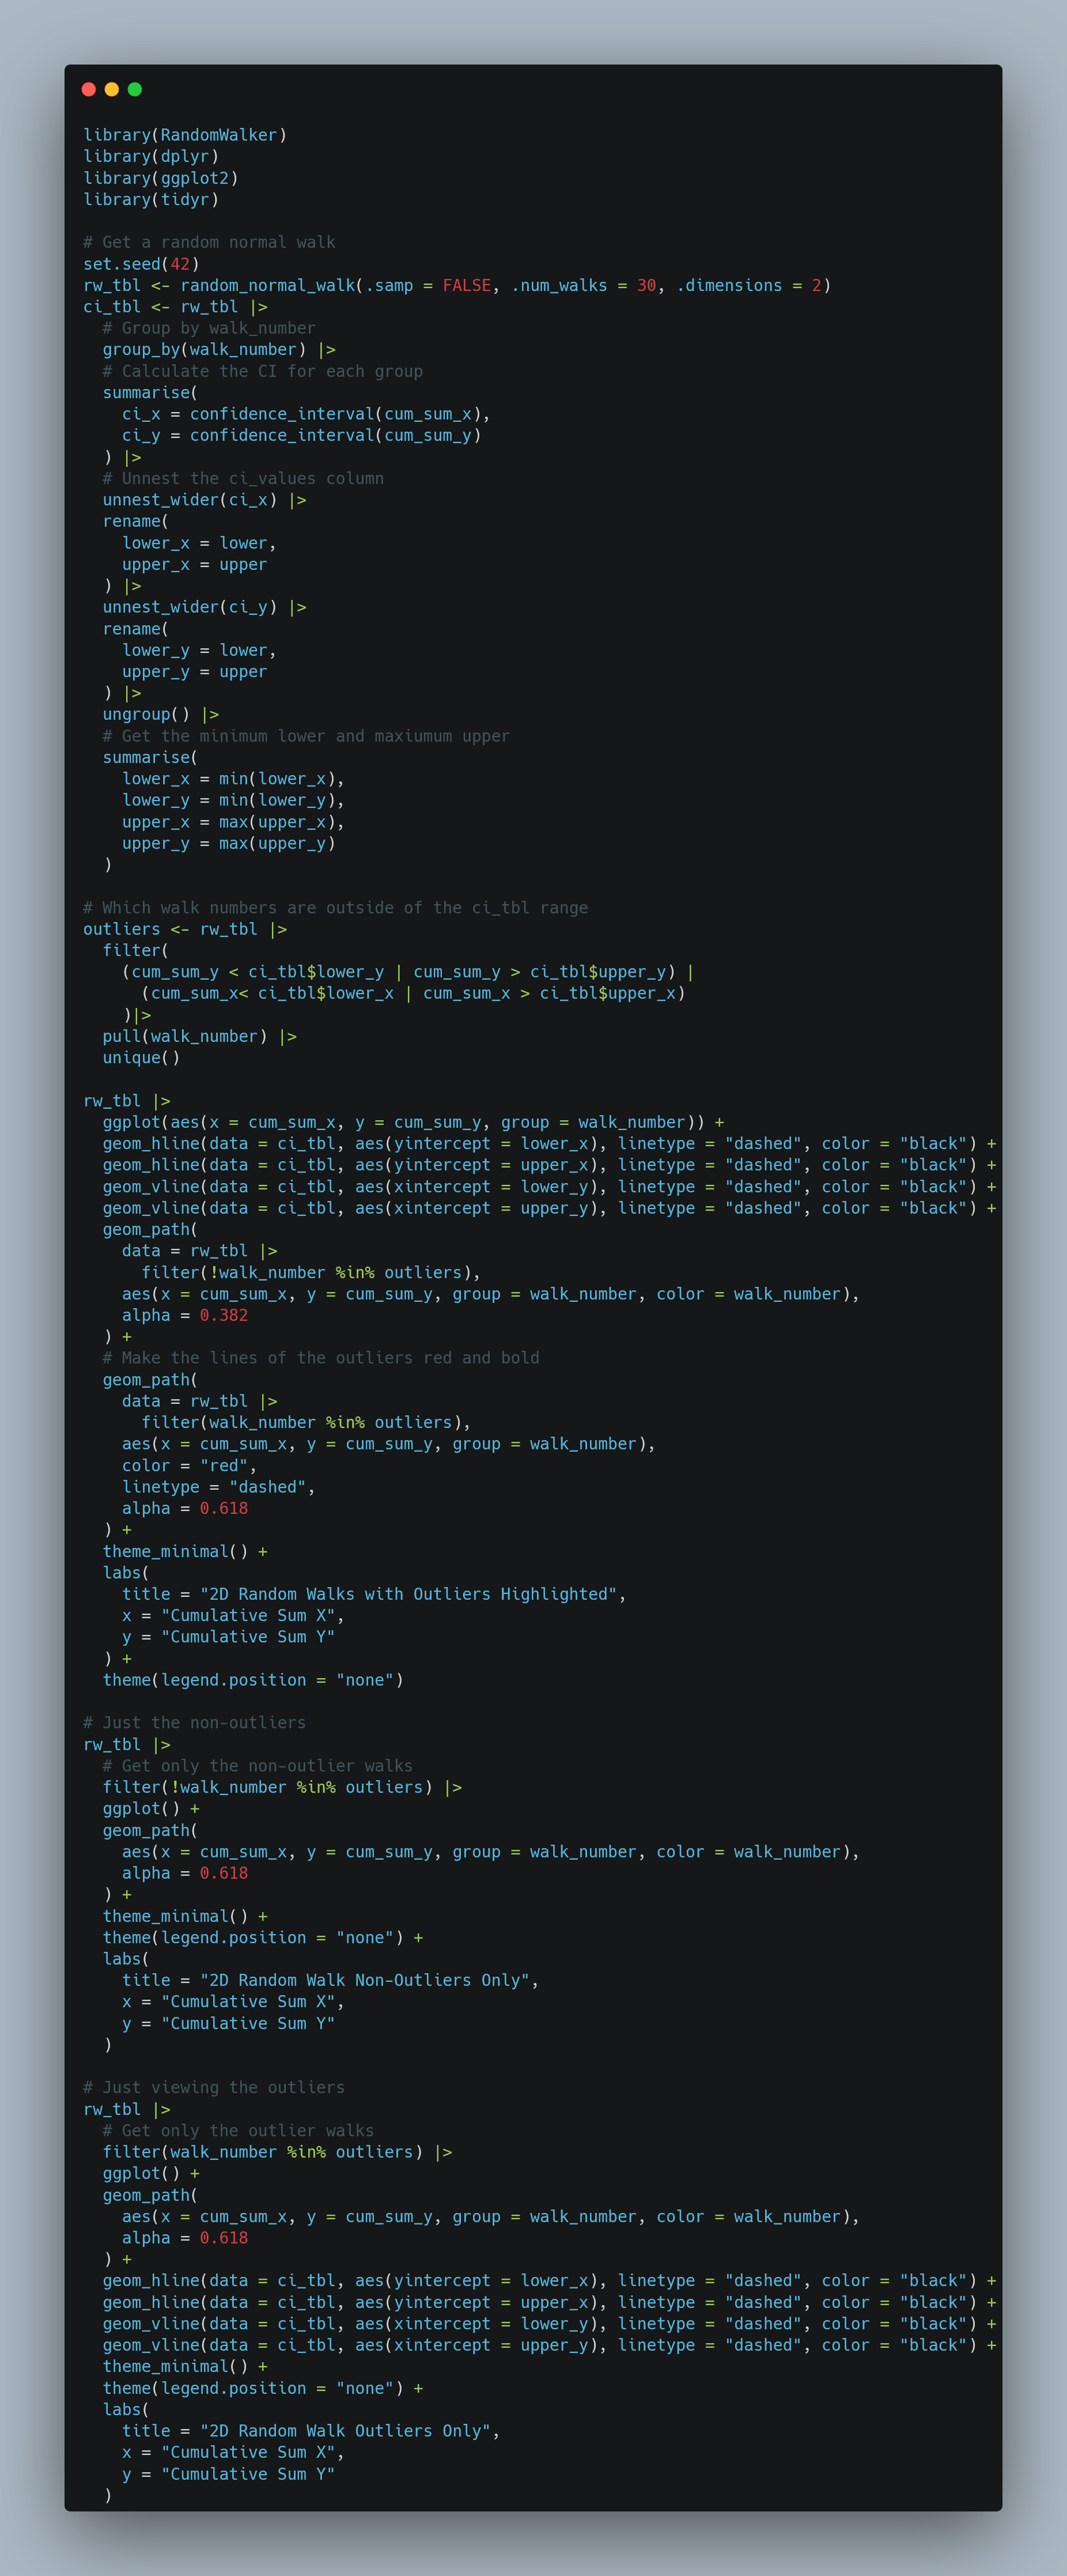
Same as yesterday, but this time, making a 2D Discrete Random Walk with my #R #Package #RandomWalker
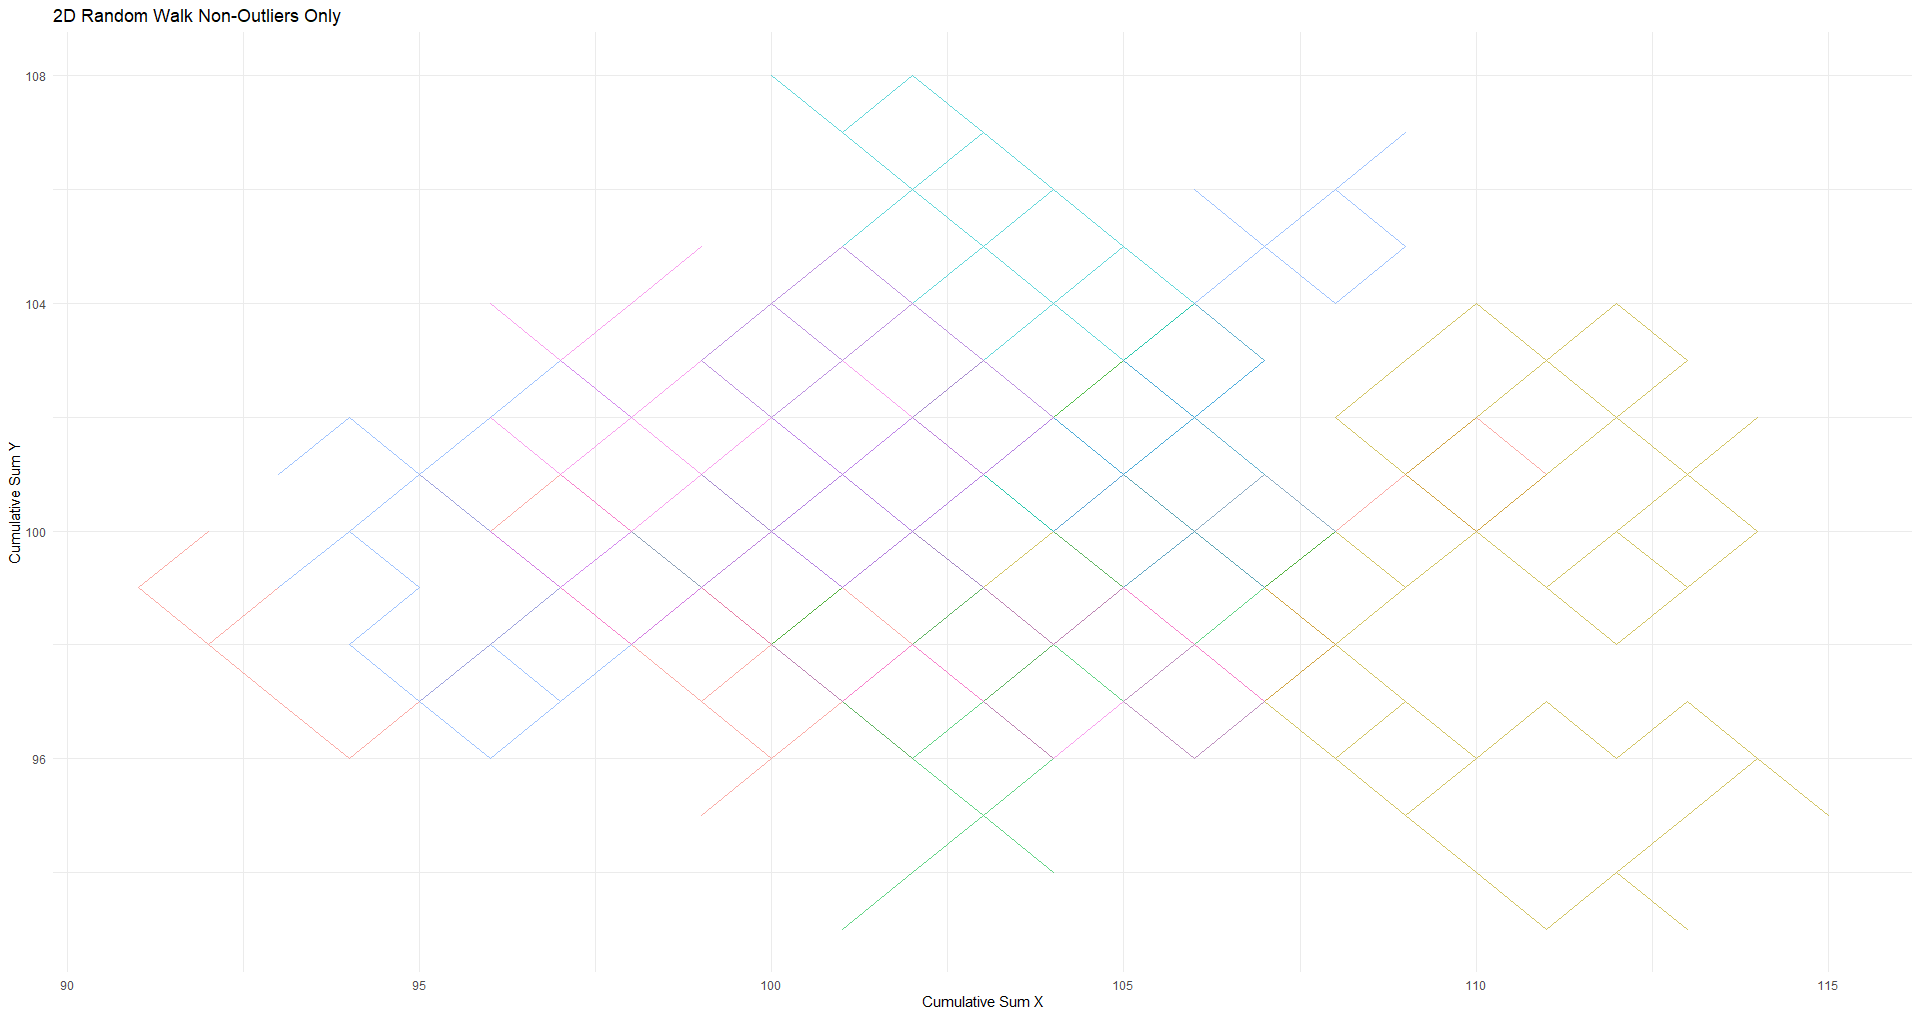
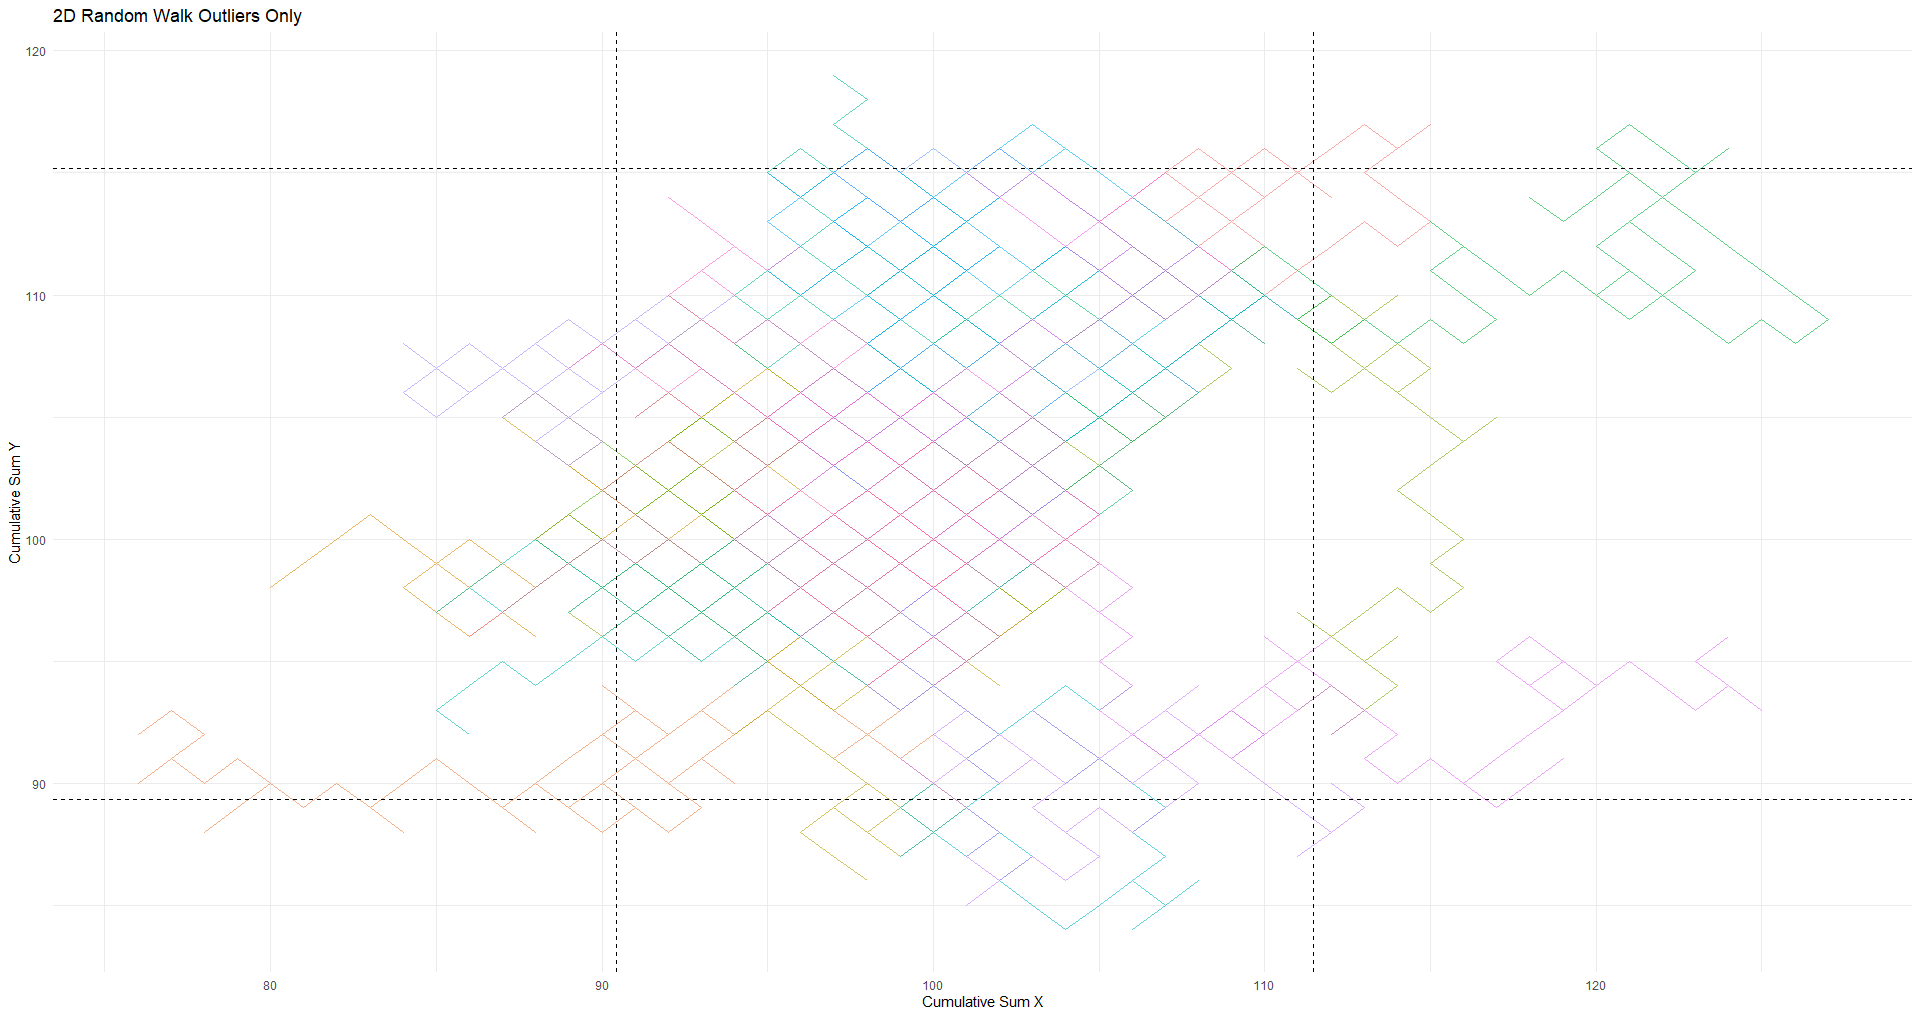
As i write theese it’s bringing ideas to my head to maybe make some new functions
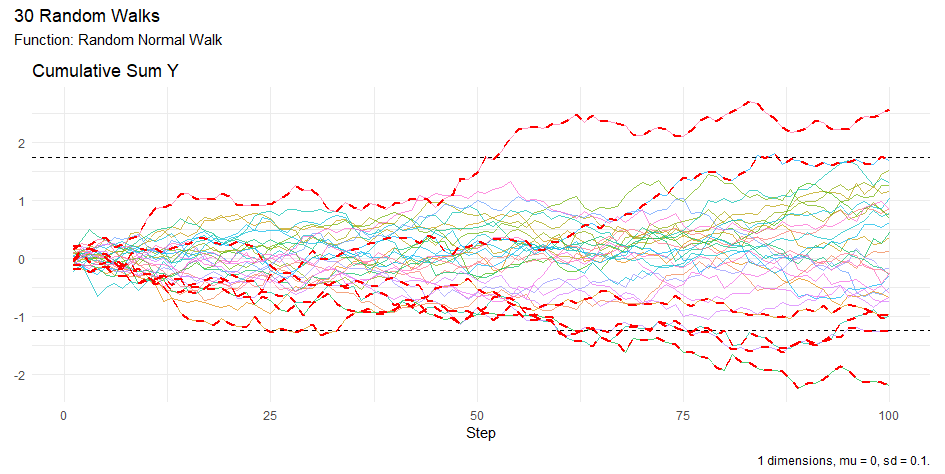
Generate and visualize a Two Dimensional Random Walk in #R with #RandomWalker
🔍 Need to create a vector of zeros in R? Well, today I wrote about how to use numeric(), integer(), and rep() to initialize vectors efficiently.
These are great tools for pre-allocating memory.
Read more at https://www.spsanderson.com/steveondata/posts/2025-05-14/

#opinion President Trump is taking a $400 million bribe.
Prove me wrong.
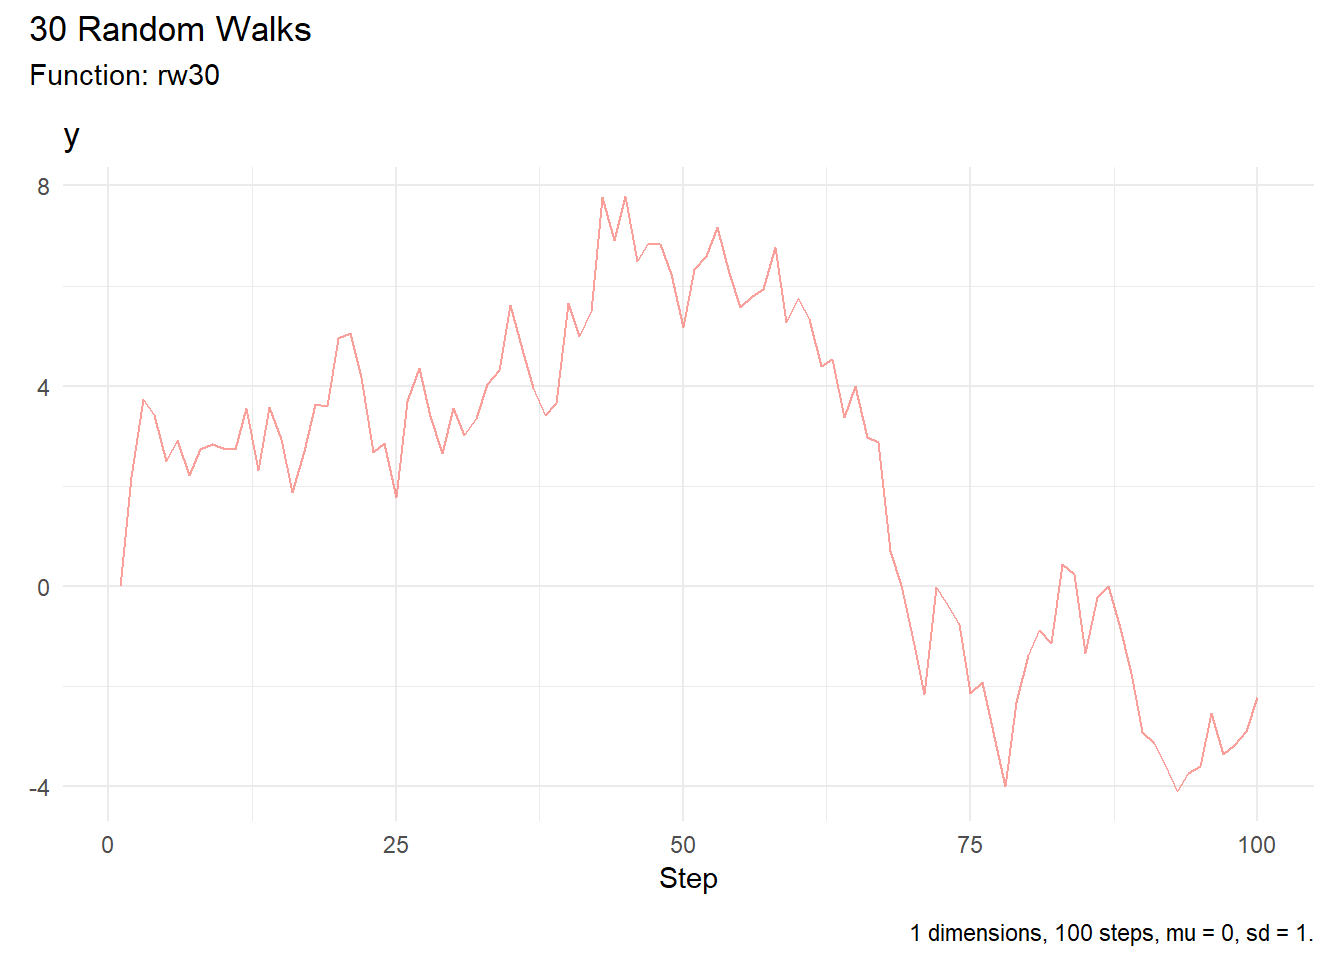
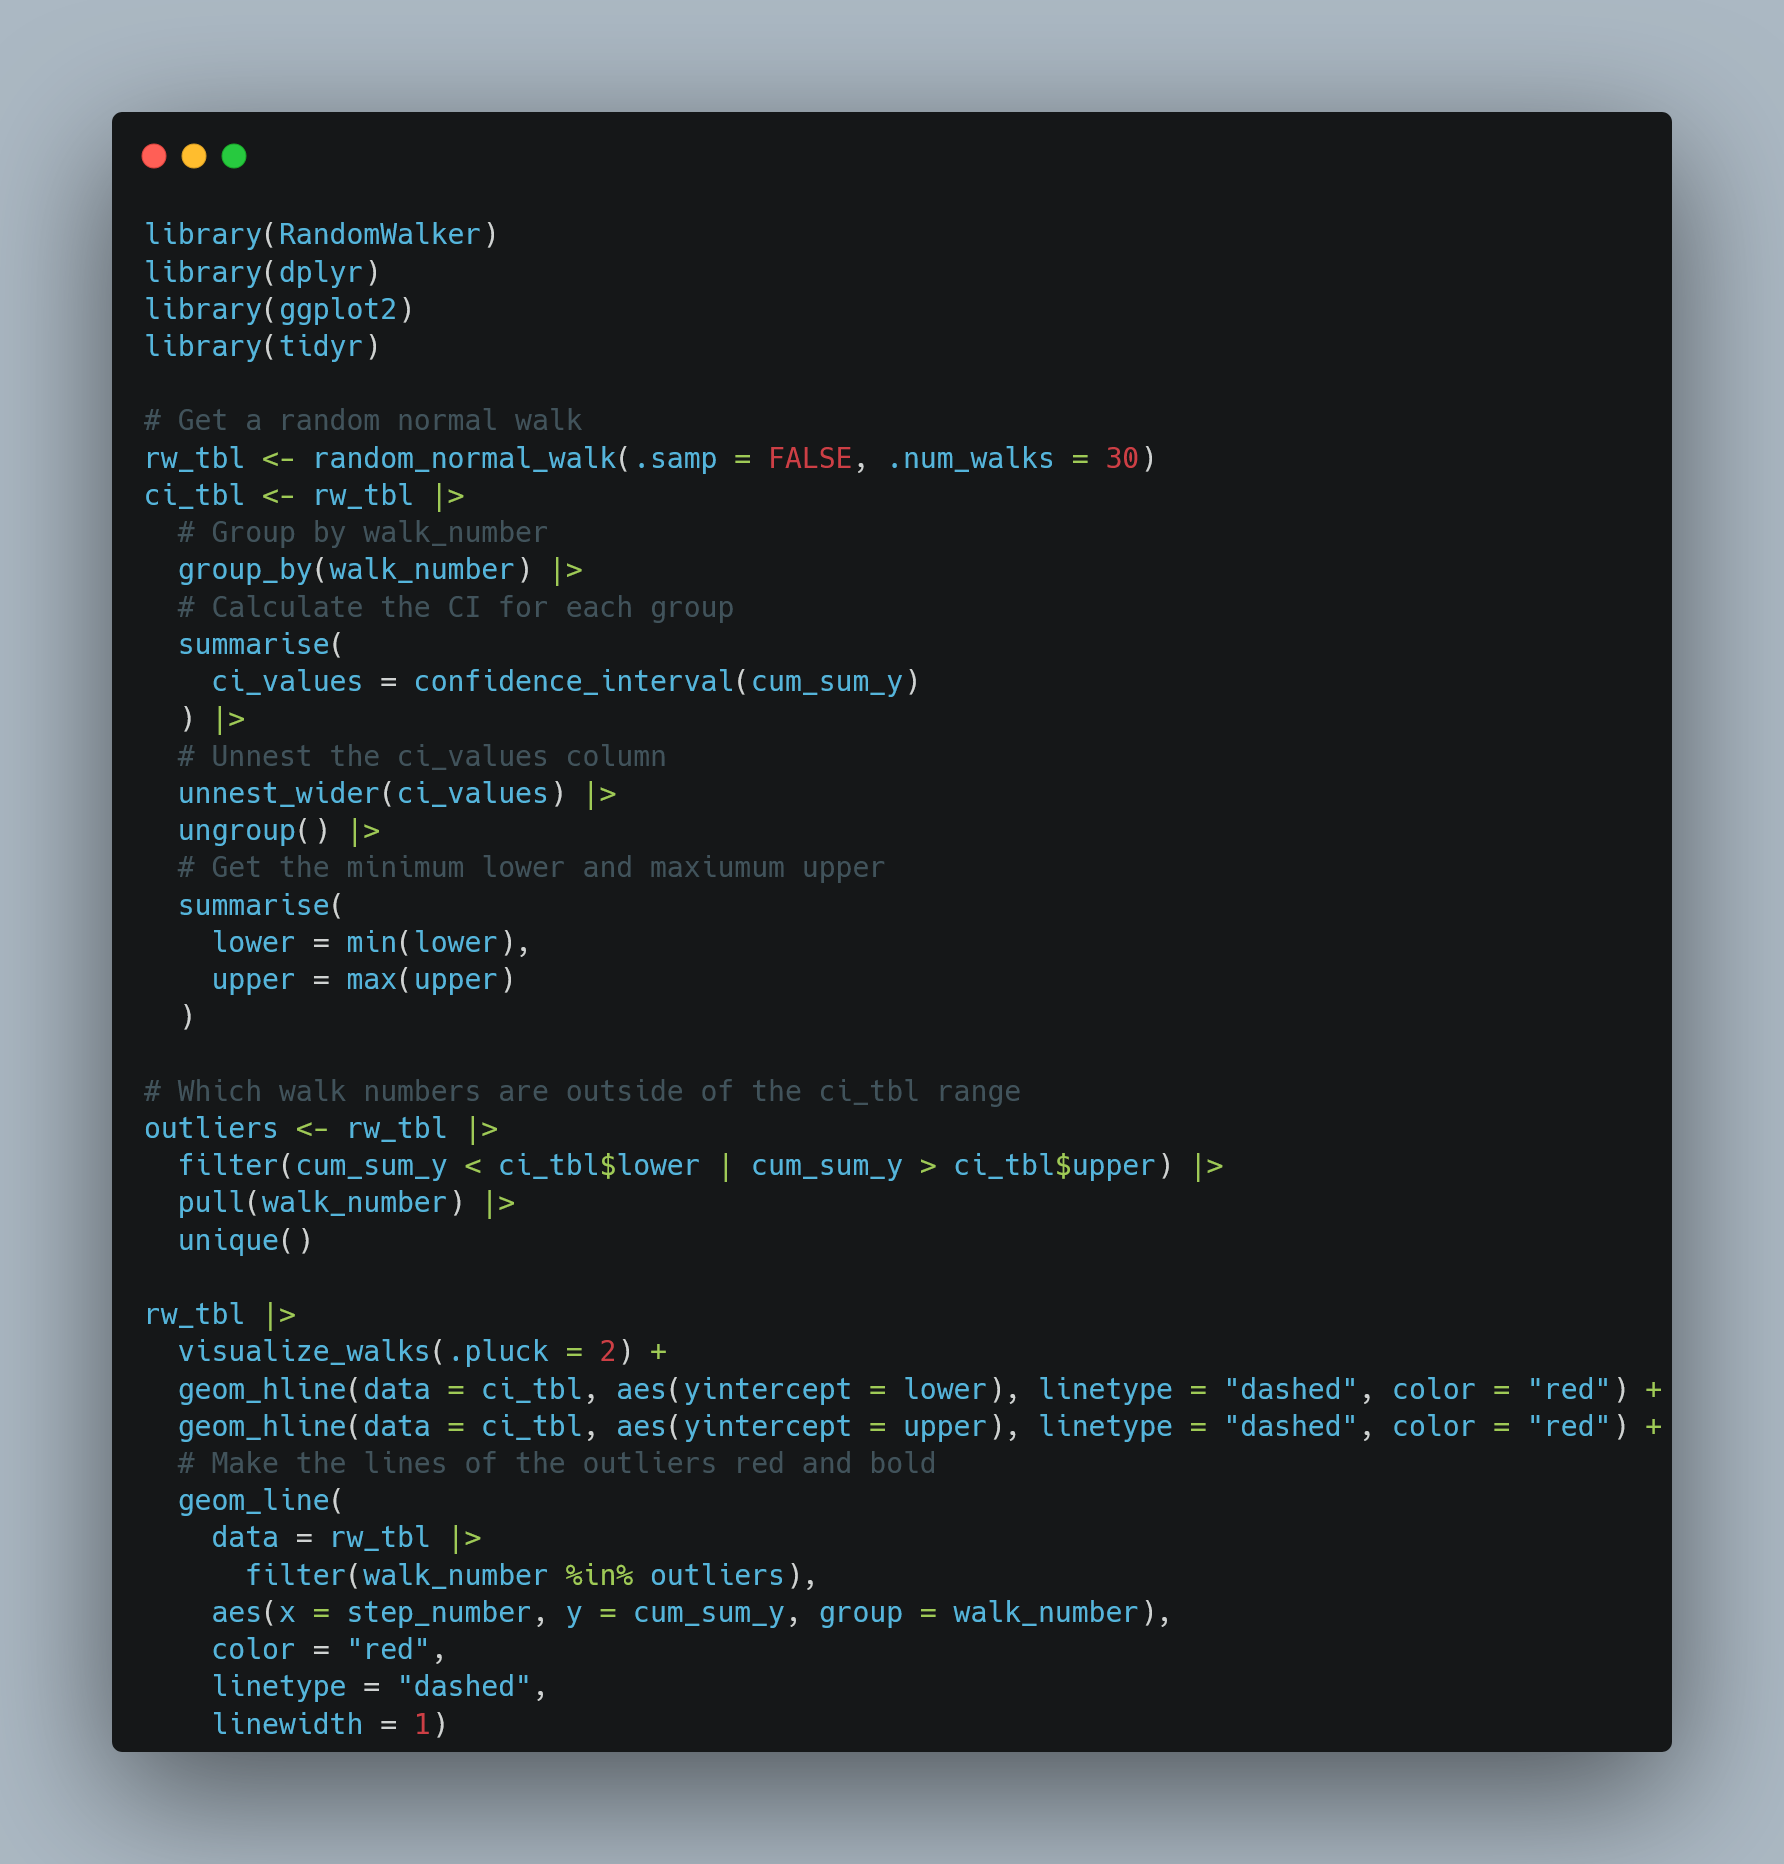
Attached you will see a simple script to generate and visualize a 1D random walk and it's resulting outliers.
If you want to use the C5.0 #algorithm for #Classification you might want to make sure your data is in the right format.
Let my #R package healthyR.ai help you get there.
See an example here: https://www.spsanderson.com/healthyR.ai/reference/hai_c50_data_prepper.html

@unusual_whales you aint kidding
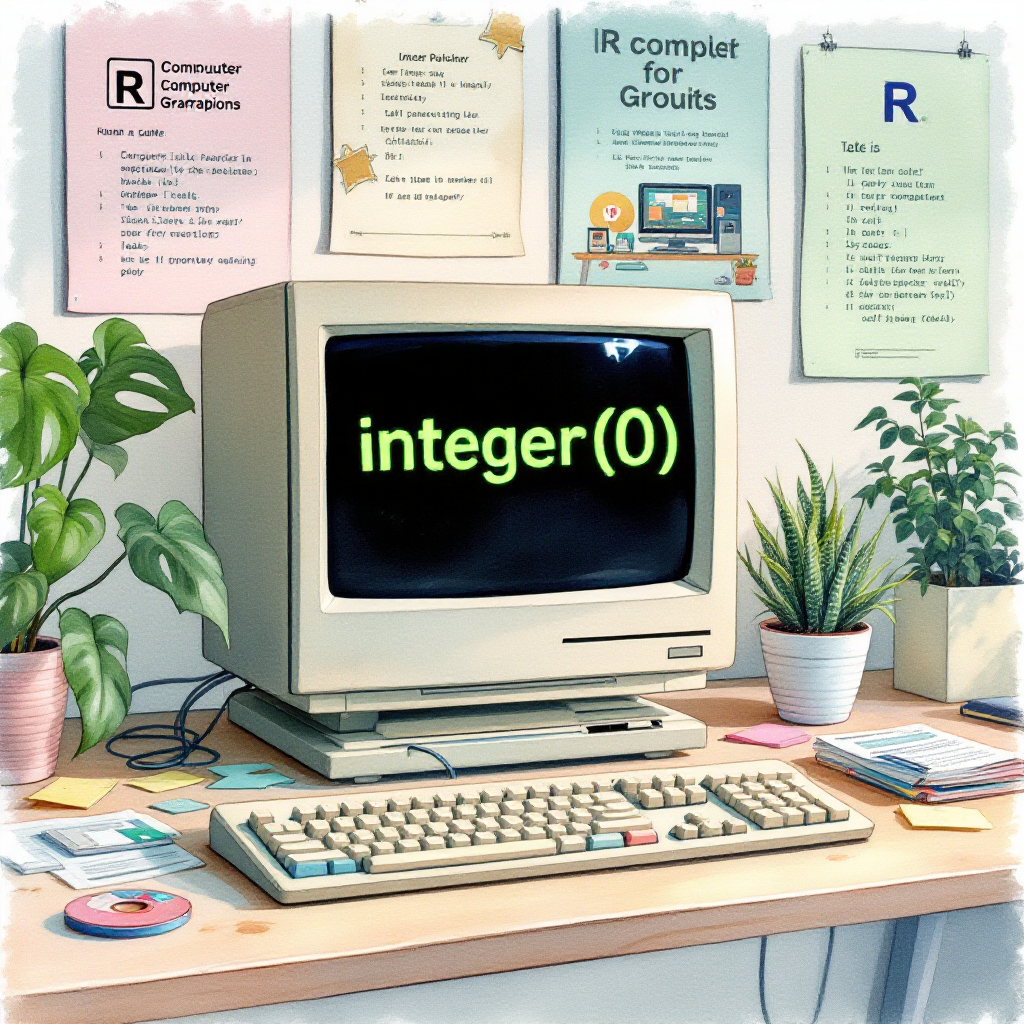
📊 Did you know integer(0) can break your R functions? 💡 Discover best practices for subsetting data frames, handling function returns, and debugging empty vectors. Level up your R programming skills with our detailed guide!
Read more: https://www.spsanderson.com/steveondata/posts/2025-05-12/
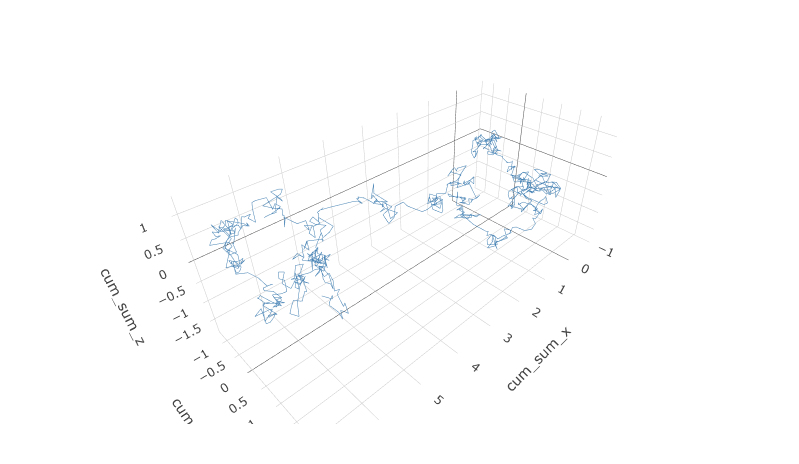
📊 Just released: RandomWalker 0.3.0! Now you can generate random walks in up to 3 dimensions. This is a must-read for R programmers looking to enhance their simulations.
Dive into the details: [https://www.spsanderson.com/steveondata/posts/2025-05-09/
#Data #RLang #Stats #RData #Blog #CRAN #RStats #TimeSeries #RandomWalker