#ACTRIS #ACTRISD @Umweltbundesamt @bmftr_bund @smwk_sn @lfulg
#GAW #EMEP #GUAN @wmo @unileipzig #AC3TR #Klima #Luftqualität
#AC3TR
#Antarktis in #Leipzig: Seit Samstag täglich 10-17 Uhr im #PanometerLeipzig. Herzlichen Dank an #YadegarAsisi & Team !!! / Eindrücke unserer #Wolken-Prof. Mira Pöhlker @unileipzig @TROPOS / @Umweltbundesamt @Leibniz_IfL @leibnizgemeinschaft @TROPOS @stadtleipzig #Klima #Klimakrise #AC3TR #AntarcticaInsync #Polarforschung @bmftr_bund @smwk_sn
Größte #Eiswüste hat die wenigsten #Eiskeime weltweit: neue Beobachtungen tragen zur Erklärung bei, weshalb sich die #Südhemisphäre weniger schnell erwärmt als die #Nordhemisphäre ->https://www.tropos.de/aktuelles/pressemitteilungen/details/groesste-eiswueste-hat-die-wenigsten-eiskeime-weltweit ---- @TROPOS @leibnizgemeinschaft @awi @helmholtz #AntarcticaInSync #Antarktis #AC3TR @dfg_public #RMI #icmcsic #GRL #AGU e2024GL112583


@mias_klimatagebuch Hallo Mia, schön, dass du im Fediverse bist. Wir freuen uns schon auf deine Beiträge. [af] #ac3tr #AC3 #klima #umwelt
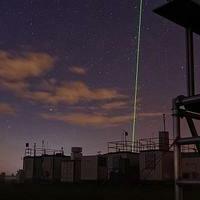
#Wolken über #Antarktis sind „Zuckerwatte“. süßes Geheimnis: Sie sehen nicht nur wie #Zuckerwatte aus – sie bestehen sozusagen daraus! - via @bild.de > https://www.bild.de/news/ausland/forscher-in-der-antarktis-wolken-bestehen-aus-zuckerwatte-687615835198ab3afa872ea3 -- #Klima #SouthernOcean #Antarktis @leibnizgemeinschaft #PS106 #AC3TR @dfg_public #HALO-South
Süße Entdeckung: #Zucker aus dem salzigen #Ozean sind für einen Großteil der #Eiskeime in #Wolken über den abgelegenen #Weltmeeren der #Südhalbkugel verantwortlich > https://www.tropos.de/aktuelles/pressemitteilungen/details/suesse-entdeckung-zucker-aus-dem-salzigen-ozean-sind-fuer-einen-grossteil-der-eiskeime-in-wolken-ueber-den-abgelegenen-weltmeeren-der-suedhalbkugel-verantwortlich / #Klima #SouthernOcean #Antarktis
@leibnizgemeinschaft #PS106 #AC3TR @dfg_public @unileipzig
Find out more about the research consortium about #Arctic amplification #AC3TR that we are part of here https://www.inthefieldstories.net/ac3-project-brings-together-data-sources-to-better-understand-the-arctic/ (full story (pdf) can be found here: https://www.dfn.de/wp-content/uploads/2024/06/DFN-Mitteilungen-105.pdf)

New insights into the formation of tiny #cloud particles in the #Arctic > https://www.tropos.de/en/current-issues/press-releases/details/neue-einblicke-in-das-entstehen-von-kleinsten-partikeln-in-der-arktis https://www.tropos.de/aktuelles/pressemitteilungen/ --- #AIDA @dfg_public #TUBraunschweig @TROPOS_eu #AWIPEV @AWI_media #Climate_Change #Climate #AC3TR #BELUGA #ALADINA
https://nachrichten.idw-online.de/2024/06/20/new-insights-into-the-formation-of-tiny-cloud-particles-in-the-arctic

neue Einblicke in das Entstehen von kleinsten #Wolken-Partikeln in der #Arktis > https://www.tropos.de/aktuelles/pressemitteilungen/ --- #AIDA @dfg_public #TUBraunschweig @TROPOS_de #AWIPEV @AWI_de #Klimawandel #Klima #AC3TR #BELUGA #ALADINA
https://nachrichten.idw-online.de/2024/06/20/neue-einblicke-in-das-entstehen-kleinster-wolkenpartikel-in-der-arktis

Another Graduation! Congratulations to Dr. Alexander Mchedlishvili! He defended his #PhD on understanding #polar atmosphere-ocean-sea ice momentum transfer very successfully! #AC3TR


Congratulations to Dr. Hannah Niehaus from our group! Yesterday, she defended her #PhD on melt ponds in the #Arctic very successfully! #AC3TR


Check out our newly published paper about sea ice–atmosphere drag coefficients from #ICESat-2 laser altimeter topography data, the first monthly pan-Arctic assessment of its kind. #AC3TR @CRiceS_H2020 ➡️ https://tc.copernicus.org/articles/17/4103/2023/

Client Info
Server: https://mastodon.social
Version: 2025.07
Repository: https://github.com/cyevgeniy/lmst