#AudioVisualizer

2024-02-01

#genuary31 - "Generative Audio"

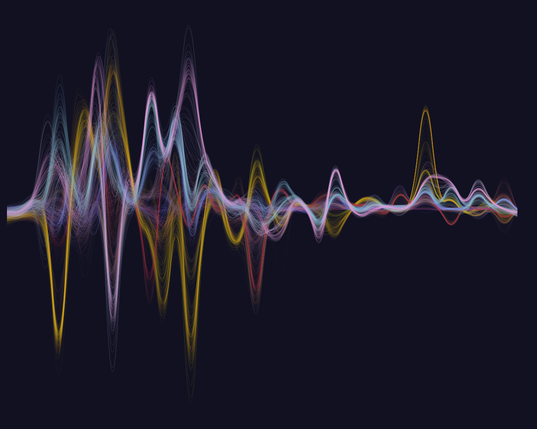
The final day of Genuary is "Generative Audio". Instead of trying to generate an audio clip, I used an audio clip to generate an image. Many different clips within a recording of Beethoven's Pathétique Sonata were passed through an FFT with smoothing and coloring applied.

I've archived all of my Genuary posts on my website: codeismycanvas.art/posts/genua

#genuary #beethoven #audiovisualizer #fft #fouriertransform #generativeart

Overlapping sinusoidal curves, decaying from left to right in orange, pink, blue, and red, representing the frequency spectra of various clips within a recording of Beethoven.
Thu Htoo San :fedora:thuhtoosan@floss.social
2023-10-10

ဒီ audio visualizer ကို တော်တော်လေးသဘောကျနေပြီ!
အရမ်းမိုက်တယ်၊ customize လုပ်လို့ရတာတွေလည်း အများကြီးပဲ။

github.com/jarcode-foss/glava

#GLava #AudioVisualizer #music #visualizer #Linux #GNULinux

2022-05-24

Character VFD Becomes Spectrum Analyzer

These days, streaming services are a great way to listen to music or podcasts on your computer or on the go. However, they lack one feature of the MP3 players and streamers of old: visualizations! [mircemk] is a fan of those, and has built a hardware spectrum analyzer that pumps with the music.

The build relies on a 20×2 character VFD display that looks great, with high brightness and excellent contrast. It can be easily driven from a microcontroller, as it has a controller on board compatible with the typical HD44780 command set. On Arduino platforms, this means the display can easily be driven with the popular LiquidCrystal library.

The Arduino Nano inside takes in the audio signal via its analog inputs. It then processes the audio with the fix_fft library, which runs a Fast Fourier Transform in order to figure out the energy level of each frequency bin in the audio spectrum for both the left and right channels. This data is then sent to the screen for display. It's impressively fast and smooth, with the display dancing along with the beat nicely as [mircemk] tests it out with some tunes.

If it looks familiar, it's because it's an updated version of a prior project from [mircemk]. We saw it previously as a VU meter that pulsed with the beat, an altogether simpler visualization but still a cool one. Video after the break.

#homeentertainmenthacks #audiovisualizer #spectrumanalyzer #visualizer
image
2022-05-13

Big Audio Visualizer Pumps With The Music

A spectrum analyzer is a great way to create exciting visuals that pulse in time with music. [pyrograf] wanted a big one as a display piece, so set about whipping up something of their very own.

An ESP32 microcontroller serves as the heart of the build, with its high clock rate and dual cores making it a highly capable choice for the job. Audio from a microphone is amplified and pumped into the ESP32's analog input. Core 0 on the ESP32 then runs a Fast Fourier Transform on the input audio in order to determine the energy in each frequency band. The results of this FFT are then passed to Core 1, which is used to calculate the required animations and pipe them out to a series of WS2812B LEDs.

Where this build really shines, though, is in the actual construction. Big chunks of acrylic serve as diffusers for the LEDs which light up each segment of the spectrum display. Combine the big pixel size with a nice smooth 30 Hz refresh rate on the LEDs, and the result is a rather large spectrum analyzer that really does look the business.

We've seen some similar builds over the years, too. Video after the break.

#musicalhacks #audiovisualizer #led #leds #spectrumanalyzer #ws2812b

2021-12-08

An Easy Music Visualizer With the Arduino Nano

Flashing LEDs are all well and good, but they're even better if they can sync up with ambient sounds or music. [mircemk] has built the LUMAZOID visualizer to do just that, relying on some staple maker components to do so.

The build is open-source, and designed to work with strings of 60, 120, or 180 WS2812B LEDs. An Arduino Nano is charged with running the show, capturing audio via its analog-to-digital converter. A sensitivity pot enables the input level to be set appropriately.

From there, a Fast Fourier Transform is taken, providing data on the intensity of the audio in various frequency bins. The LUMAZOID can be set up to respond to just bass or to all frequencies as a whole. This data is then used to pulse the LEDs in time with the beat.

It's a fun project that demonstrates the basic techniques required to build an audio-reactive visualizer. We've seen some other great builds in this space before, too. Video after the break.

#mischacks #audiovisualizer #led #musicvisualization

image
2021-04-18

The trade-free app of the day:

Astrofox

https://www.tromjaro.com/astrofox/

Astrofox is a free, open-source motion graphics program that lets you turn your audio into custom, shareable videos. Combine text, images, animations and effects to create stunning, unique visuals. Then generate high-definition videos to share with your fans on social media.

AMAMJAUBBAMAMJAUBB
2019-05-27

We just made a sample page with soundcloud API. It could be fun to release only on web browser our pieces with visualizer..
.

Client Info

Server: https://mastodon.social
Version: 2025.04
Repository: https://github.com/cyevgeniy/lmst