#PyQtGraph

dr ๐Ÿ› ๏ธ๐Ÿ›ฐ๏ธ๐Ÿ“ก๐ŸŽง:blobfoxcomputer:davidr@hachyderm.io
2025-06-06

#dataviz is critical, but I don't think in pictures, I think in spatial relations and movement (is this an #adhd thing?)

Movement happens in time and you usually want to viz the time axis all at once, so I've trained myself to turn "$variable vs t" into mental motion

Other times you need an interactive #ux and that usually means 3D

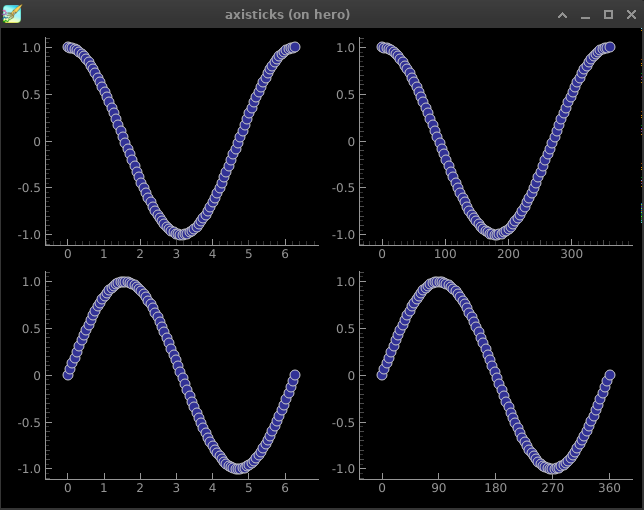
I love love love #pyqtgraph for #python plotting but they will be the first to tell you the 3D needs some love

My punfully-named work project has proved to be a hit[1] and I managed to get an 30y-experienced #software #developer *with an #astronomy degree* assigned to it. (This is a #space application)

She agreed that the 3D portion was neat but hard to use. She found #vtk, which seems to be the perfect partner because it does 3D really well, stays out of 2D and has a #pyqt connector.

I just worked through a tutorial and, yeah, this could be a huge breakthrough in my viz apps.

[1]They think they want to change the pun name but they are wrong. An unforgettable name is money in the bank.

2025-06-04

@glob_god FWIW the next release is having some major performance improvements on 3D plots (one of the regular contributors took it upon himself to learn some OpenGL and made the library much better for it).

#PyQtGraph definitely seems to have a niche in the experimental science/engineering fields for sure.

How did you come across the library to begin with?

dr ๐Ÿ› ๏ธ๐Ÿ›ฐ๏ธ๐Ÿ“ก๐ŸŽง:blobfoxcomputer:davidr@hachyderm.io
2025-05-02

I've been working on a #space #visualization tool for our operators. It basically needs to always know, and be ready to plot, where every single one of 60k+ objects is down to millidegree/meter/second resolution just in case the sensor suddenly slews there

My own constraint is that it has to be 1) a single 2) #python executable because otherwise I'm not interested

Earlier this year, I found a great 30x faster technique for determining which #satellites are above the horizon. (In fact, it's far more general than that, but that's all the help it gives me to this problem.)

I also realized I could spawn a #multiprocessing child to do lookahead on data and then pass a huge #numpy array to my graphing process. (Investigated ~9 different ways, chose the best)

But there I was stuck.

At any given moment, there are ~4500 space objects above the horizon (at our latitude). Putting 4500 points with little persistence trails and labels and then updating all that at 1Hz let alone the 10Hz I'd like was taking too long, even using the amazing #pyqtgraph

So there I was stuck. Until this week.

2025-04-25

@melissawm given how long itโ€™s been since the first season, I may re-watch that first. โ€ฆ that said, Iโ€™m on the verge of a #PyQtGraph release that I really should get out the door

2025-03-11

@mcc I maintain #PyQtGraph ; and I canโ€™t tell you how many issues I identify if I try and pretend like I am a complete newcomer, donโ€™t look at past examples but look at the docs and try and plow forward.

2025-03-05

Next minor task since I'm waiting on feedback for #PyQtGraph changes I'm trying to make; try and implement Custom sections in numpydoc (see: github.com/numpy/numpydoc/issu ).

I should note, I have no idea how sphinx extensions work, but this feature would be very useful to #PyQtGraph and judging by the number of linked issues, quite a few other libraries.

2025-02-28

Do you use #PyQtGraph with conda versions of #PySide bindings? Then this issue is very relevant to you. Please upvote:

bugreports.qt.io/plugins/servl

2025-02-26

The next release of #PyQtGraph will likely be the last release to support PySide2. If this will impact you negatively, please reach out.

2025-02-25

We have recently merged into the repo a new on of #OpenGL related improvements, mostly for 3D, but PColorMeshItem got some love too. If you use #PyQtGraph for 3D visualization, weโ€™d love to hear back from you.

2025-02-23

Every time I update the sphinx theme for #PyQtGraph I get a different CSS coloring issue.

For the record, I'm throwing no shade at the theme maintainers, it's not their fault that I'm probably modifying the underlying CSS in a way that is so bizarre that nobody that has any resemblance of knowing what they're doing would do ๐Ÿ˜‚

dr ๐Ÿ› ๏ธ๐Ÿ›ฐ๏ธ๐Ÿ“ก๐ŸŽง:blobfoxcomputer:davidr@hachyderm.io
2025-02-09

Prompt: Black on black.

(I deliberately skipped Prompt 3, "Exactly 42 lines of code." which seemed both too constricting and not constricting enough.)

#genuary #genuary2025 #genuary4 #python #pyqtgraph

dr ๐Ÿ› ๏ธ๐Ÿ›ฐ๏ธ๐Ÿ“ก๐ŸŽง:blobfoxcomputer:davidr@hachyderm.io
2025-02-06

#genuary

Layers upon layers upon layers.

I still like the basic idea here, but I couldn't make it work on multiple levels (how ironic).

I spent several hours trying to understand how color compositing works in general and in #qt in particular. I kind of got something fragile sort-of working.

When I gave up on Making It Perfect, I realized that looping a blizzard is unlikely to work.

Welp. This is a #learning #python #pyqtgraph project anyway and that goal was accomplished.

#genuary2025 #genuary2

2025-02-02

@davidr FYI #PyQtGraph has an issue with thick lines (>1px) and partial alpha. If the QPen instance has partial alpha, we can't use our fast "drawLines" codepath, and are stuck with "drawPathโ€, which performs _terribly_ with >1px lines. If you're plotting static plots, you may not notice, but if you're doing anything that updates frequently, you're likely to have problems.

dr ๐Ÿ› ๏ธ๐Ÿ›ฐ๏ธ๐Ÿ“ก๐ŸŽง:blobfoxcomputer:davidr@hachyderm.io
2025-02-02

So. I want to #pyqtgraph plot some colored items with medium alphas and then overlap them to produce the usual kindergarten color wheel results.

But it turns out that #pyqt only supports compositing in the RGB #color space.

In fact, the Wikipedia article makes it sound like alpha blending is only even *defined* for RGB. Which I guess makes sense for speed reasons, but I'd still expect some way to put in a callback or whatever for a custom mode.

I guess what I'll do it do all the HSV and compositing work in a #python #numpy array and the convert to an RGB image and display it that way...?

Unless there's a better idea?

dr ๐Ÿ› ๏ธ๐Ÿ›ฐ๏ธ๐Ÿ“ก๐ŸŽง:blobfoxcomputer:davidr@hachyderm.io
2025-02-01

It's February 1 and you know what that means!

#GENUARY!!

This is my first ever entry. Prompt is "Vertical or horizontal lines only."

#genuary2025 #genuary1 #python #pyqtgraph

dr ๐Ÿ› ๏ธ๐Ÿ›ฐ๏ธ๐Ÿ“ก๐ŸŽง:blobfoxcomputer:davidr@hachyderm.io
2025-01-20

ooooookaaaayyyyy!!!

Got the ticks #python #code working for "numbers" and "angles" (where the difference is what constitutes a "nice" value)

Just now made a #pyqtgraph with 4 subplots. Two default axes, two custom axes using "my" #algorithm for tick generation, one for "numbers" and one for "angles".

Very, very reasonable behavior! (bottom row is custom ticks) (I know radians are still technically angles, but that's not the point)(I just realized I should have called that feature "degrees" not "angles")

One potential upgrade is to compute something for minor ticks. How do I....oh, those are probably the next lower mantissa! Except for snow removal I have nothing else to do today, so....

four plots of sine and cosine. the top default row computes axis ticks normaly. the angles in particular are in steps of 100, which isn't natural for degrees. 

The bottom row is custom ticks. The "numbers" plot has identical values at this zoom level. The "angles" plot is stepped by 90 degrees, which makes more sense.
2025-01-19

@villares if youโ€™re wanting live plot updates thatโ€™s sort of #PyQtGraph โ€˜s thing. I will freely admit that pyqtgraph does not have the plotting customization that matplotlib does but itโ€™s very straight forward to integrate into a Qt application.

dr ๐Ÿ› ๏ธ๐Ÿ›ฐ๏ธ๐Ÿ“ก๐ŸŽง:blobfoxcomputer:davidr@hachyderm.io
2025-01-17

W H E W i finally did it

- created my own polar graph in #pyqtgraph

- created a subclass that maps azimuth to theta (easy) and elevation to R (not hard, but not necessarily obvious for stereographic projection)

- used that to re-implement the faulty graph I made like....6 years ago? also had to find and rewrite a bunch of code to use a great-circle distance from a point rather than azimuth/elevation ranges #python #space #math

The original toot in this chain is from 1/3, so that's exactly two weeks of A B S O L U T E P A N I C on my part

I mean, it was my bug. And it's kind of a dumb bug. And it has been keeping me from my regular #coding and also from doing a good job as a #mentor for the super-fresh new-hire

But it's really #adhd #rsd perfectionism/terror that drove me for these two weeks. I could barely think straight. I should probably note this at my adhd evaluation on 1/30.

dr ๐Ÿ› ๏ธ๐Ÿ›ฐ๏ธ๐Ÿ“ก๐ŸŽง:blobfoxcomputer:davidr@hachyderm.io
2024-11-10

I write #software at the intersection of #space, #signalprocessing and #radar. I've learned a LOT, but the radar is the fuzziest bc it's the hardest to hands-on learn on your own

Just found this great series about a #diy #sdr radar

youtube.com/watch?v=igrN_wd_g7

(I'm doing the $200 level, not the $3k)

Extra cool sidenote, it's coded in #python and uses #pyqtgraph for exactly the reason I've switched from #matplotlib--it's 1000x faster and more versatile

2024-10-13

When you have a holiday and decide to merge ~13 PRs in #PyQtGraph

My apologies to the contributors that waited quite some time for feedback or the PR to be merged.

Client Info

Server: https://mastodon.social
Version: 2025.04
Repository: https://github.com/cyevgeniy/lmst