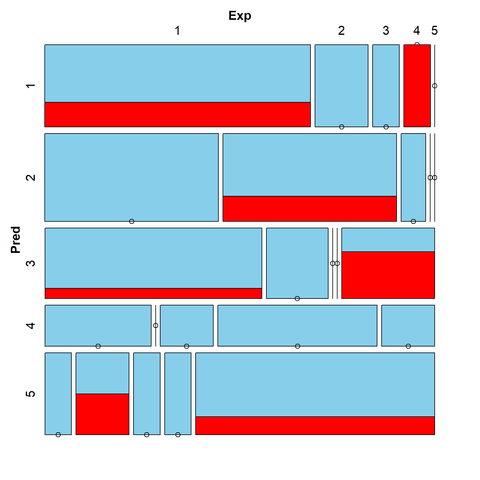
When working with missing data, understanding the patterns and relationships of missing values across variables is essential for accurate and effective data analysis.
The attached mosaic plot, created using the mosaicMiss function, provides a clear depiction of missing values within a data set.
For more information on the VIM package, visit the official vignette here: https://cran.r-project.org/web/packages/VIM/vignettes/VIM.html
Further details: https://statisticsglobe.com/online-workshop-missing-data-imputation-r


