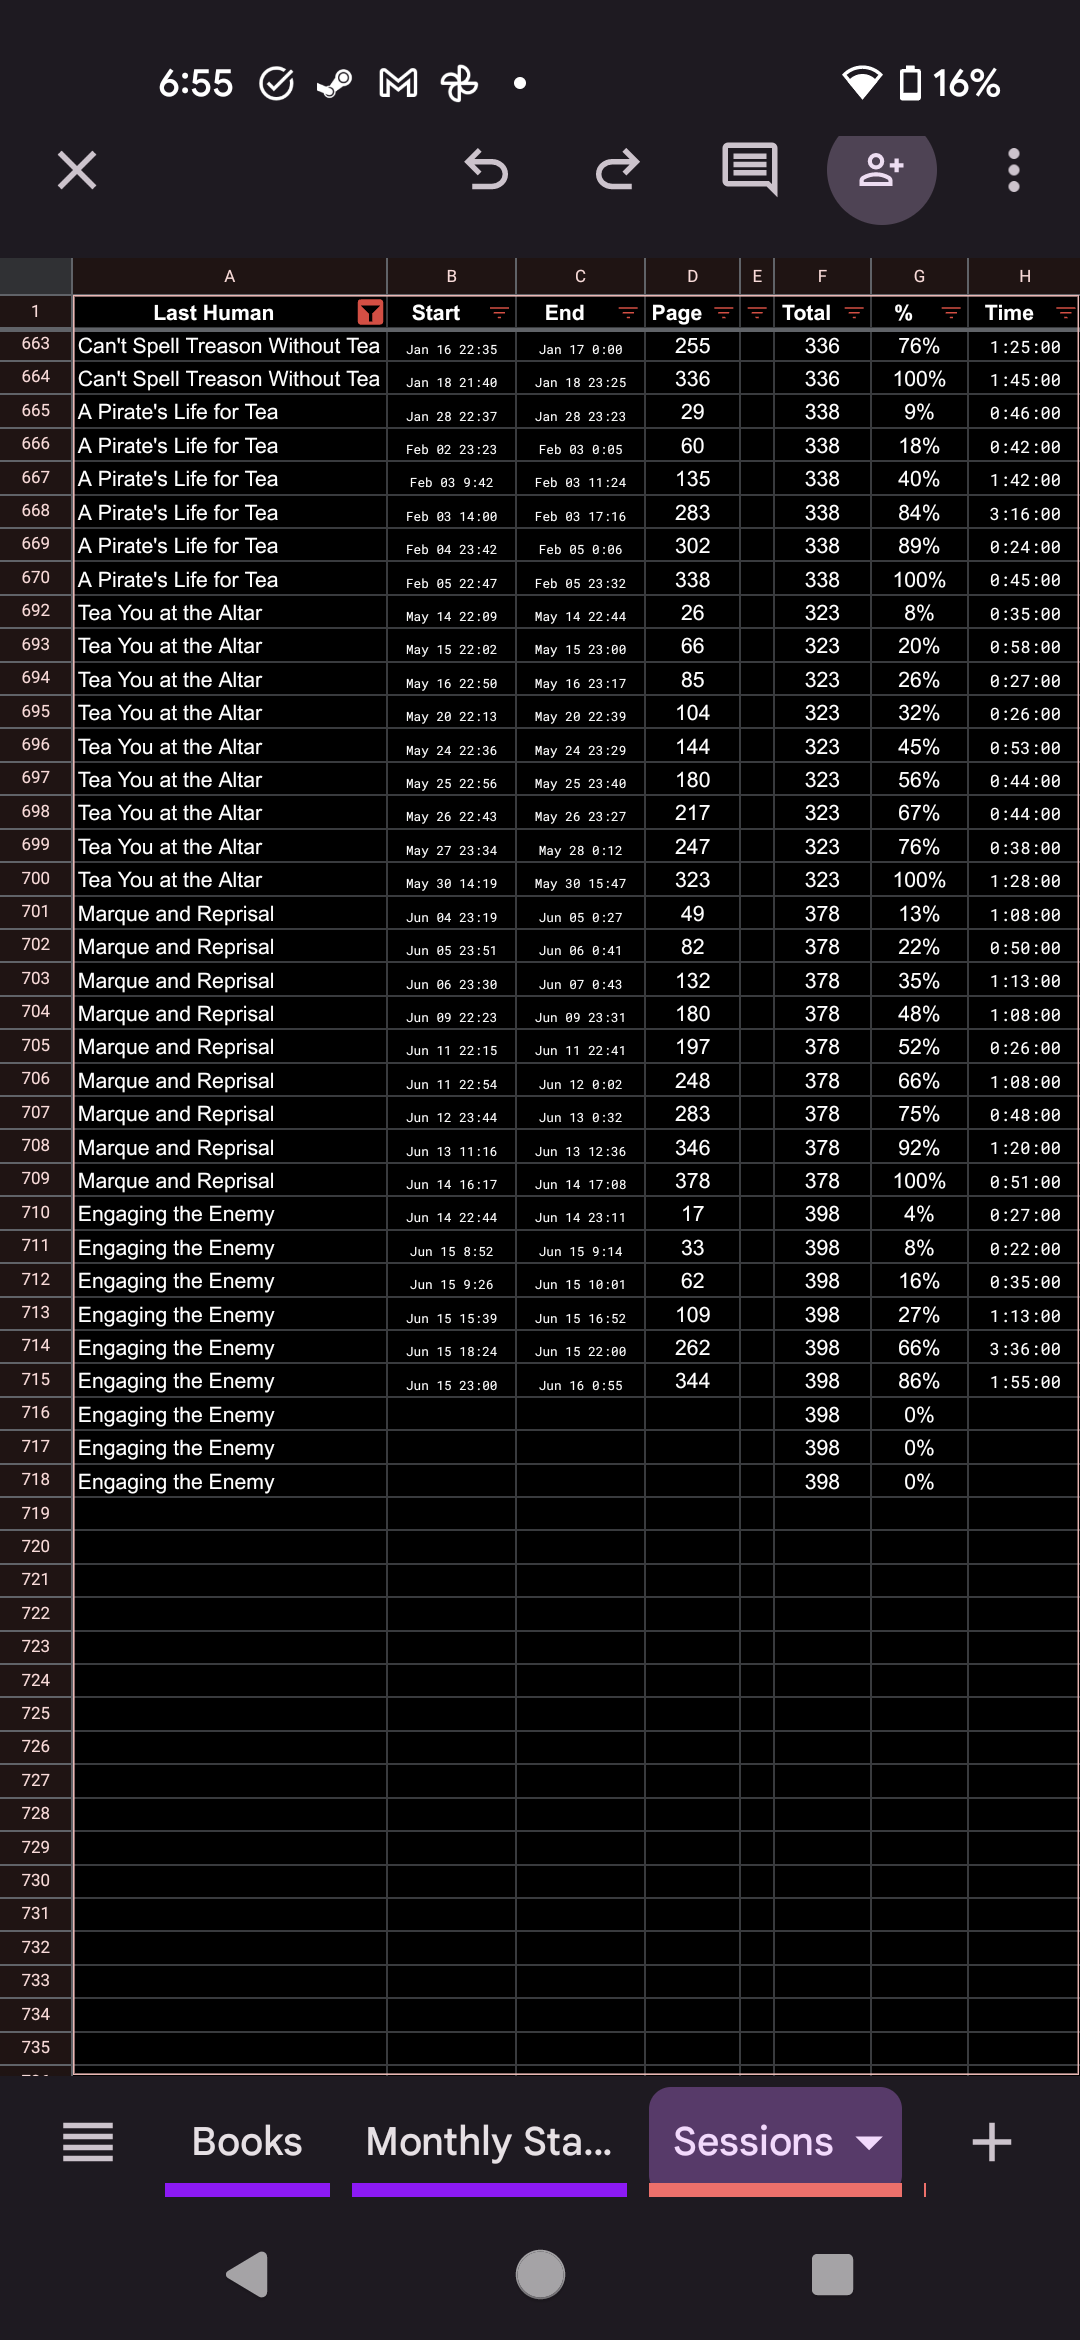
And yes, I know all this detail...
#dataisbeautiful

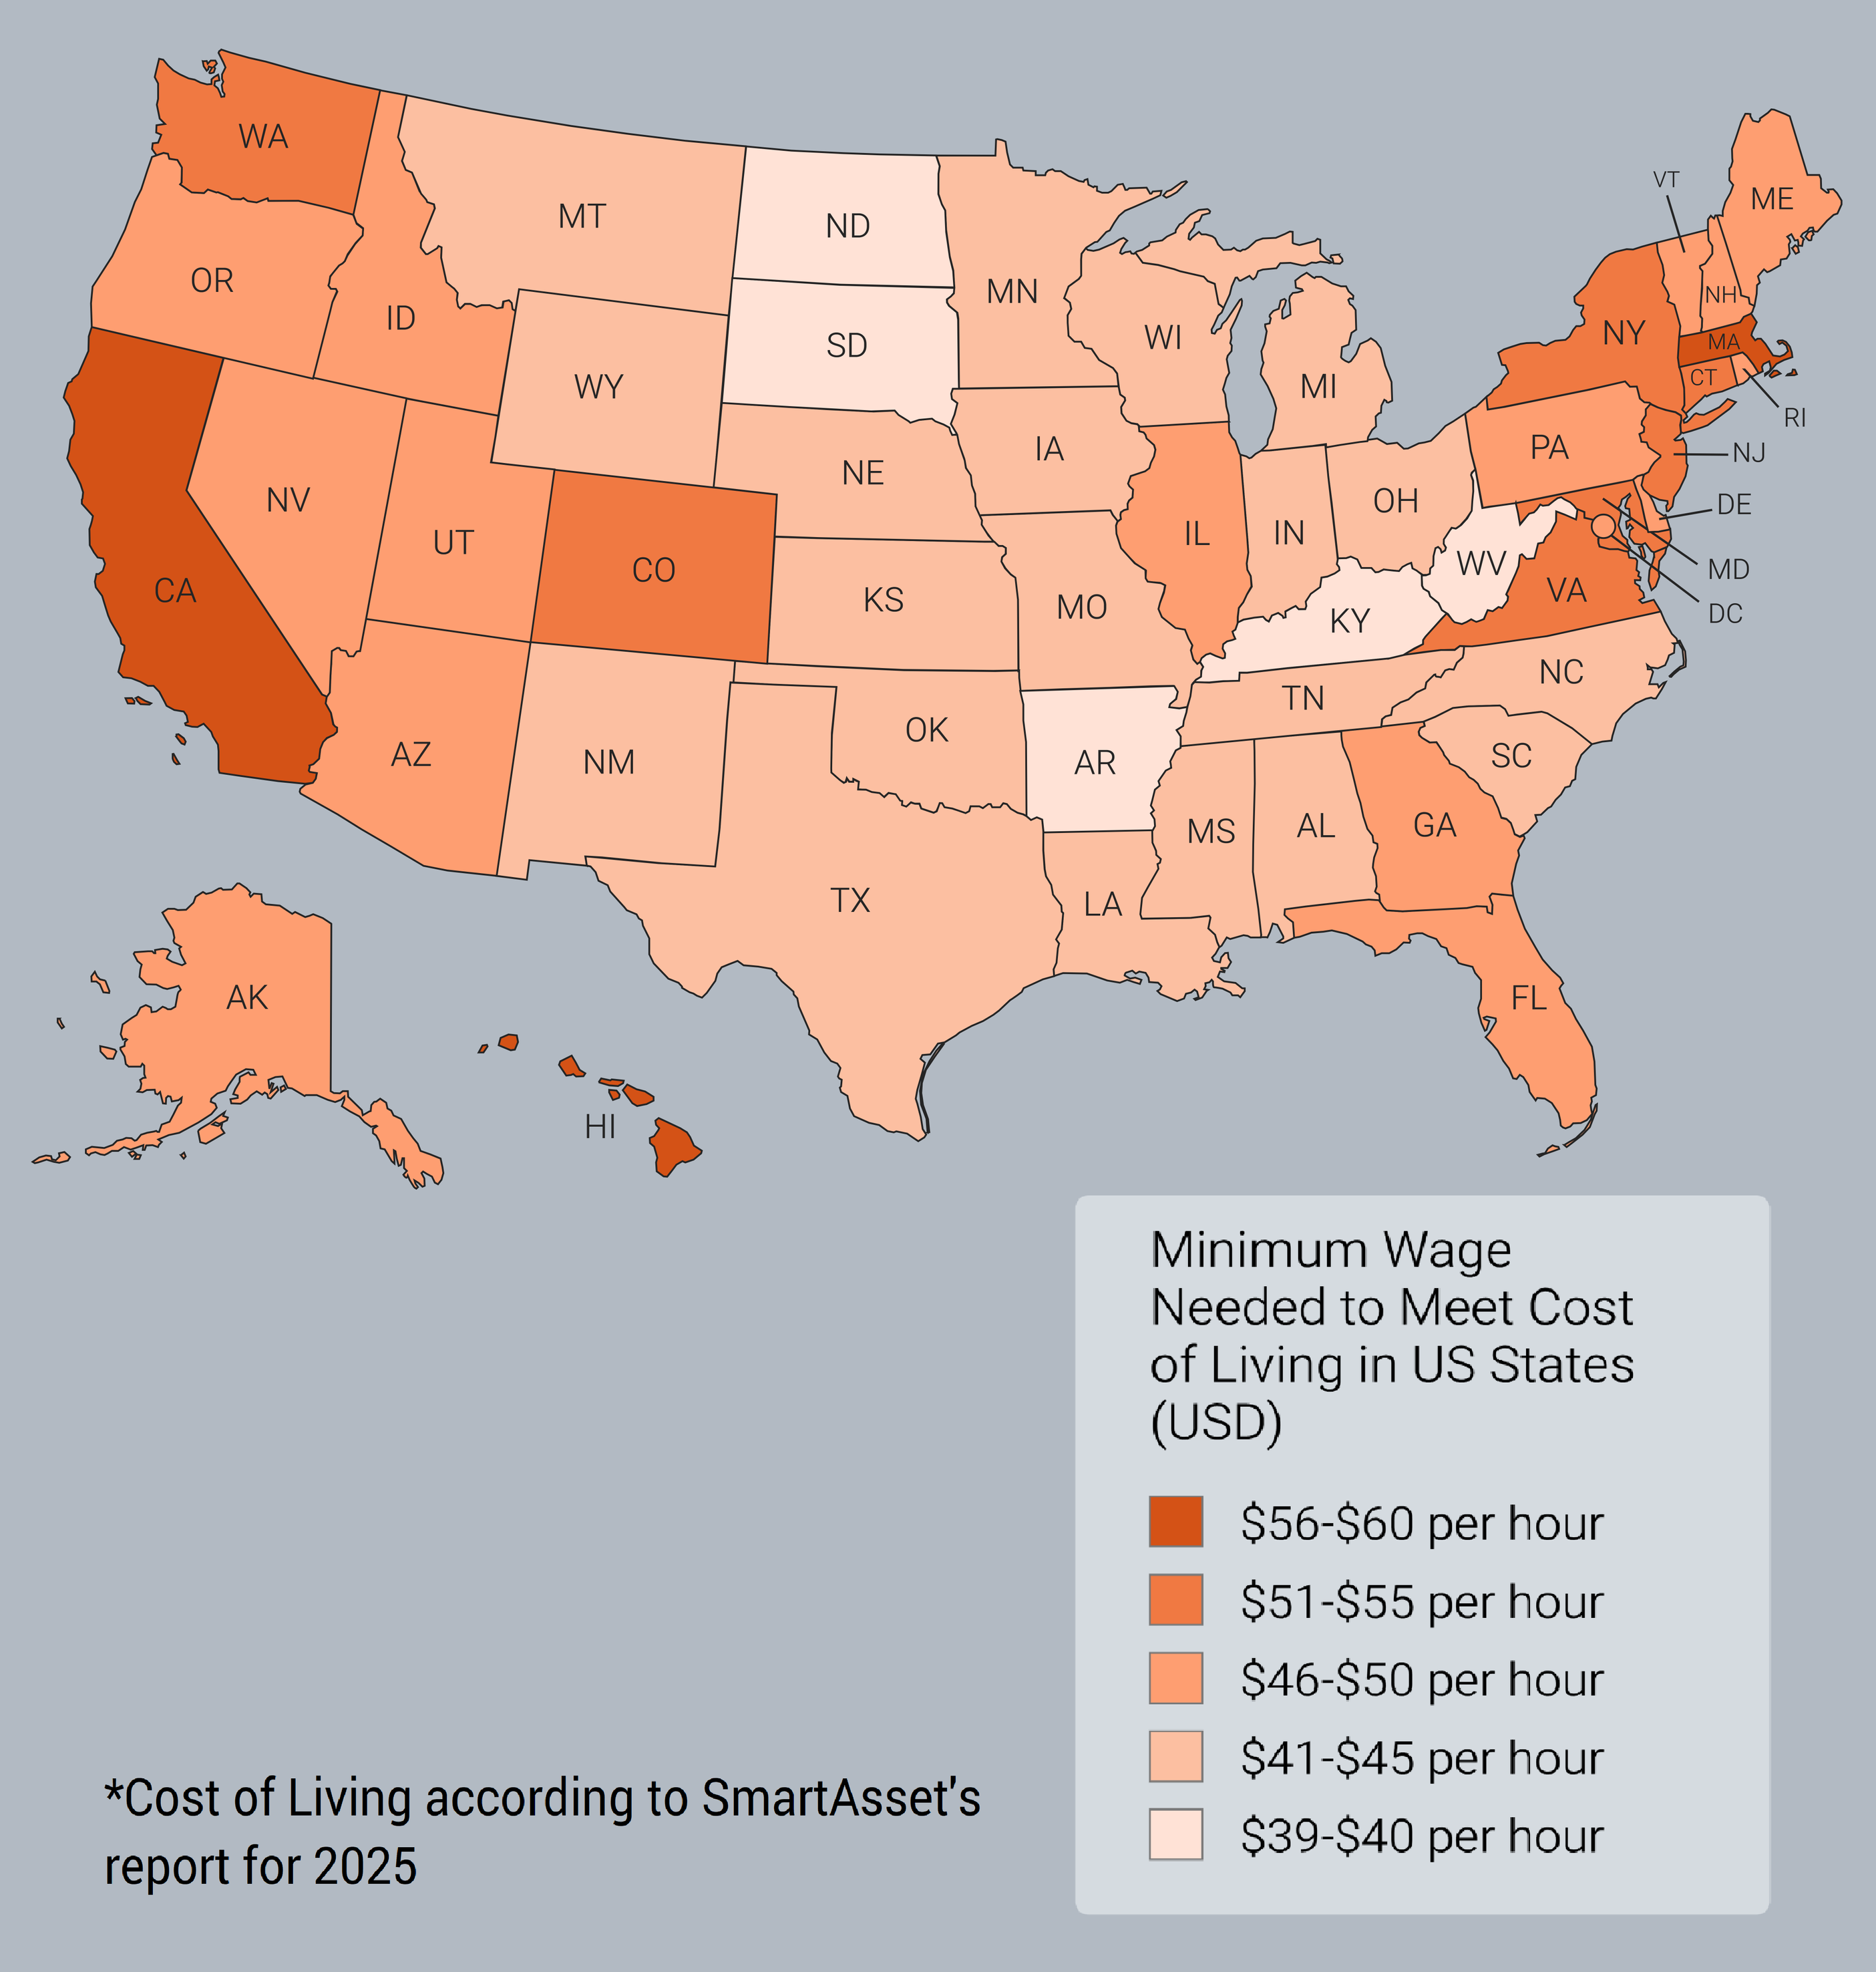
Minimum Wage Needed to Meet Cost of Living in US States (OC)
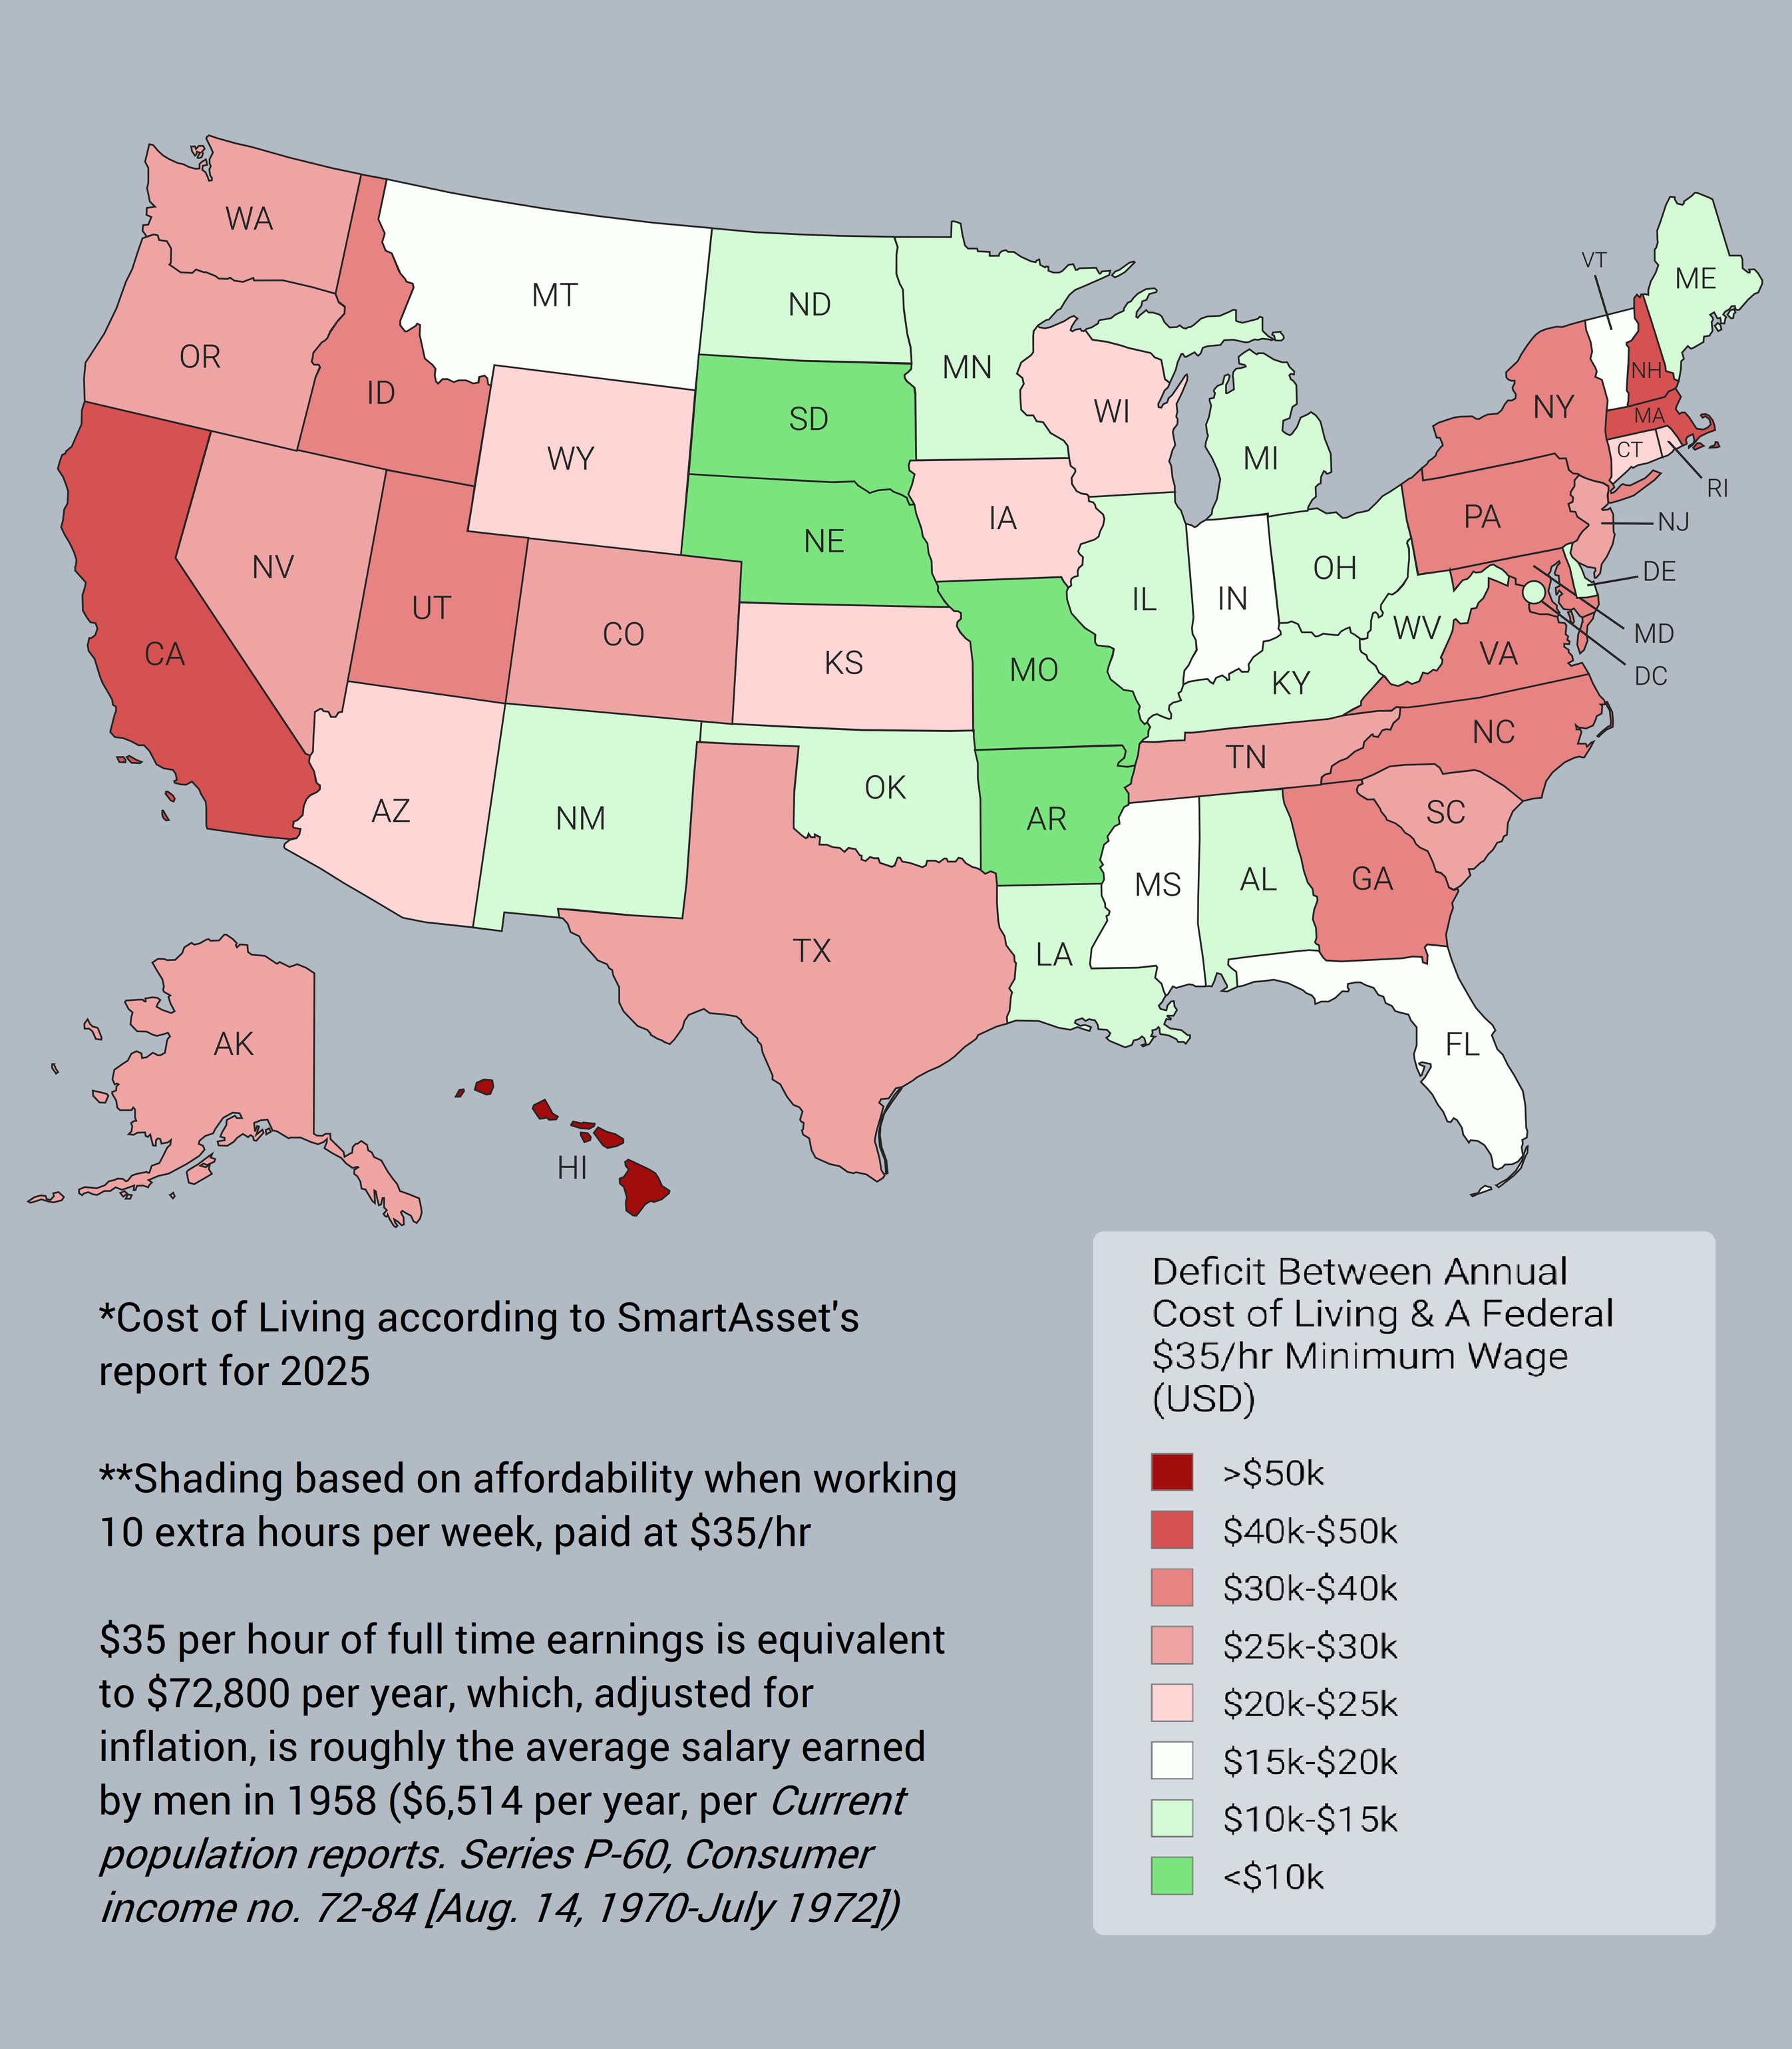
Deficit Between a $35/hr Federal Minimum Wage and Cost of Living of US States
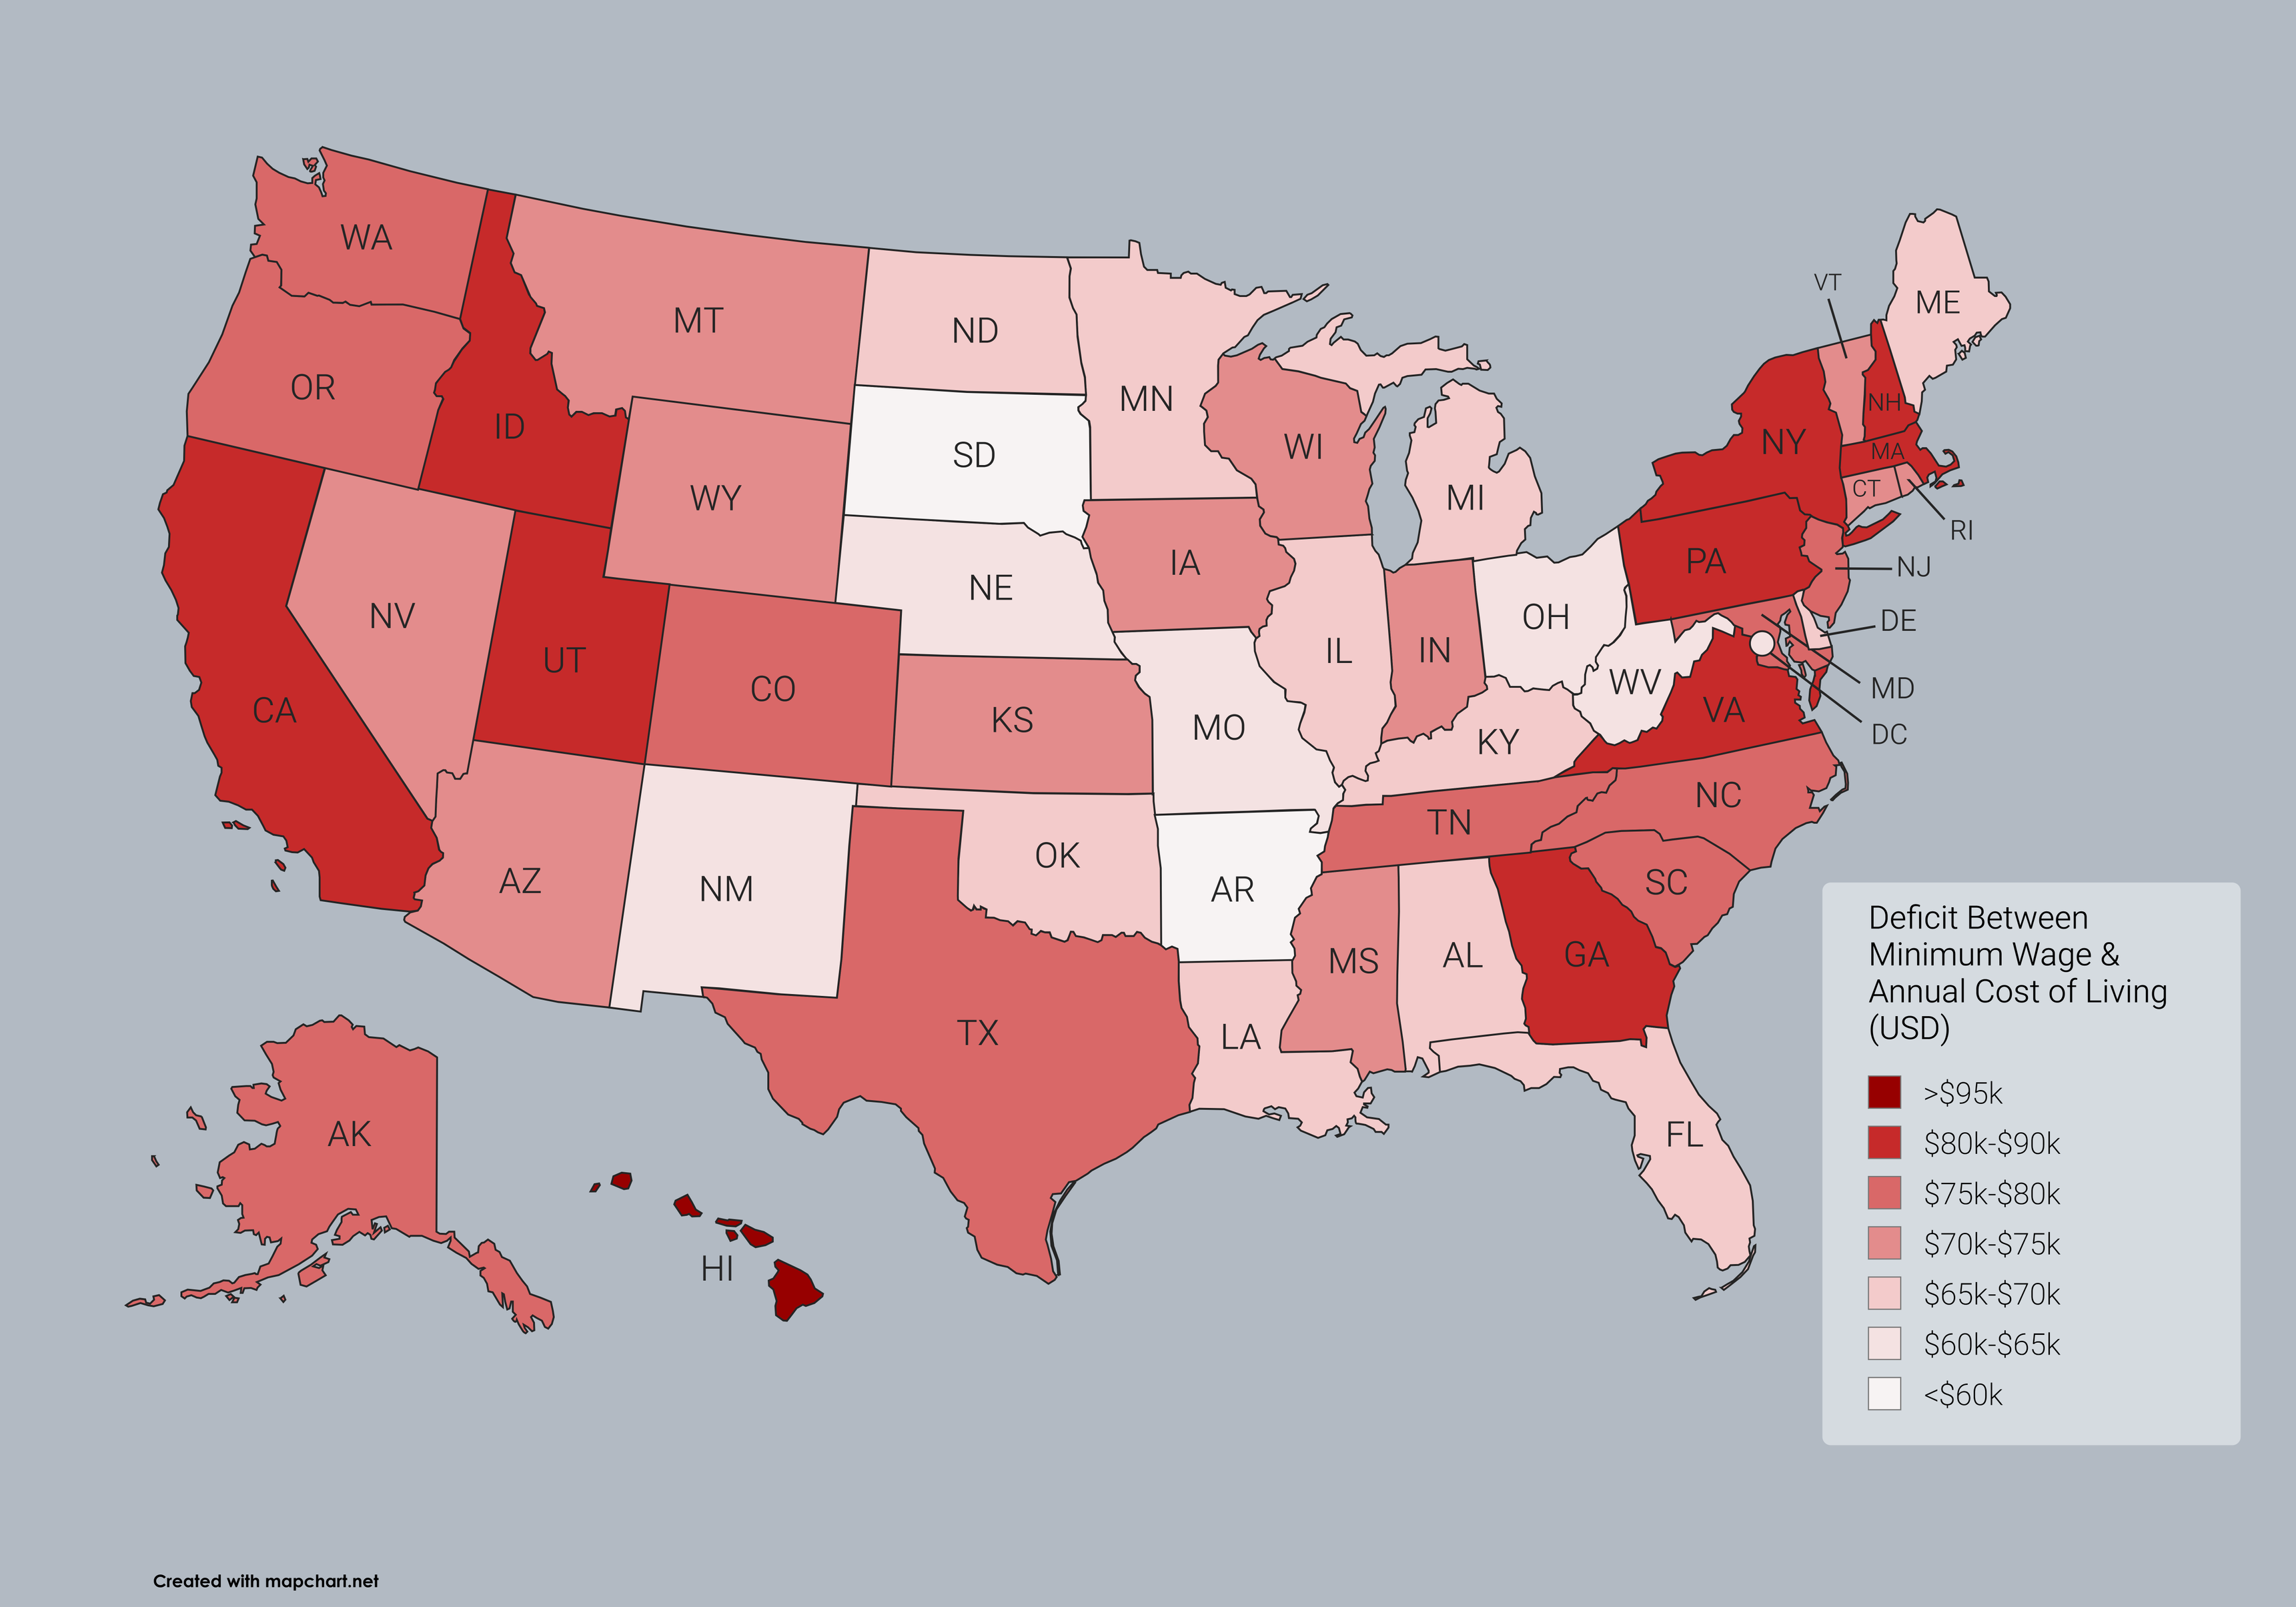
Deficit Between Minimum Wage and Annual Cost of Living of US States (OC)
Announcing new features: better interactive maps
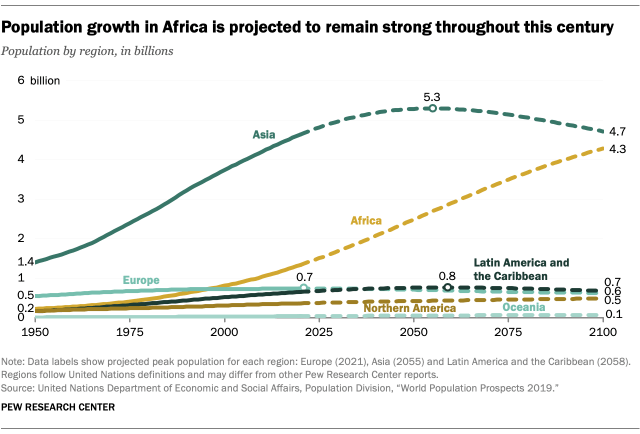
Seems we (USA + Europe) are going to be completely irrelevant by the end of the century
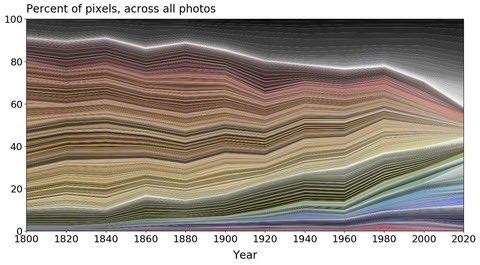
Percent of pixels, across all photos.
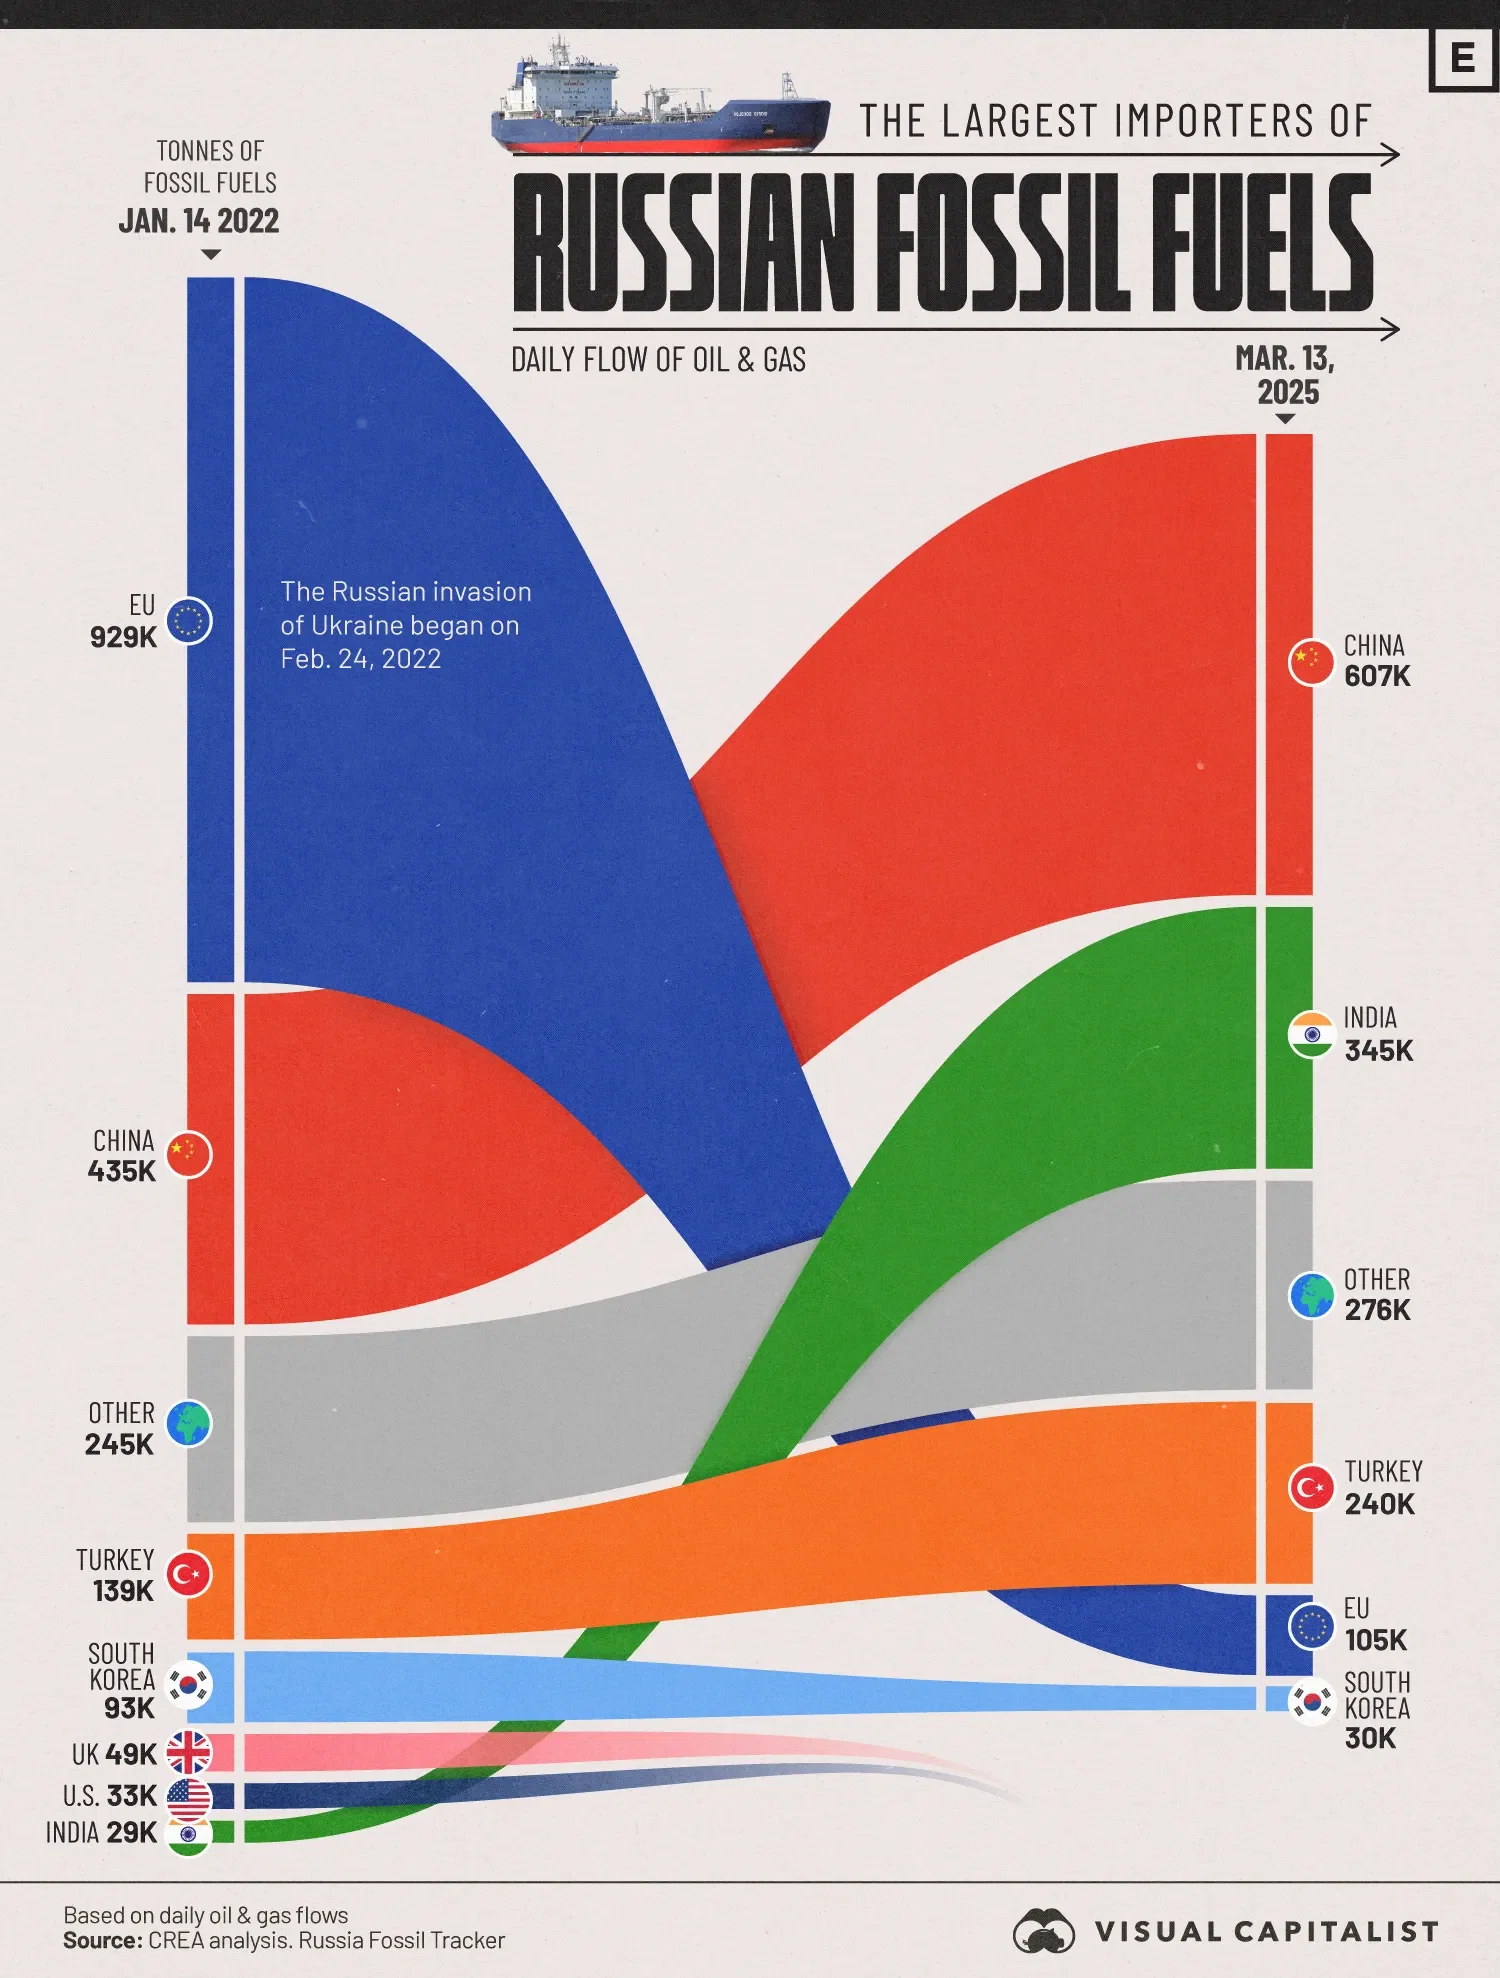
How the Largest Importers of Russian Fossil Fuels Have Changed (2022 vs. 2025)
Timeline of Linux Distributions
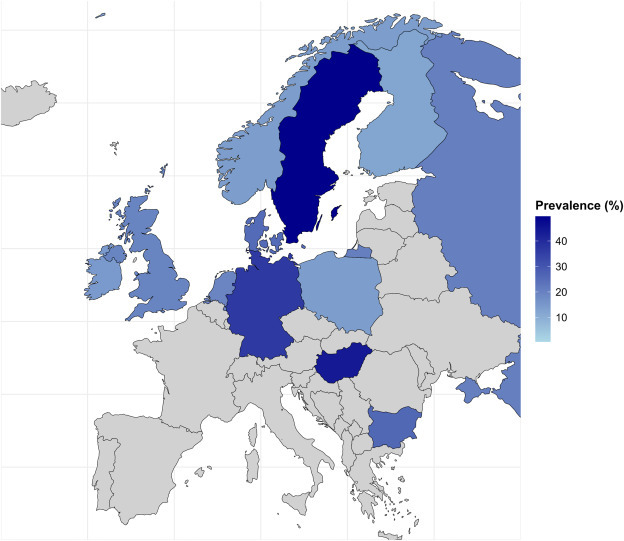
Pooled prevalence of myopia [(near-sightedness)] in Europe by country. Countries shown in grey were not included in the meta-analysis due to lack of eligible prevalence data
I needed an excuse to make a word cloud shaped like a brain and I finally found one. Who said dreams don’t come true?
But in all seriousness, I learned a couple of things about how to work with text data, especially short text across multiple languages and I’ve shared that here:
https://neurofrontiers.blog/how-people-find-us/
#WordCloud #TextData #DataAnalysis #DataIsBeautiful #multilingual
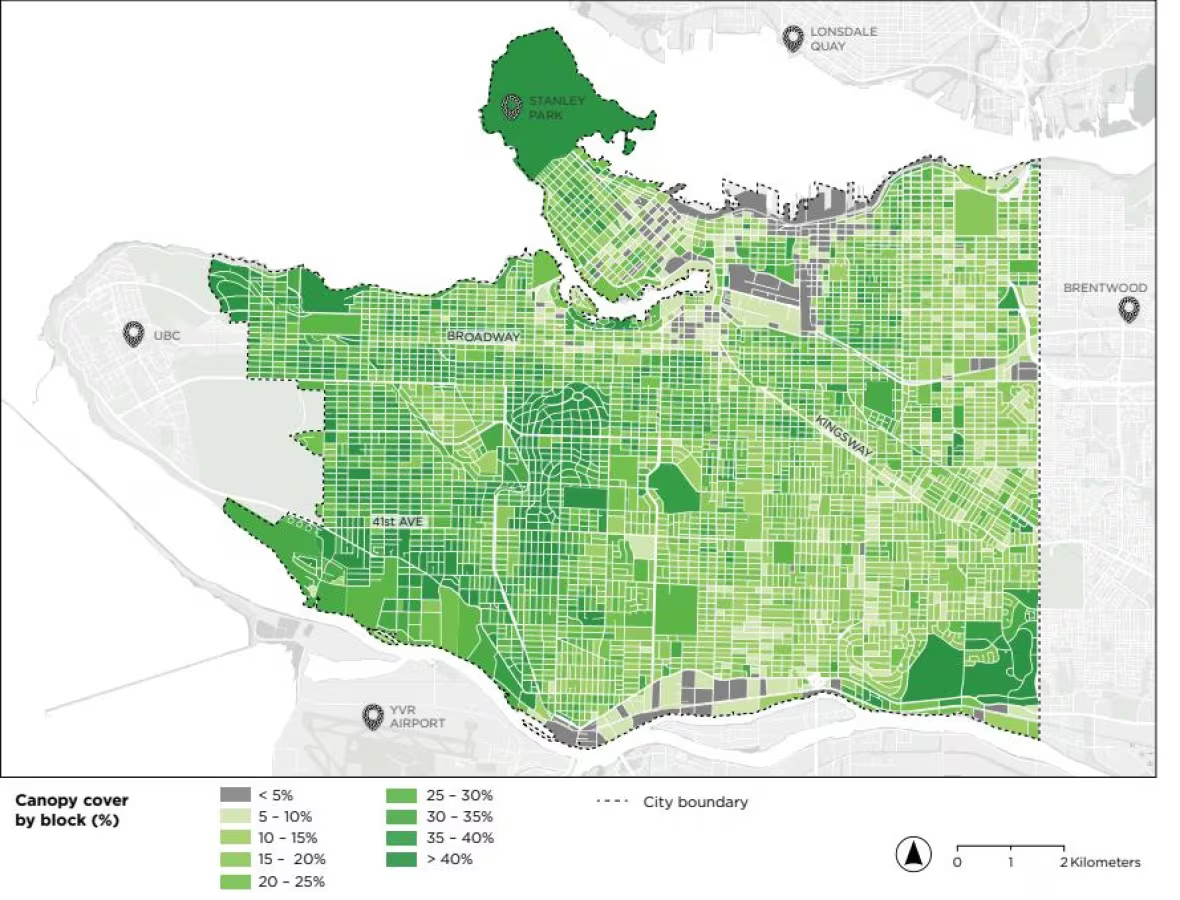
A map of Vancouver's canopy cover, how it relates to equity around heat waves, and potential issues around targets for development & green spaces
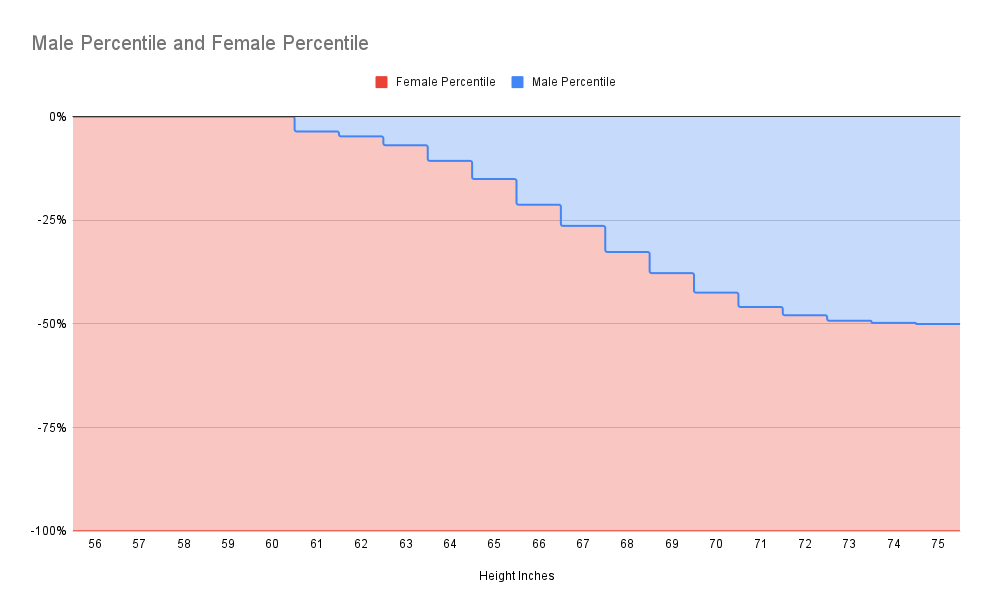
[OC] Adult male and female US height percentile by inch
[4] Thirdly, as a computational infectious disease modeler I spend a lot of time infecting fake populations in order to more completely understand #disease #transmission. Vaccinating high risk people alone cripples the protection this policy claims to desire. I could stand on a soapbox for months, but I will spare you and instead direct you to a great tool surprisingly published by #nyt (7 -gift article link).
#transmission #infection #modeling #statistics #dataisbeautiful
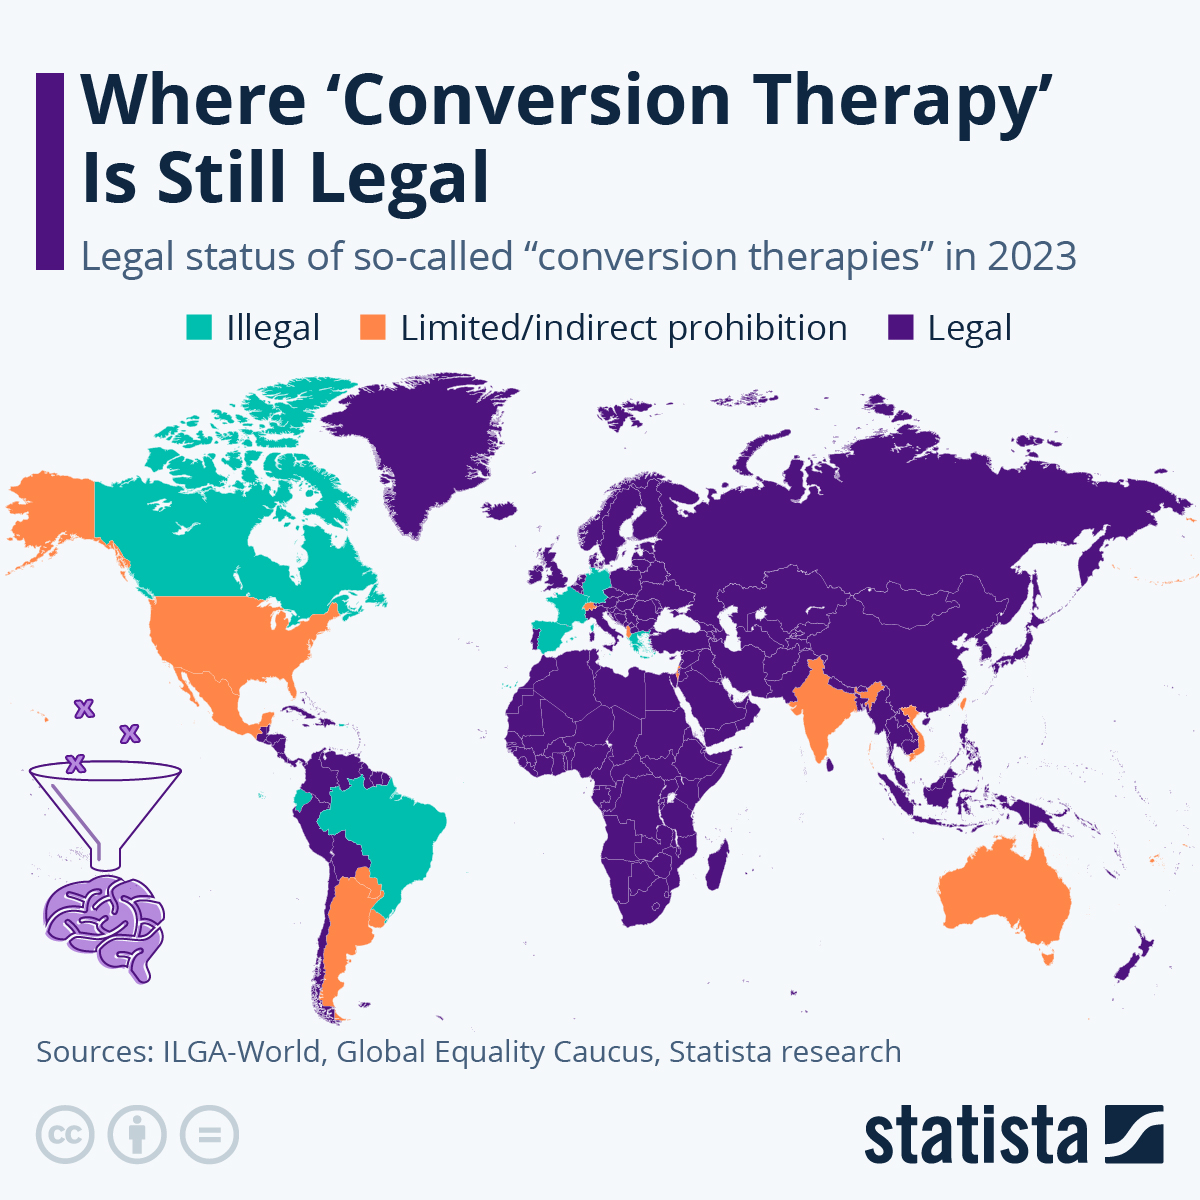
Countries where "Conversion Therapy" is still legal
Sangeet evaluation of how dating apps use the data to match you along with some great visualizations here and there.
A fascinating and approachable way to see #DOGE and other government spending in perspective. In short, the cuts are for show, even if they have real effects. Like a household cutting the #netflix subscription to only allow a single screen at a time for the next year, while removing the person watching how much is spent monthly and stopping the acceptance of overtime pay for the primary earner.
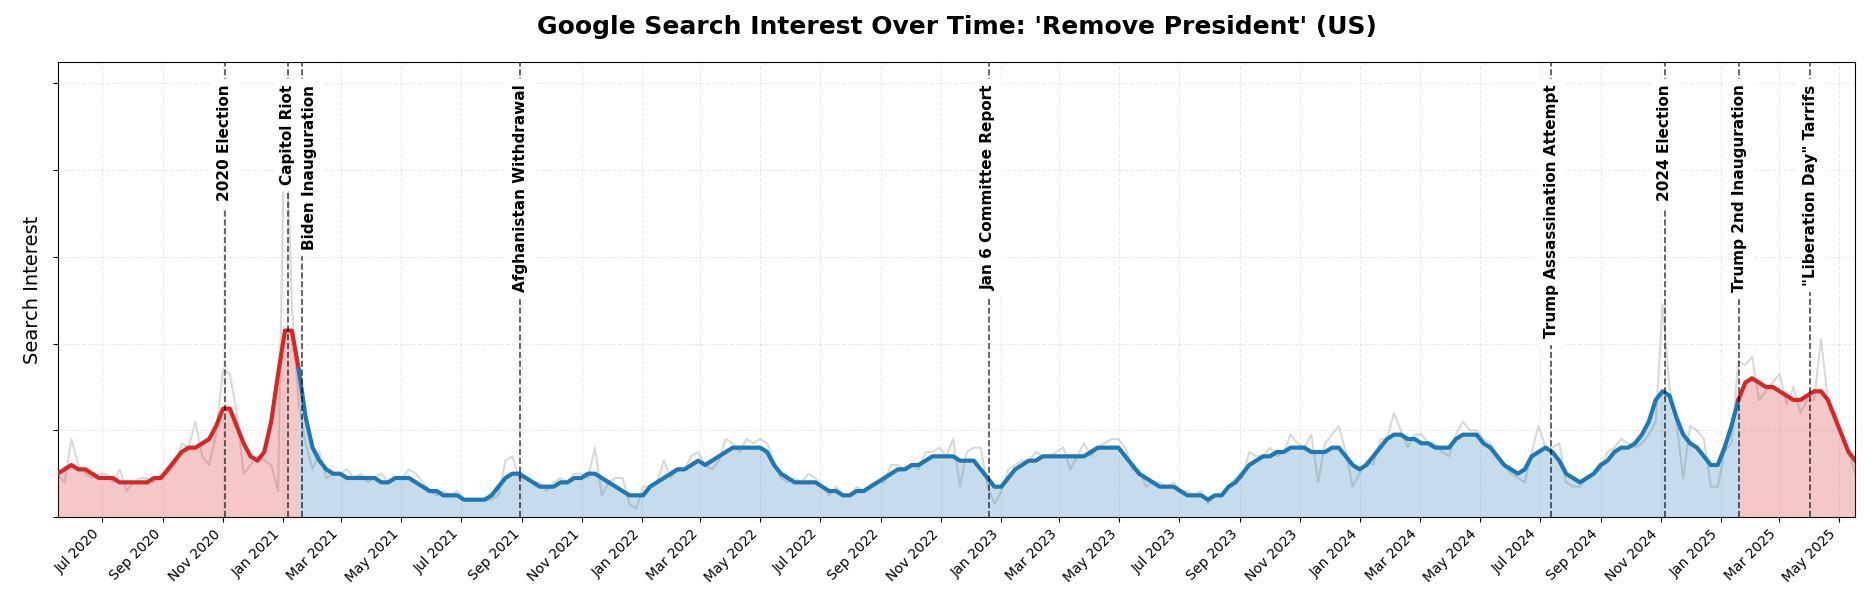
Here’s Google search interest for “remove president” from 2020 to 2025.
#googletrends #google #removepresident #president #trump #biden #datascience #dataisbeautiful #visualization #politics #jan6 #graph #plot #matplotlib
Client Info
Server: https://mastodon.social
Version: 2025.04
Repository: https://github.com/cyevgeniy/lmst