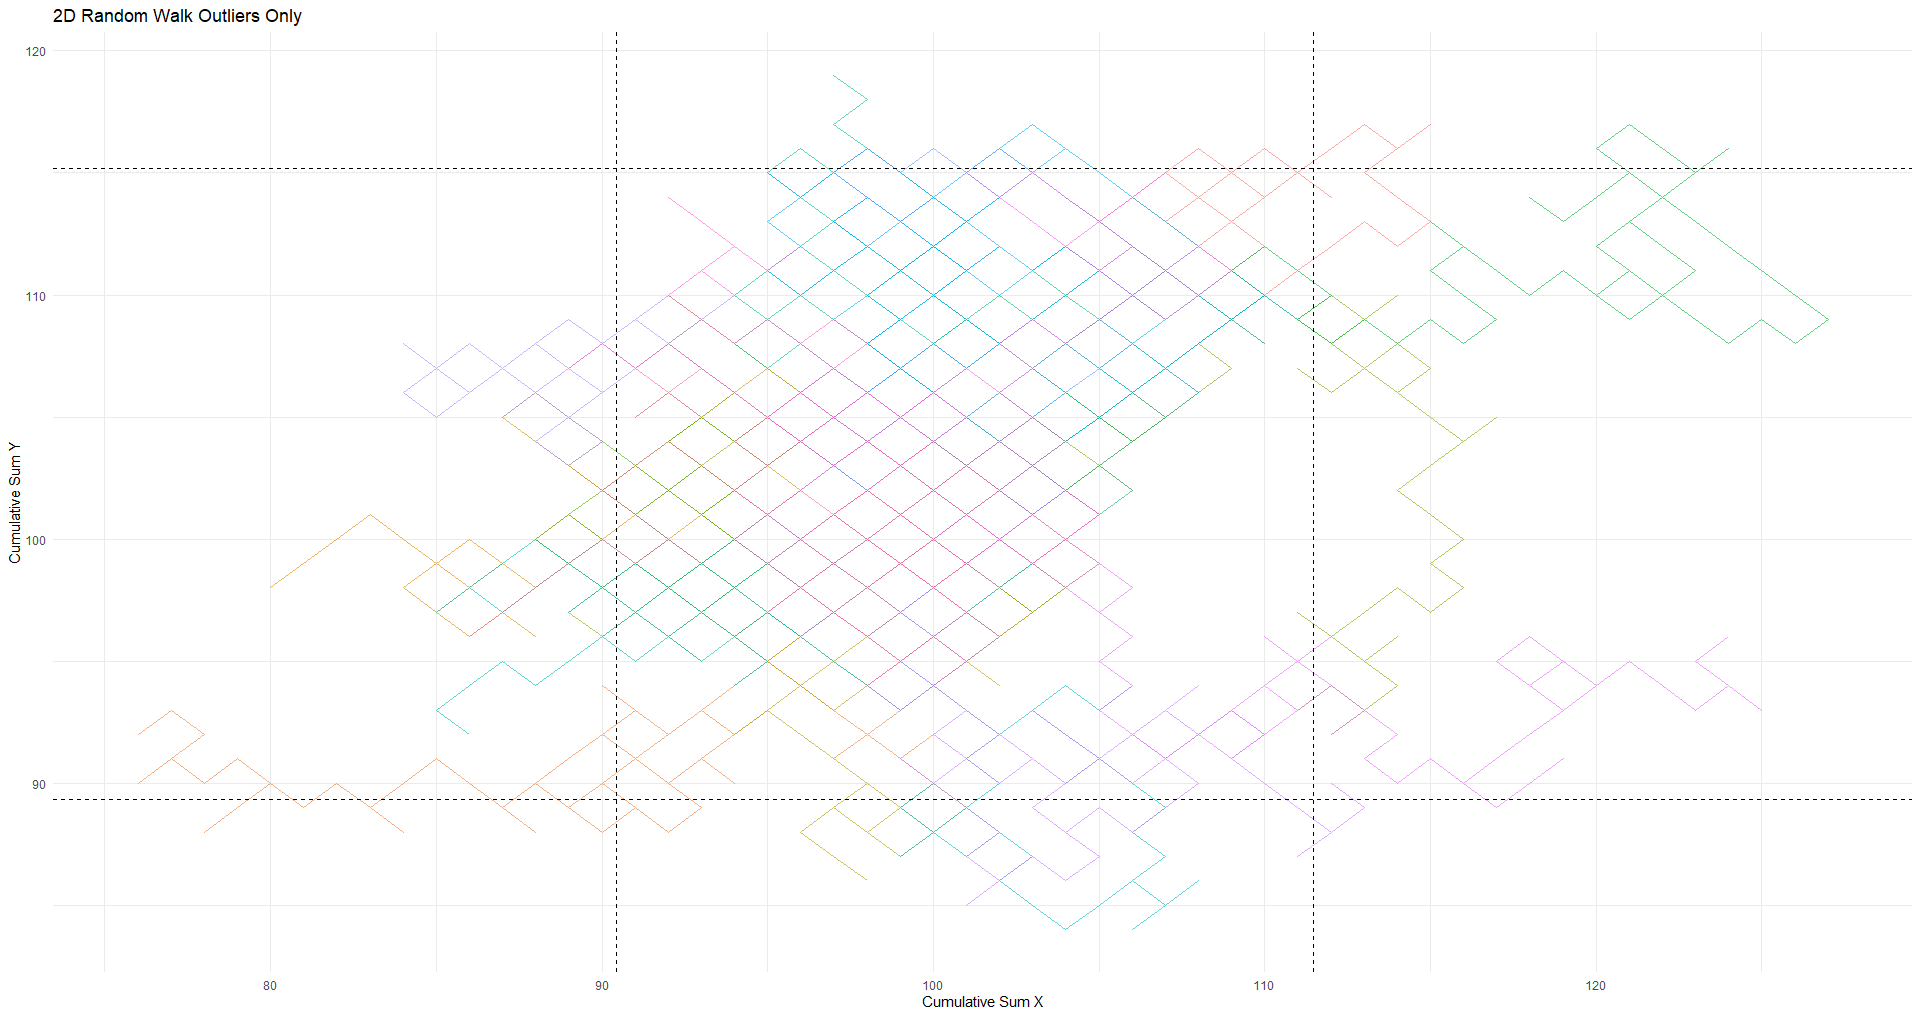
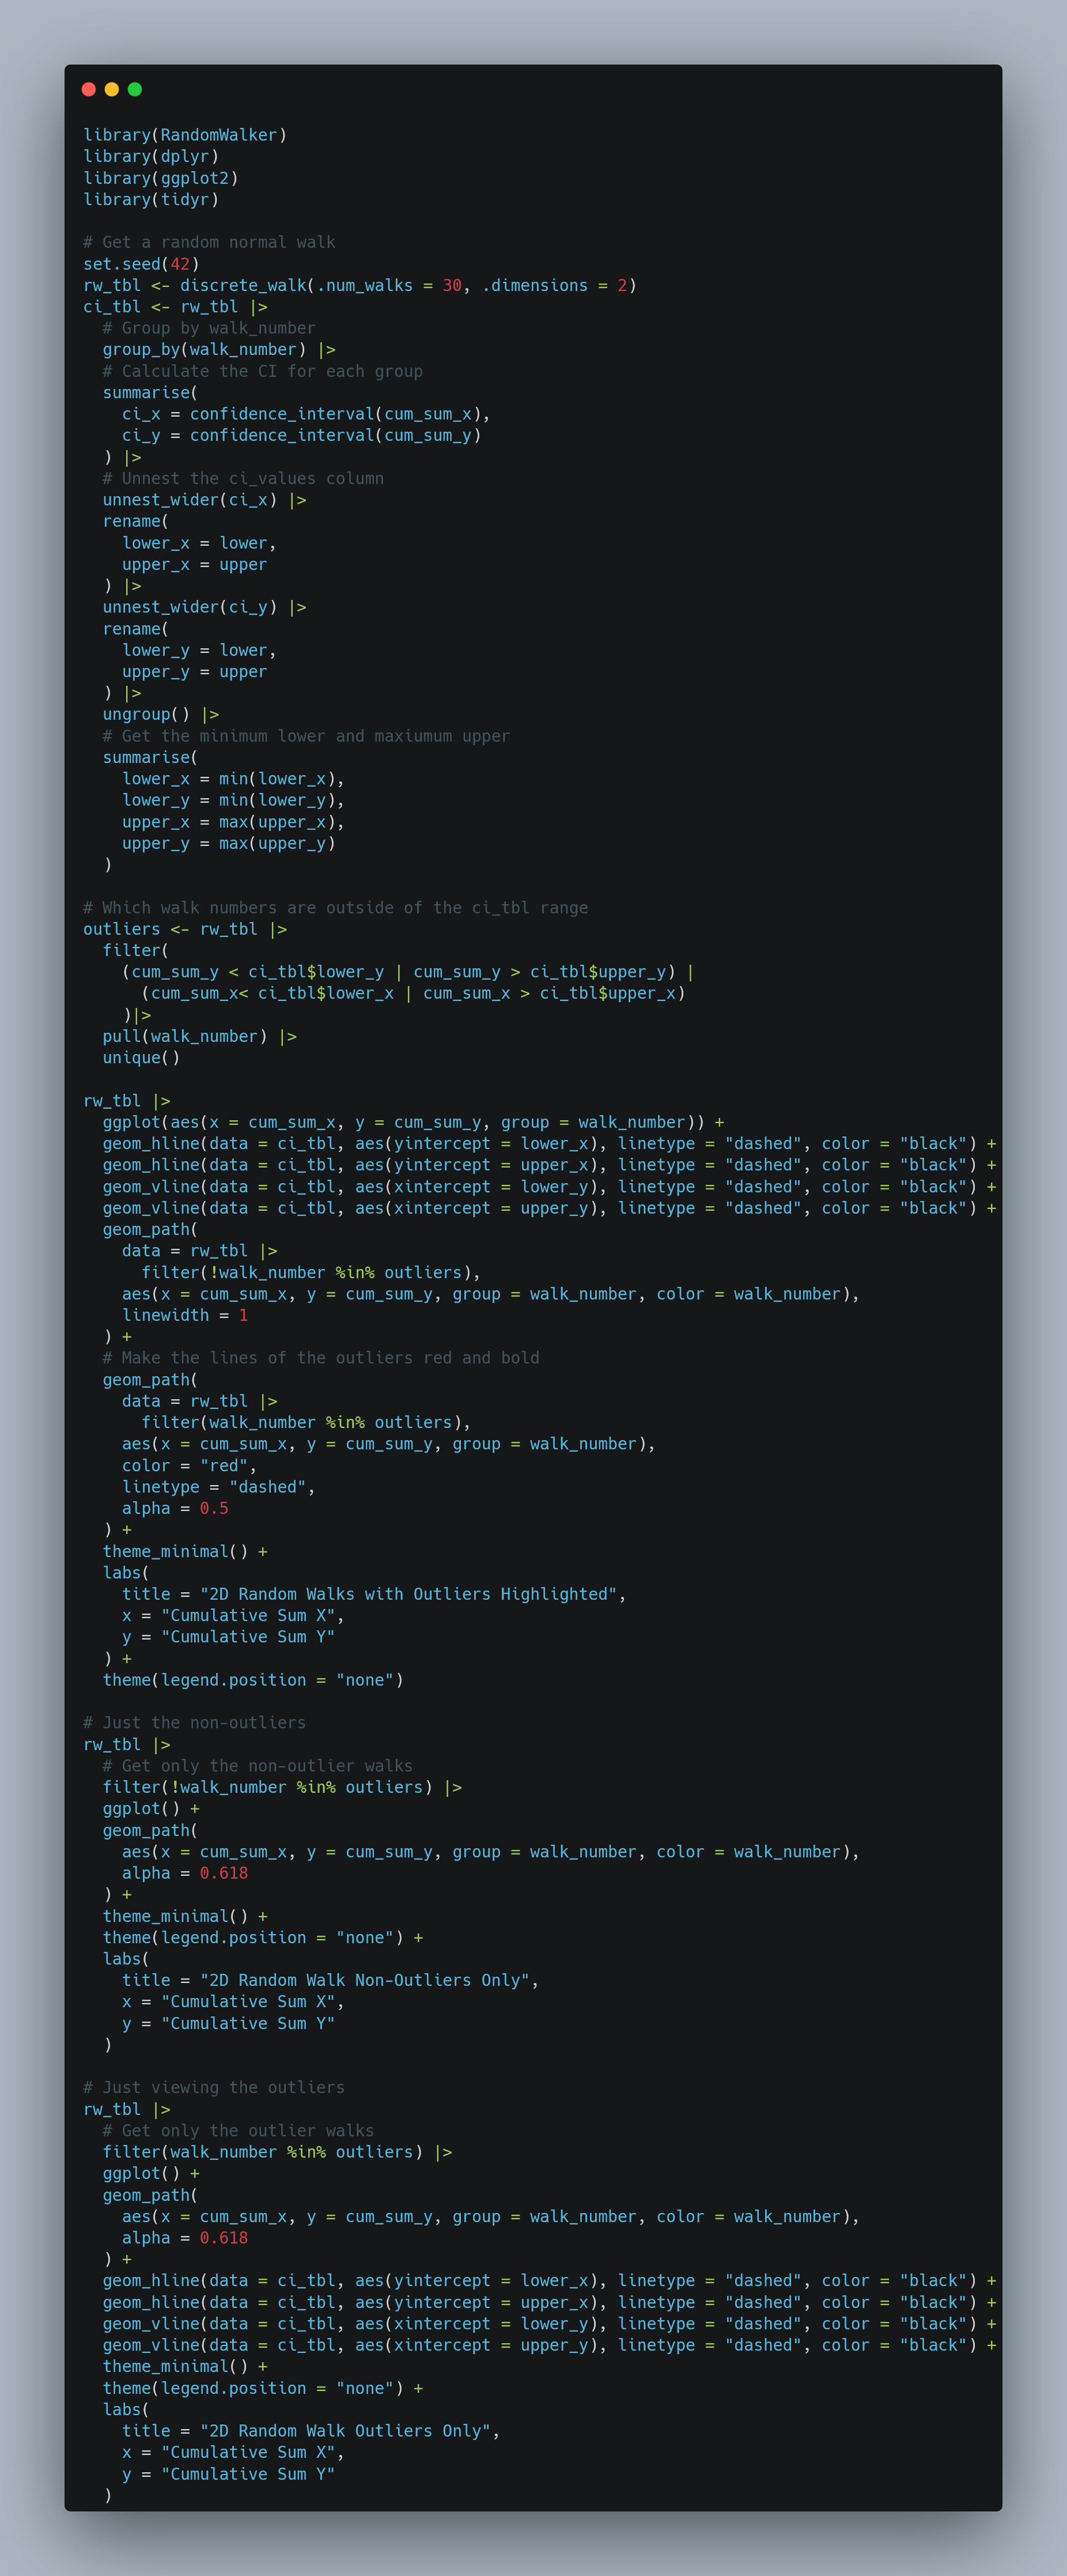
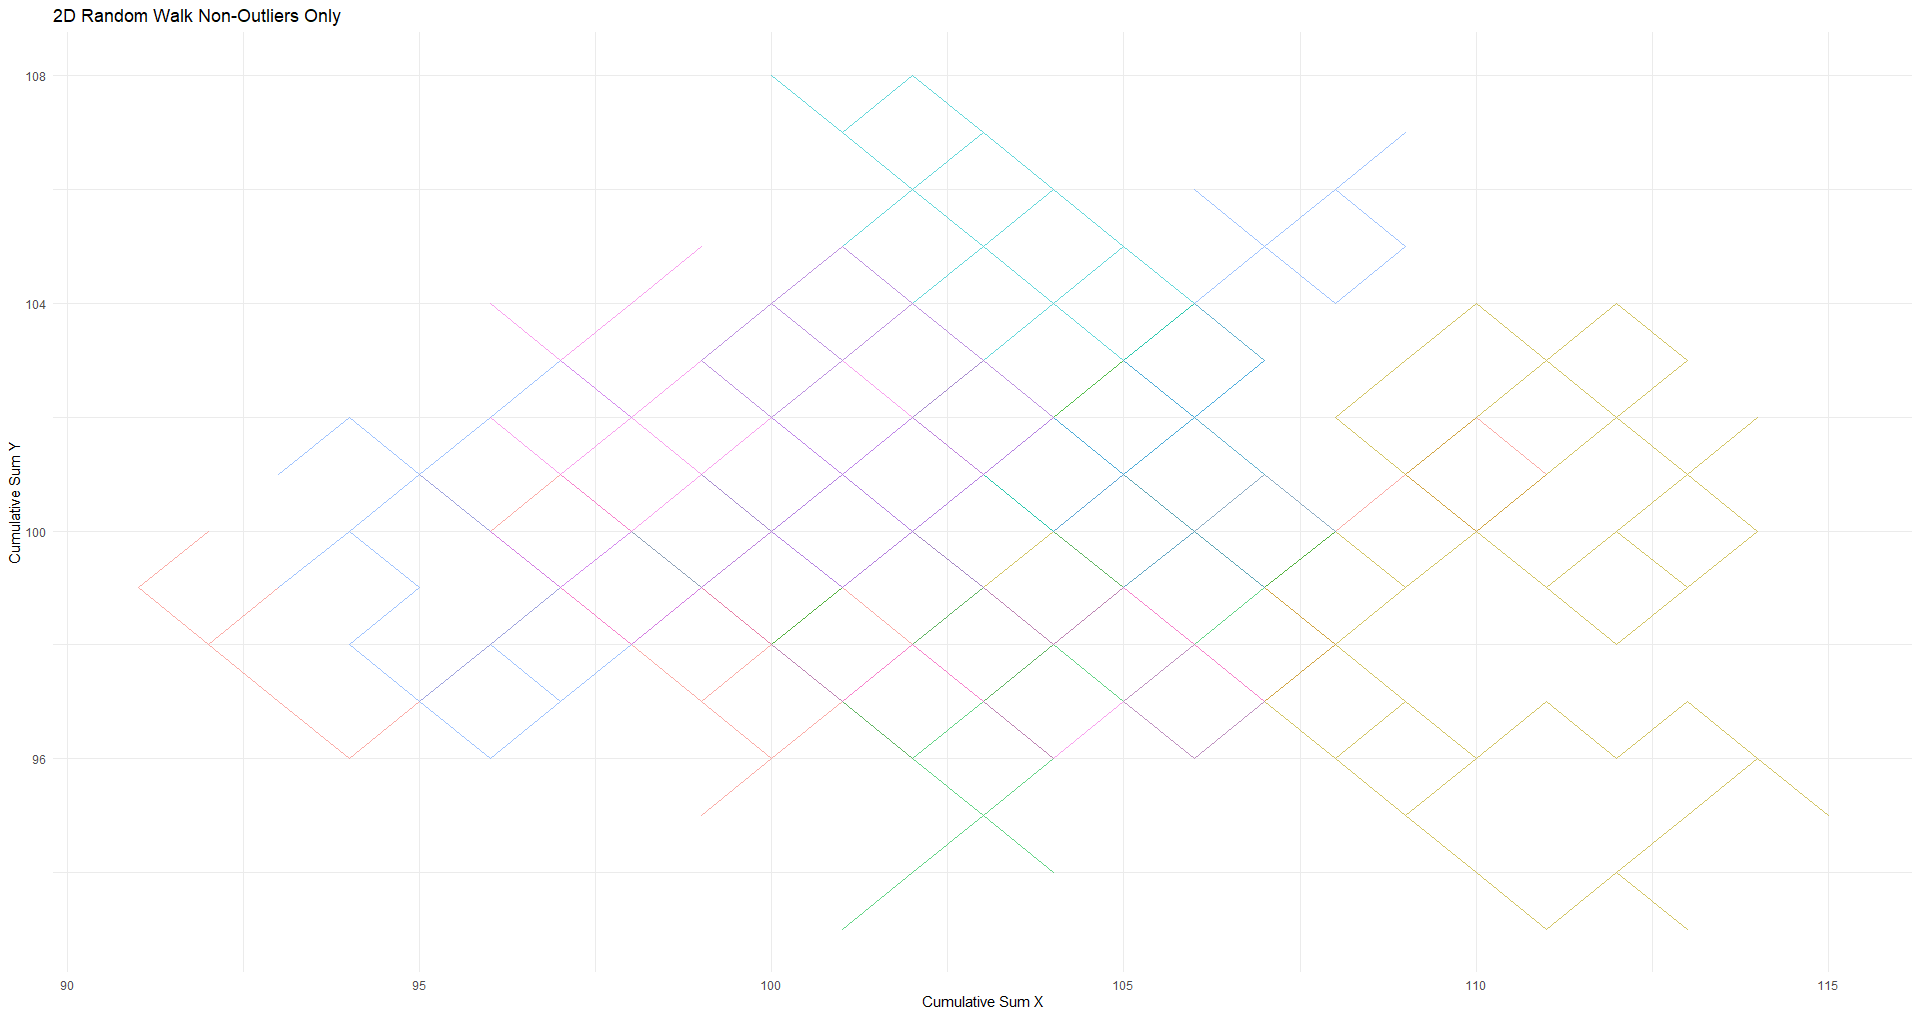
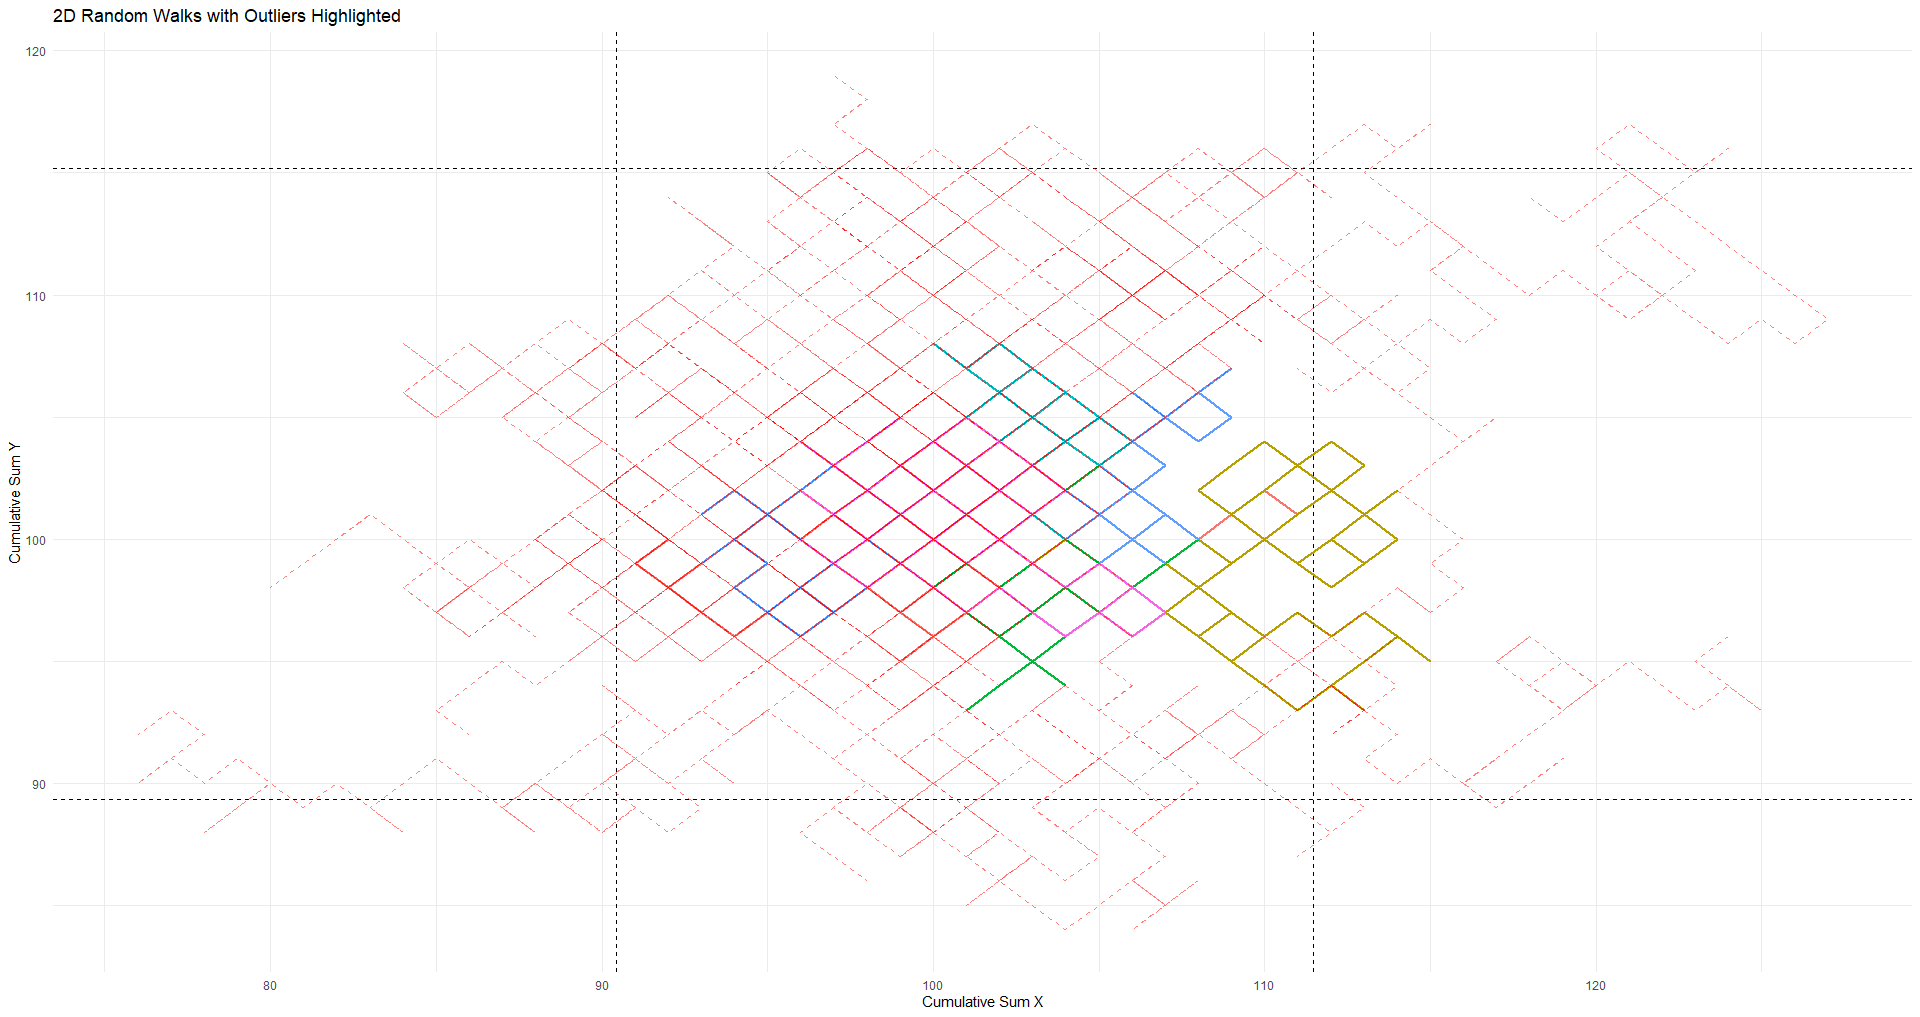
Same as yesterday, but this time, making a 2D Discrete Random Walk with my #R #Package #RandomWalker
#randomWalks


Same as yesterday, but this time, making a 2D Discrete Random Walk with my #R #Package #RandomWalker


"What is it like to be an immigrant? Filmmaker Borbála Tompa animates the fears, challenges, and aspirations of five immigrants in Budapest whose futures remain undetermined. See "Random Walks" by Borbála Tompa, now playing, in the Video Arts Room located pre-security in the International Terminal. https://www.flysfo.com/museum/video-arts/random-walks" This was posted to our Instagram account on November 13, 2018 – https://millsfield.sfomuseum.org/instagram/1880151933/
If you like #randomwalks and #histograms - I have this for you. An animated histogram using #WebVPython
#randomwalks are just fun to model in #python. Here's a very detailed post about how to make it work in #webvpython. Oh, technically, it could be #physics too.
https://rjallain.medium.com/modeling-random-walks-in-python-for-fun-and-no-profit-3938fb833f3b
The healthyverse meta package:
healthyR: Streamline hospital data workflows
healthyR.ts: Master time series analysis
healthyR.ai: Implement AI modeling seamlessly
healthyR.data: Access curated healthcare datasets
TidyDensity: Simplify probability distributions
tidyAML: Automate machine learning with tidymodels
RandomWalker: Explore random walk analysis
install.packages("healthyverse")
library(healthyverse)
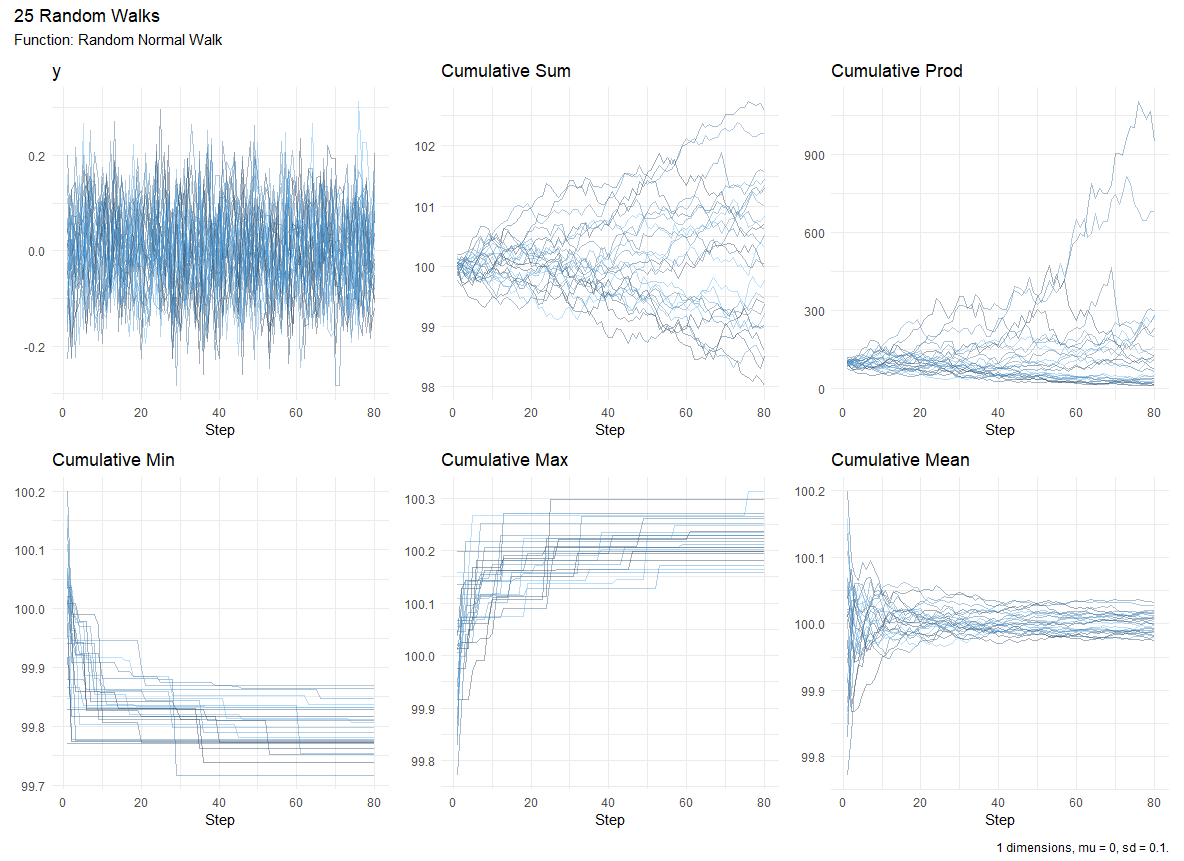
Here's how visualize_walks() can transform your data analysis:
• Simplifies random walk visualization
• Works with various RandomWalker package functions
• Creates stunning ggplot2 plots in a patchwork layout
• Customizable alpha values for perfect transparency
• Option to make plots interactive with a single parameter
• Flexibility to focus on specific attributes
No coding gymnastics required!
#R #RStats #RProgramming #ggplot2 #RandomWalks #Simulation
Reference: https://www.spsanderson.com/RandomWalker/reference/visualize_walks.html
Plugging away :) #R #RStats #RProgramming #Programming #ggplot2 #RandomWalks
Plugging away :) #R #RStats #RProgramming #Programming #ggplot2 #RandomWalks
I've been working hard on the #dev version of our #R #package RandomWalker.
Working towards adding a `.dimensions` parameter to allow users to pass an integer of 1, 2 or 3 to get a 1D, 2D or 3D random walk generated.
See discussion here: https://github.com/spsanderson/RandomWalker/discussions/53
#Programming #RandomWalks #Finance #Random #Stochastics #Simulation
I have submitted a new #R #package yesterday with my co-author Antti Rask called RandomWalker
We are very excited about it!
GitHub: https://github.com/spsanderson/RandomWalker/
I have submitted a new #R #package yesterday with my co-author Antti Rask called RandomWalker
We are very excited about it!
GitHub: https://github.com/spsanderson/RandomWalker/
R CMD check results for RandomWalker 0.0.0.9000
Duration 11.6 seconds
0 errors
0 warning
0 notes
R CMD check results for RandomWalker 0.0.0.9000
Duration 11.6 seconds
0 errors
0 warning
0 notes
Moving along nicely thanks to my co-author Antti Rask
Site: https://www.spsanderson.com/RandomWalker/
GitHub: https://github.com/spsanderson/RandomWalker
#R #RStats #RProgramming #Programming #ggplot2 #visualization #Random #TimeSeries #RandomWalks #Finance #coding #GitHub
I think this is the new logo for my #R #package RandomWalker
#RStats #RProgramming #RandomWalks #StochasticProcess #1DWalks #2DWalks #3DWalks all coming
Client Info
Server: https://mastodon.social
Version: 2025.04
Repository: https://github.com/cyevgeniy/lmst