#scatterplot

2024-11-03

Возможности функции scatterplot() библиотеки seaborn

Функция scatterplot() из библиотеки seaborn предназначена для построения диаграммы рассеяния, позволяя визуализировать взаимосвязь между двумя числовыми переменными. Она предоставляет множество параметров для настройки внешнего вида точек, цветовых оттенков и размеров, что делает её полезной для анализа данных с несколькими переменными.
habr.com/ru/articles/855758/

#Seaborn #scatterplot

2024-08-02

▶️ LabPlot - A free OriginPro alternative for #Researchers (Scatter Plots)

@labplot@lemmy.kde.social

Catalyst Nanomaterials Lab has published another video tutorial that shows how to create stunning scatter plots, analyze correlations, and uncover hidden patterns in your data using #LabPlot. Go check it out!

➡️ youtube.com/watch?v=r1Fv1lAEf2

#FreeSoftware #DataAnalysis #DataViz #Research #OriginProAlternative #Science #Tutorial #FLOSS #FOSS #OpenSource #Business #ScatterPlot #Correlation #SciDavis #Students

Karsten Schmidttoxi@mastodon.thi.ng
2024-07-13

New #ThingUmbrella example (#172): Interactive visualization of low-discrepancy samples using thi.ng/viz, thi.ng/hiccup-svg, thi.ng/lowdisc, thi.ng/rdom & thi.ng/rdom-forms

The example also demonstrates combining multiple plots and uses lens axes with adjustable non-linear mapping using focal points and dilation...

Demo:
demo.thi.ng/umbrella/viz-scatt

Commented source code:
github.com/thi-ng/umbrella/blo

#DataViz #Visualization #ScatterPlot #LowDiscrepancy #Reactive #UI #SVG #TypeScript #JavaScript

2024-04-12

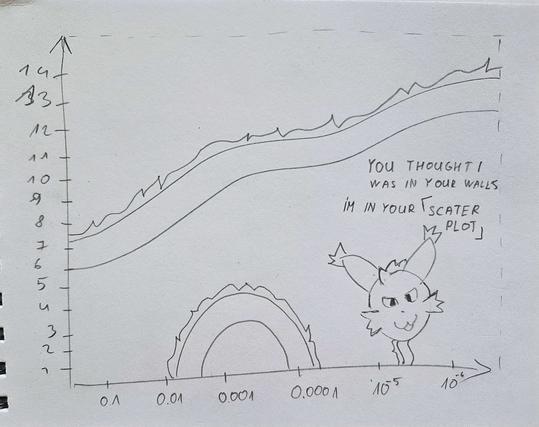
The devs put out an update, I'm in your text book now! >:3

#furryart #snappi #dragon #stretchy #shapeshifter #diagram #textbook #scatterplot

2023-11-28

kandi.openweaver.com/collectio

A scatter plot is a powerful data visualization tool. That can display relationships between variables.

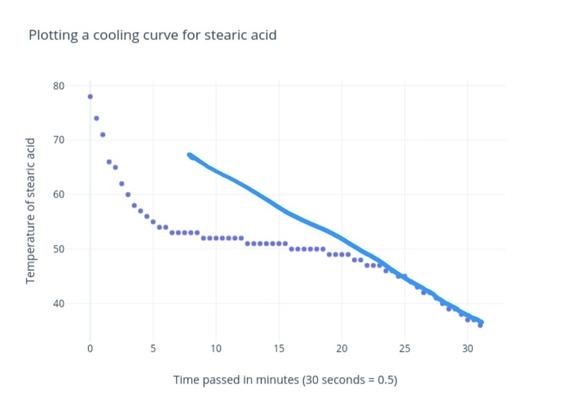
Anyone using Google Sheets? How do I make a partial trendline on a scatter plot? I can do it in Excel but my school is a Google school (boo!) and I have to teach my kids how to use it, but that means I also have to teach myself how to use it. I cannot seem to work it out and the internet seems to just show me how to add multiple ones.
Attached a picture to show what I mean.
#GoogleSheets #TrendLine #ScatterPlot

A set of data where x-axis goes to 30, but the trendline is just for data based on x-axis 25-30
Statistics GlobeStatisticsGlobe
2023-10-15

ChatGPT Coding - Draw Scatterplot with Regression Line in R!

Check out this ChatGPT R tutorial for drawing a scatterplot with a regression line!

Statistics GlobeStatisticsGlobe
2023-08-15

Drawing Scatterplots is so Simple in Python!

Drawing scatterplots in Python is so simple. The pandas library, a DataFrame and the plot() function is all we need!

Statistics GlobeStatisticsGlobe
2023-08-03

Base R vs. ggplot2 - Drawing Scatterplots!

Do you prefer to visualize your data in scatterplots created by the basic installation of the R programming language, or do you use the ggplot2 package?

2022-11-17

Wrote a small proof-of-principle for drawing 2D #scatterplot using #threlte (#threejs for #svelte). See here: jandot.github.io/posts/basic_t

Client Info

Server: https://mastodon.social
Version: 2025.04
Repository: https://github.com/cyevgeniy/lmst