
Red teams outnumber not red teams 7-5 in the initial CFP field and have all 4 first round byes. #AdvancedAnalytics
#AdvancedAnalytics

https://www.indium.tech/data-analytics-services/
Data and Analytics Services and Solutions
Indium’s data and analytics services help you uncover hidden insights using advanced analytics solutions tailored to your business needs.
#DataAnalytics #AnalyticsSolutions #DataDriven #BusinessIntelligence #AdvancedAnalytics #BigDataSolutions #DataServices #DataStrategy

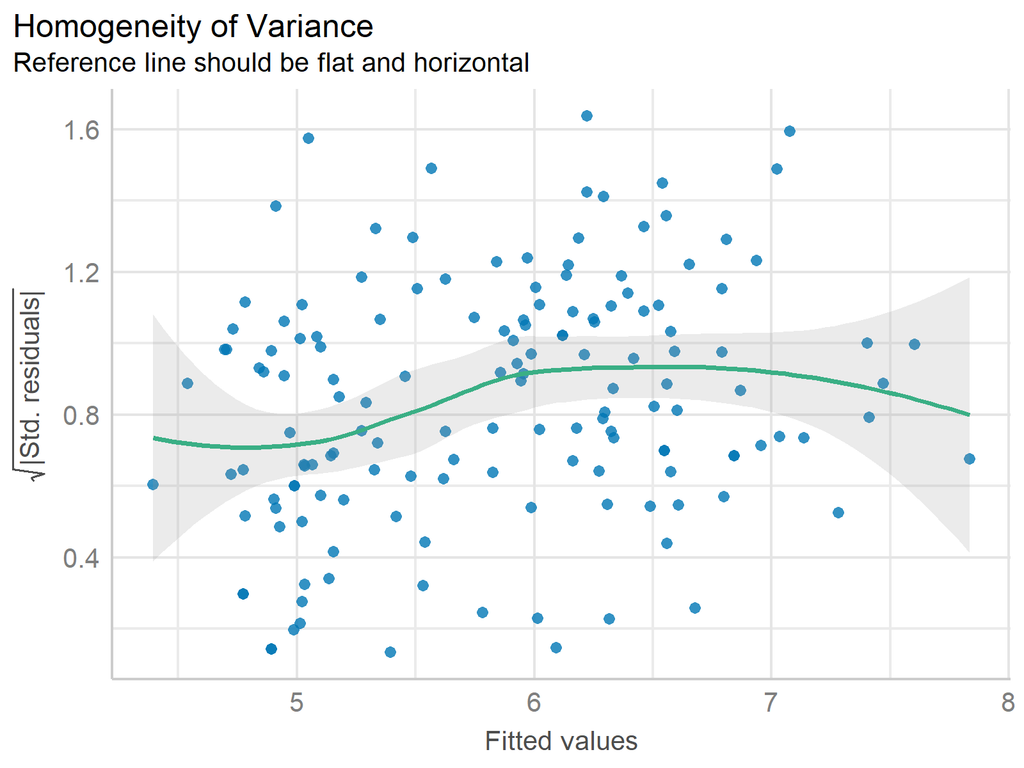
Ensuring homogeneity of variance (homoscedasticity) is often considered a key assumption in linear regression. But is it really that important? 🤔
The plot below visually demonstrates how heteroscedasticity can manifest in residuals. Ideally, the reference line (in green) should remain flat and horizontal, indicating homogeneity of variance.
Learn more: http://eepurl.com/gH6myT
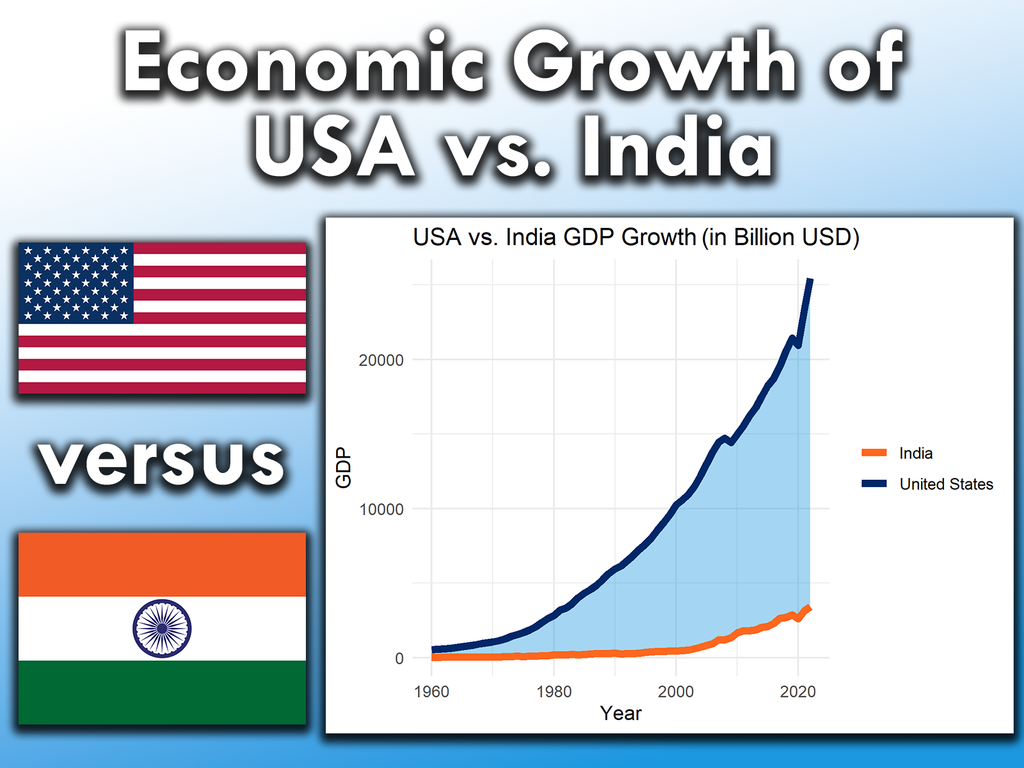
Did you know that India is one of the fastest-growing major economies in the world? 🇮🇳 Meanwhile, the USA remains the largest economy by nominal GDP. 🇺🇸
Both countries face unique challenges but have the potential for continued economic growth.
I have created an extensive article on this topic for those who want to dive deeper into the GDP comparison between the USA and India.
Click this link for detailed information: https://statisticsglobe.com/gdp-usa-vs-india

Oh, joy! Another *TOTALLY* necessary event verification platform has graced us with its presence. Because, clearly, the world was just DYING for more "Advanced Thread Analytics" and "Live Feeds" of... wait for it... event evidence. 🙄🎉
https://atac.seraum.com #eventverification #advancedanalytics #techhumor #innovation #cringe #HackerNews #ngated
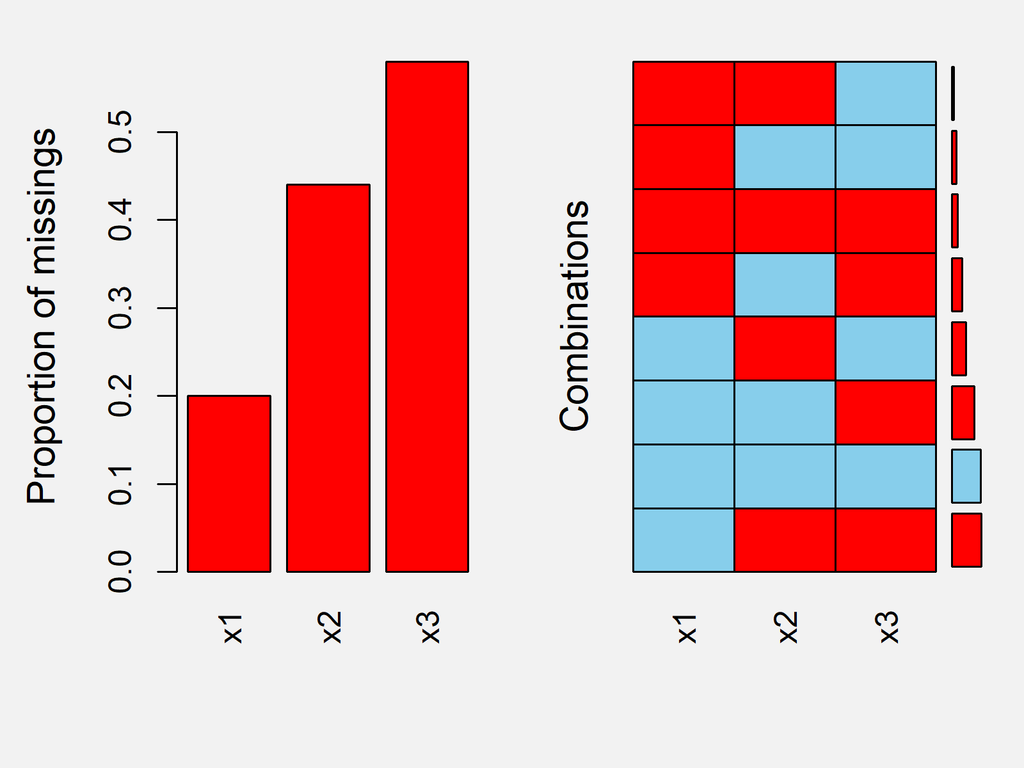
Missing values are a common challenge in data analysis, and properly reporting them is a critical step in understanding your data. By examining the patterns and proportions of missing values, you can assess the potential impact on your analysis and decide how to handle them effectively.
The attached image, created using the VIM package in R, illustrates the proportion of missing values across variables.
More: http://eepurl.com/gH6myT
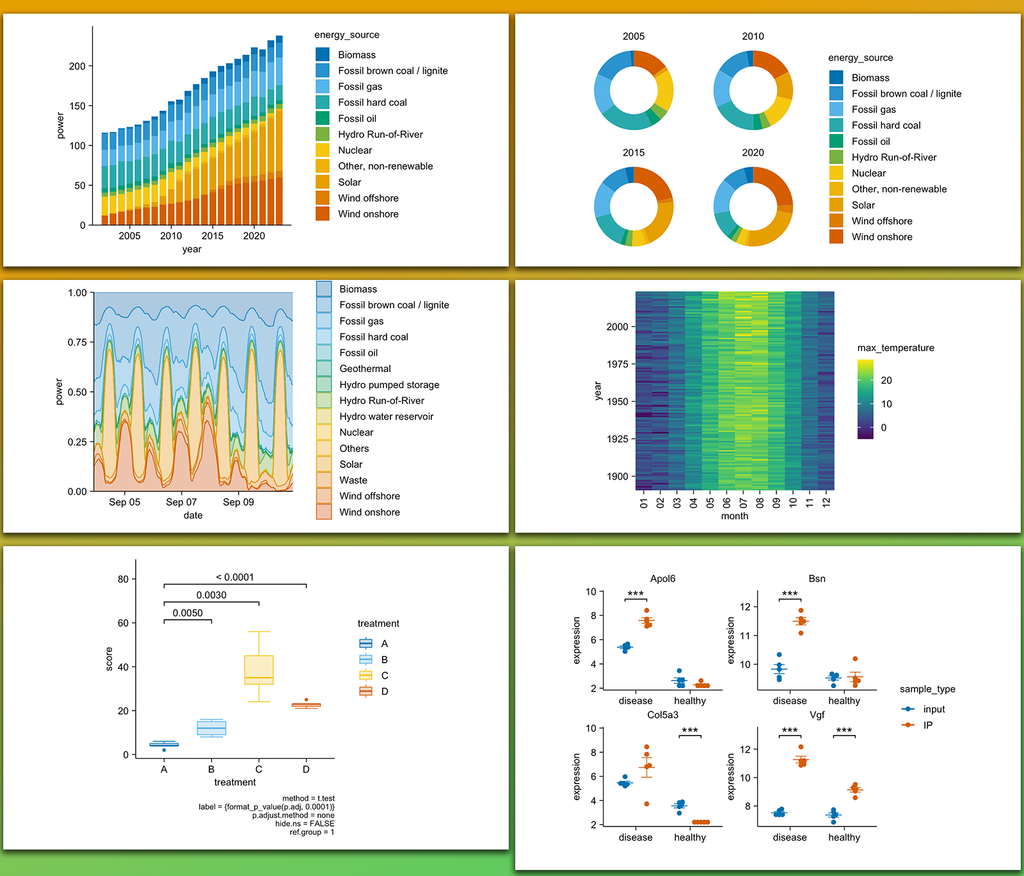
I recently discovered the tidyplots package in R, and it’s impressive how effortlessly it enables you to create beautiful, publication-ready plots.
The example visualizations shown here were created by the package author, Jan Broder Engler, and are featured on the tidyplots website: https://jbengler.github.io/tidyplots/
Click this link for detailed information: https://statisticsglobe.com/online-course-data-visualization-ggplot2-r
#statisticsclass #datavisualization #advancedanalytics #rprogramminglanguage #visualanalytics #package #tidyverse
If you're a Stata user, you should switch to R now!
Thinking about switching to R? Check out my online course for absolute beginners in R programming.
Click this link for detailed information: https://statisticsglobe.com/online-course-r-introduction
#advancedanalytics #data #package #datasciencecourse #statisticsclass #rprogramminglanguage
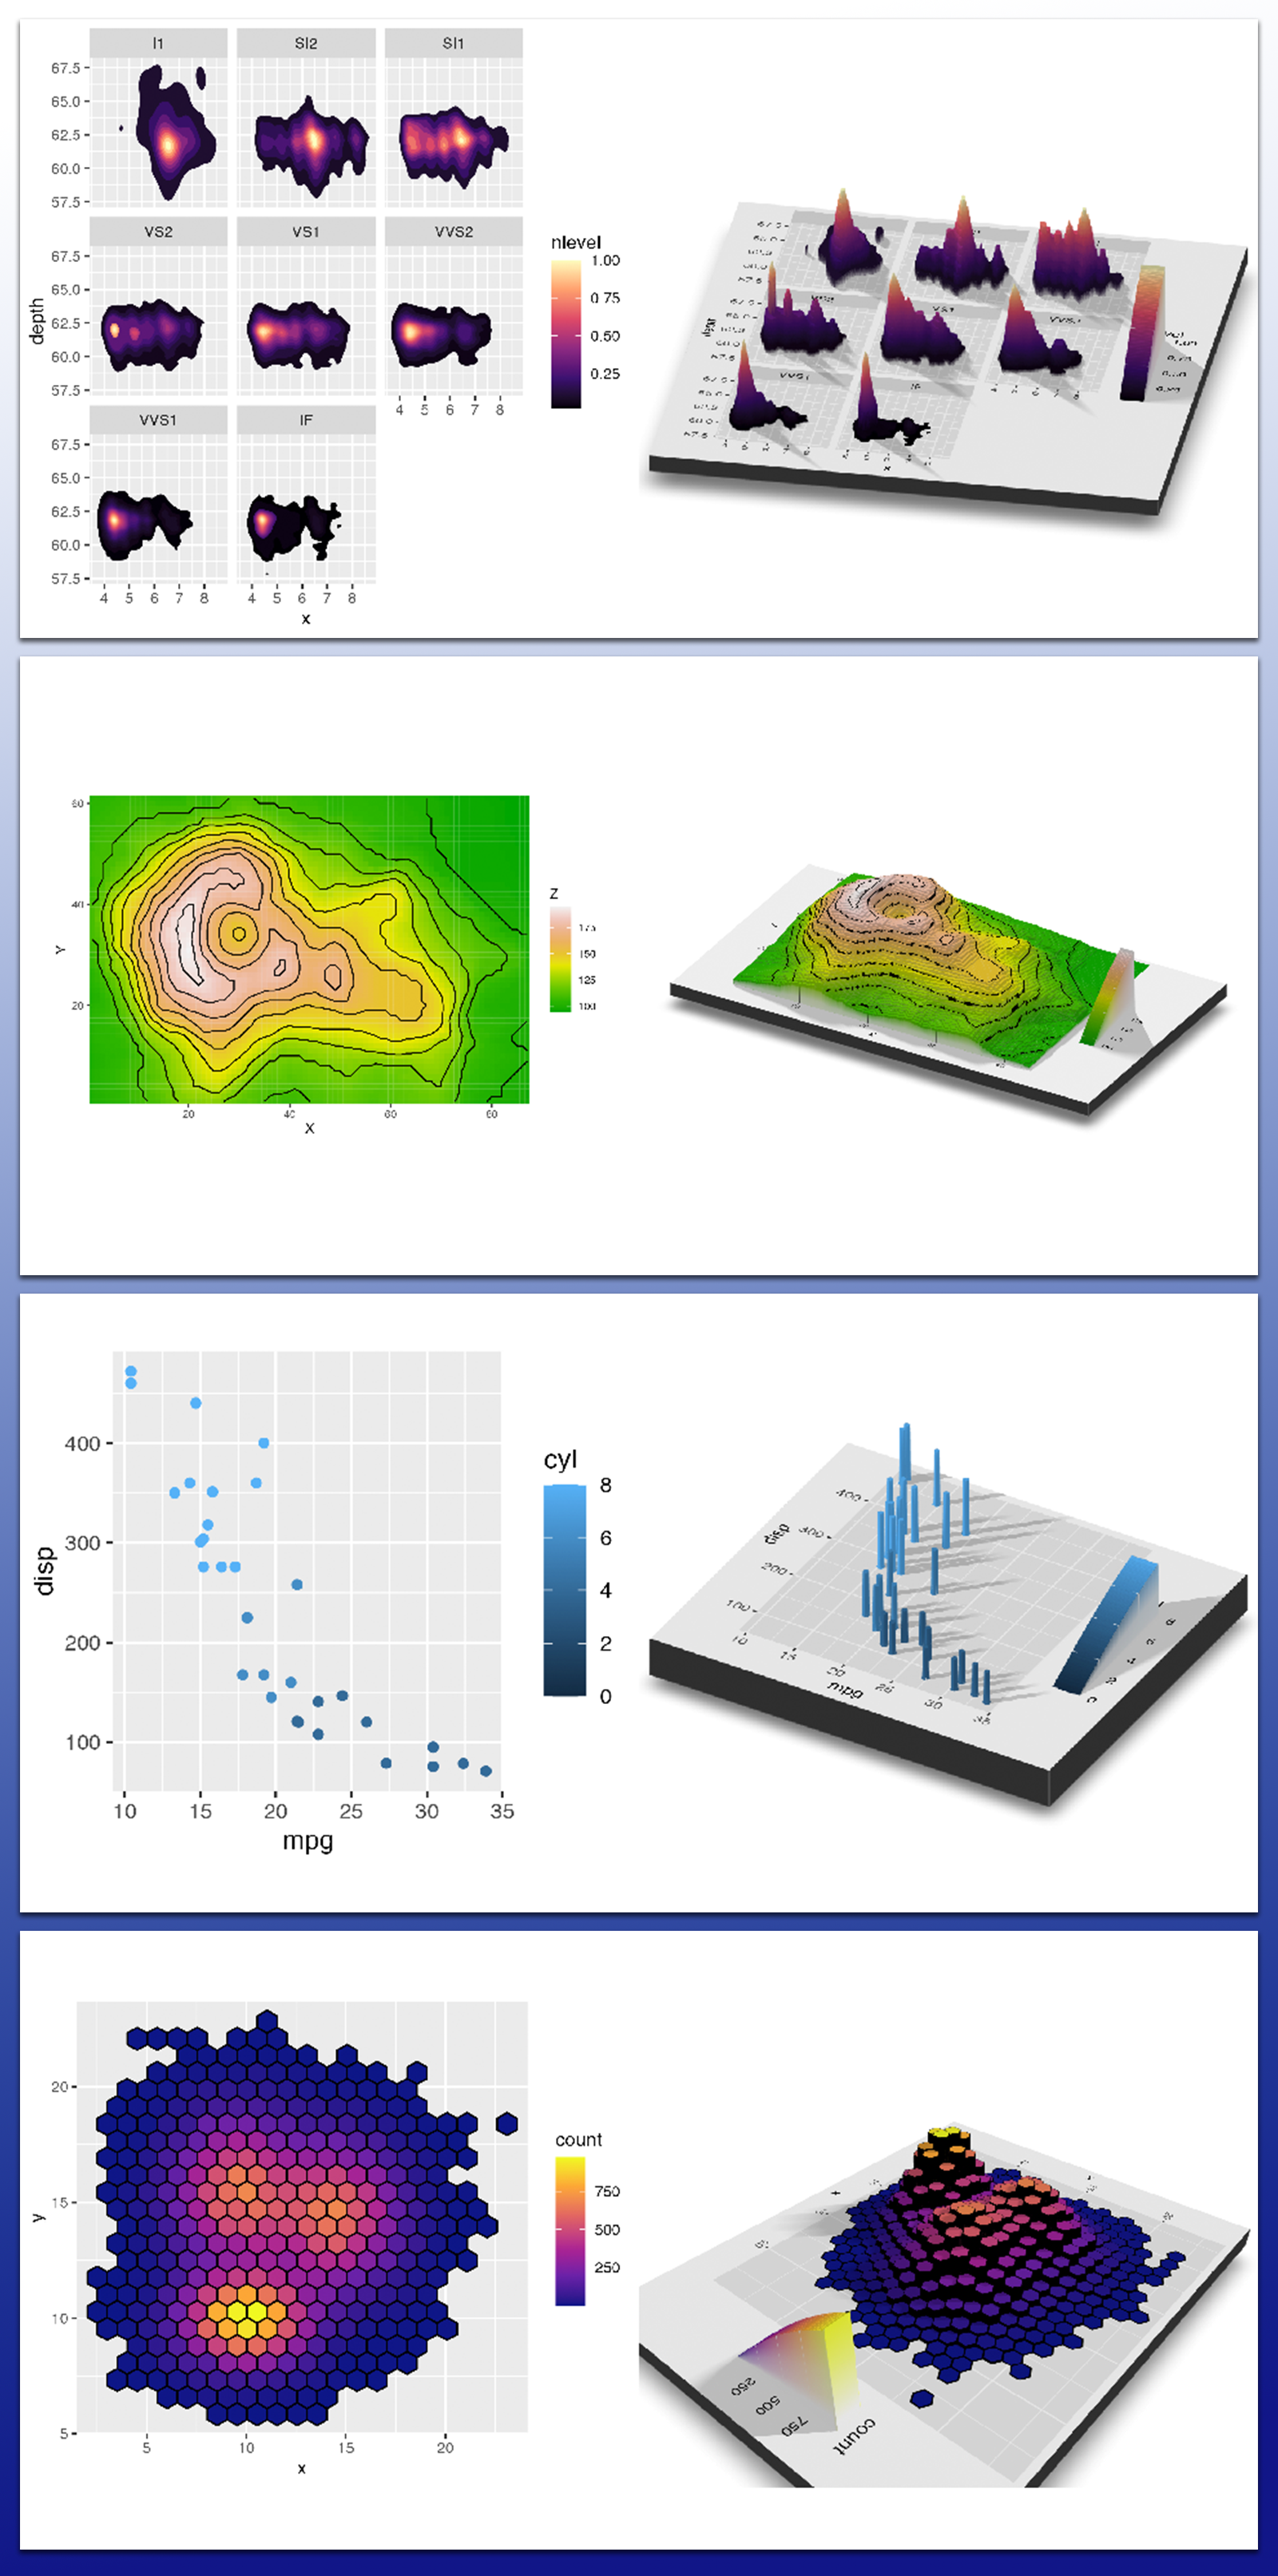
Bring your ggplot2 visualizations into 3D with rayshader! This extension adds powerful 3D plotting capabilities to R, making it easy to transform standard visuals into interactive and visually engaging data representations.
The visualizations shown here are taken from the rayshader package website: https://www.rayshader.com/
Click this link for detailed information: https://statisticsglobe.com/online-course-data-visualization-ggplot2-r
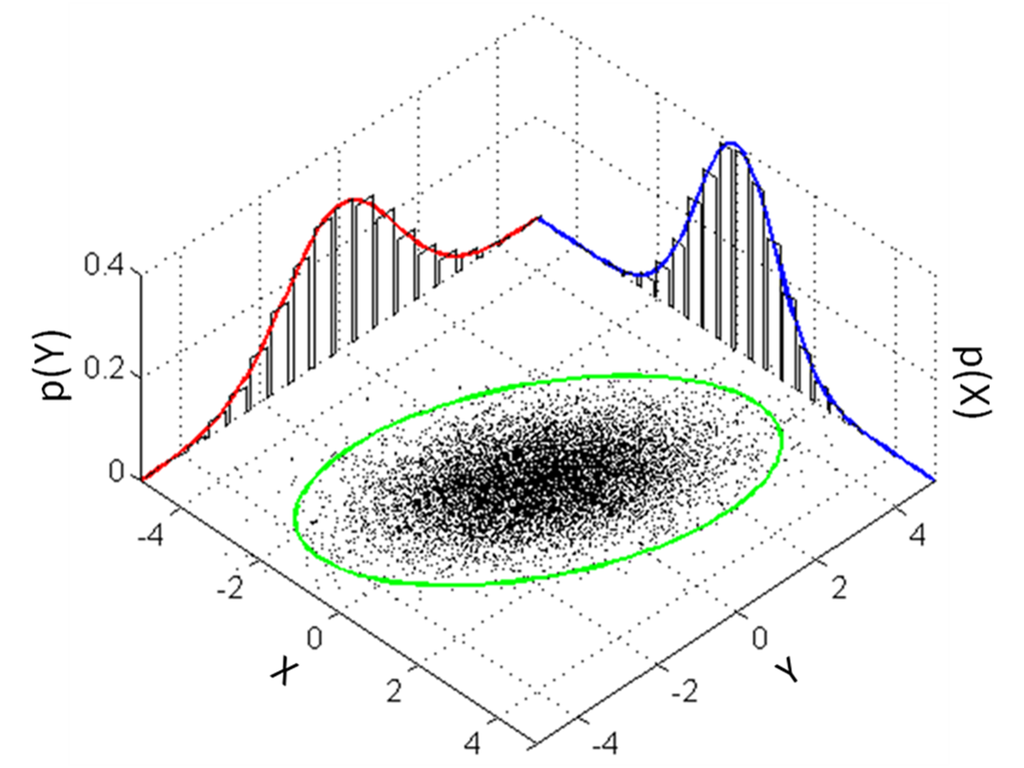
Standard deviation is one of the most important concepts in statistics, providing a way to measure how spread out data points are around the mean. It helps in understanding data variability, which is critical for interpreting trends and patterns.
Image credit to Wikipedia: https://en.wikipedia.org/wiki/Standard_deviation#/media/File:MultivariateNormal.png
Interested in learning further? Check out my online course on Statistical Methods in R. Check out this link for more details: https://statisticsglobe.com/online-course-statistical-methods-r
Discover Innovative Risk Management Solutions with Sutra
Sutra Management is proud to participate in the @future Risk & Fraud Forum Malaysia on April 16, in partnership with SAS.
#RiskManagement
#FraudPrevention
#AdvancedAnalytics
#ComplianceStrategy
#SutrasAtFutureForum

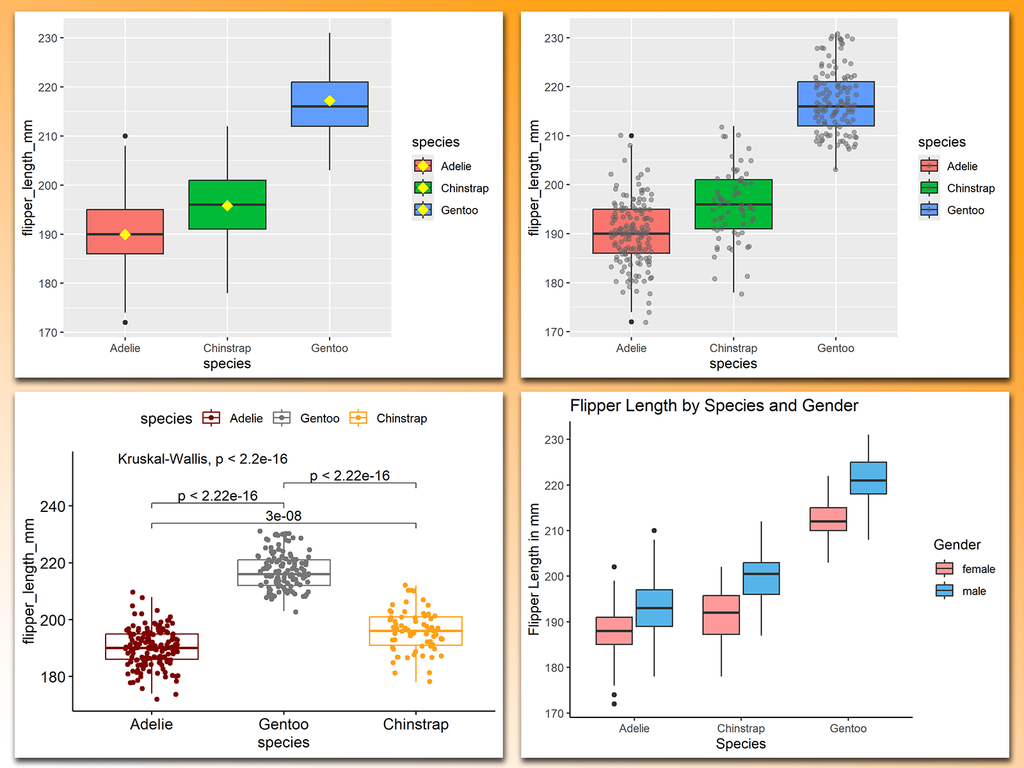
Basic boxplots are often not the best way to visualize your data! They can hide important information, such as the distribution of individual data points or group-specific differences.
The attached visual showcases several ways to enhance boxplots.
All of these examples were created using ggplot2 and extensions in R.
Click this link for detailed information: https://statisticsglobe.com/online-course-data-visualization-ggplot2-r
#statisticsclass #datavisualization #advancedanalytics #rprogramminglanguage #visualanalytics #package
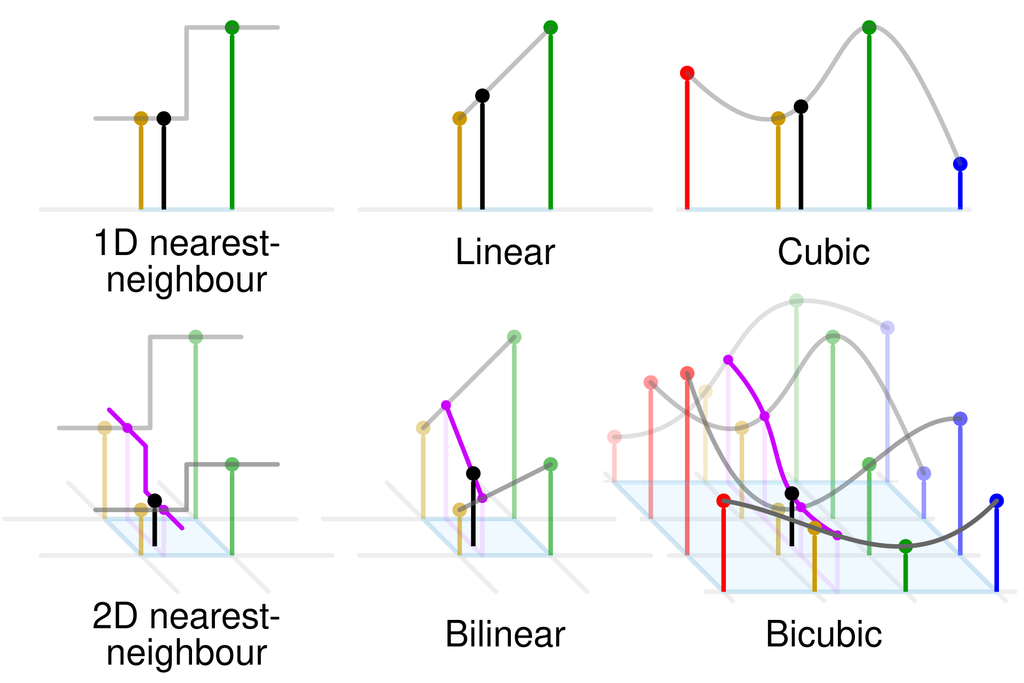
Multivariate interpolation estimates unknown values based on multiple variables, making it useful in physics, finance, and machine learning. It allows for smoother approximations and more accurate predictions in multidimensional spaces.
Visualization: https://en.wikipedia.org/wiki/Multivariate_interpolation#/media/File:Comparison_of_1D_and_2D_interpolation.svg
Want to expand your knowledge of Statistics, Data Science, R, and Python? Subscribe to my newsletter for more insights! Link: http://eepurl.com/gH6myT
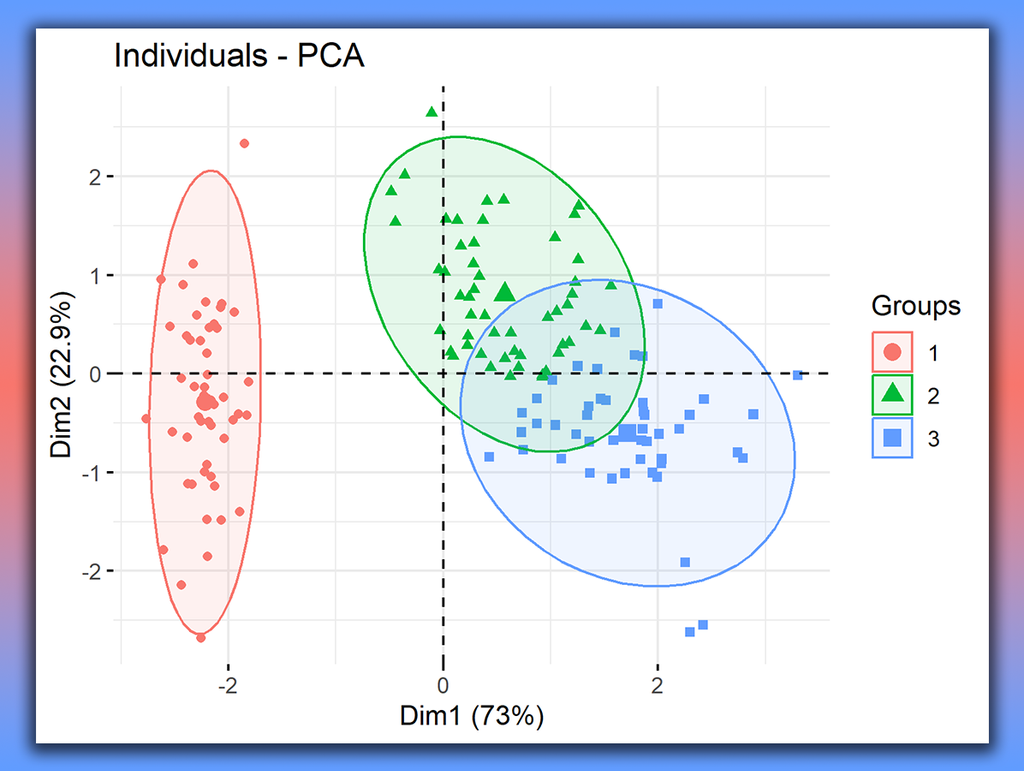
Combining Principal Component Analysis (PCA) with k-means Clustering in R can significantly enhance your data analysis by reducing dimensionality and improving clustering performance.
Check out my article created with Cansu Kebabci: https://statisticsglobe.com/pca-before-k-means-clustering-r
I've also created a video: https://www.youtube.com/watch?v=nzhSjOKSGC8
Furthermore, I offer an extensive online course on PCA: https://statisticsglobe.com/online-course-pca-theory-application-r
#datasciencetraining #bigdata #advancedanalytics #datasciencecourse
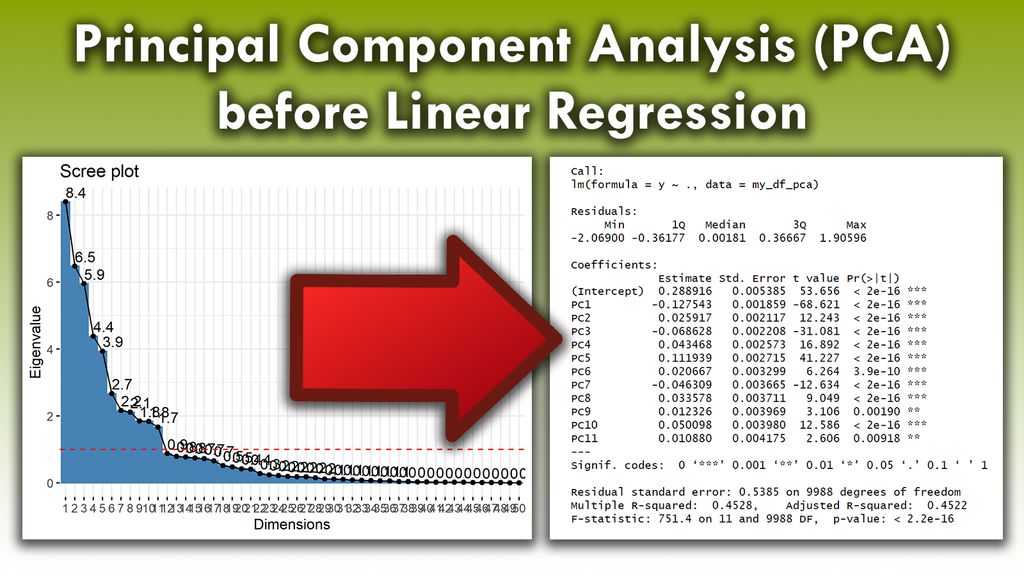
Principal Component Analysis (PCA) before Linear Regression can greatly enhance your data analysis process.
By incorporating PCA before performing linear regression, you can streamline your analysis pipeline and build more robust models that capture the essential relationships within your data.
I've developed an in-depth course on PCA theory and its application in R programming.
Further details: https://statisticsglobe.com/online-course-pca-theory-application-r
#pythontraining #datascientists #data #bigdata #advancedanalytics

This has already been Community Noted, &the ensuing jokes are great, but I also ran some #advancedanalytics for those curious
On Dec. 5 at 3:31 pm, @agetzenberg@sportsbots.xyz & I had a 2-on-1 interview w/ Matt Milano, his 1st interview since returning to play in 13 months
Much to discuss!! 🧵 https://x.com/TheFlockOpinio…

Unlock SAS Analytics: Courses & Skills for Data Analysis | CoListy
Explore SAS courses in programming, AI, and statistics to master data analysis and machine learning techniques for impactful insights. Learn now! | CoListy
#freeonlinelearning #colisty #courselist #sasanalytics #dataanalysis #machinelearning #sasprogramming #statisticalanalysis #generativeai #anova #regression #datasciencecourses #sascertification #sastraining #onlinelearning #advancedanalytics
https://colisty.netlify.app/blogs/unlock-sas-analytics-courses-skills-for-data-analysis/
Master Advanced Analytics with SAS Viya | CoListy
Learn advanced analytics, machine learning, and AI with SAS Viya. Optimize models, forecasting, and more. | CoListy
#freeonlinelearning #colisty #courselist #sasviya #advancedanalytics #predictivemodeling #machinelearning #timeseriesforecasting #optimization #aialgorithms #generativeai #imagedata #textdata #streamingdata #modelops #trustworthyai
https://colisty.netlify.app/courses/sas-analytics_-getting-started/

Modern Technologies in Social Media Marketing: AI, Viplikes, Analytics
#AI #Analytics #SocialMediaMarketing #AI #DigitalMarketing #Viplikes #AdvancedAnalytics #MarketingTrends #Marketing #ContentCreation #EngagementGrowth #SocialMediaTools #TechInMarketing
https://the-14.com/modern-technologies-in-social-media-marketing-ai-viplikes-analytics/
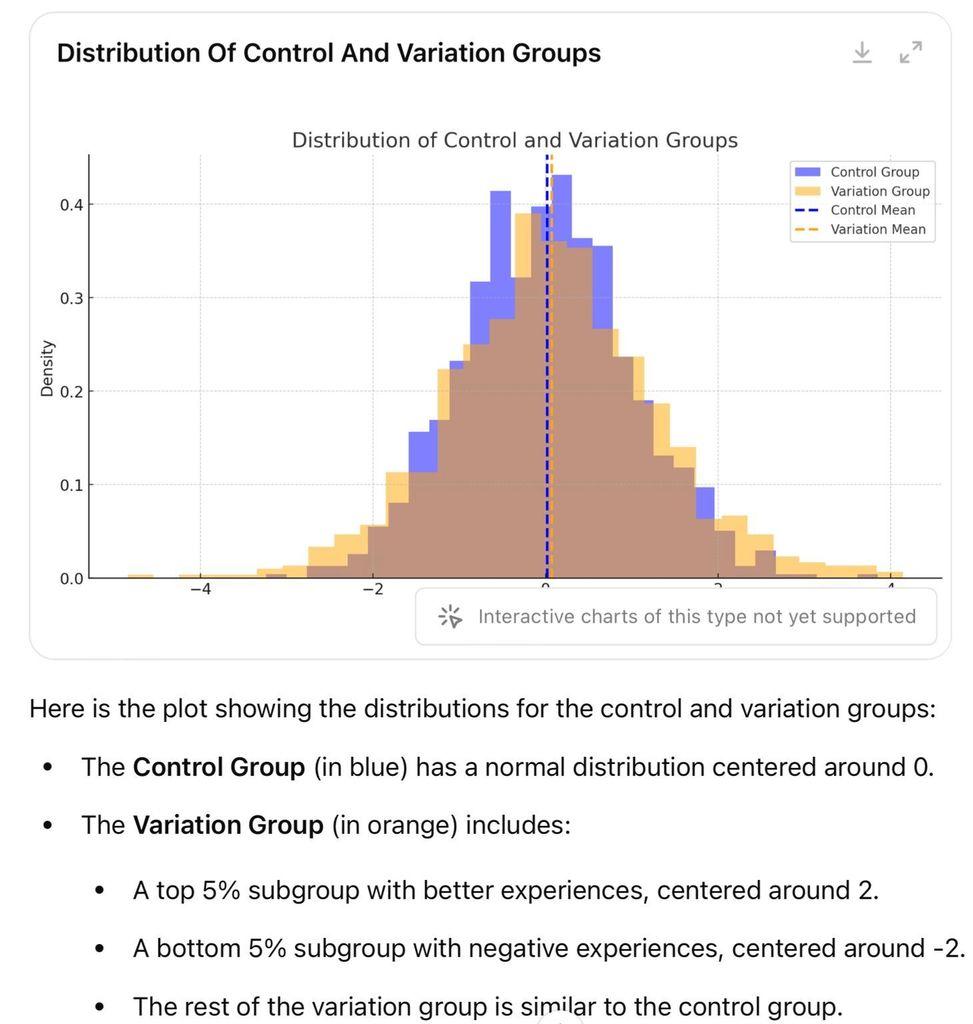
Heterogeneous Treatment Effects (HTE) are a game-changer in A/B testing that often gets overlooked.
The visualization recently shared by Leihua Ye highlights that some segments of users, like the top and bottom 5%, might show vastly different outcomes.
For regular updates on data science, statistics, Python, and R programming, subscribe to my free email newsletter! Check out this link for more details: http://eepurl.com/gH6myT
Client Info
Server: https://mastodon.social
Version: 2025.07
Repository: https://github.com/cyevgeniy/lmst