#EcologicalMonitoring

2025-06-14

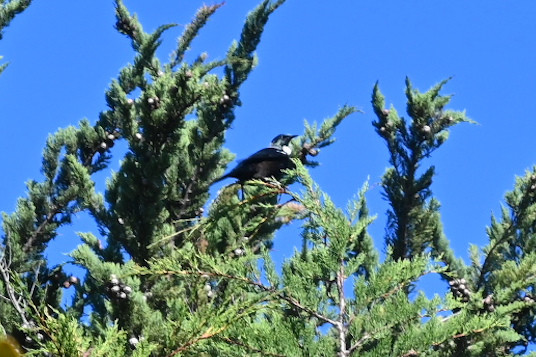
Check out what I saw on my afternoon run through Cashmere, Christchurch, NZ.

This was on one of my fortnightly ecological survey runs through the city, 12 km, which I started in 2008. Today is the first time I have seen a tūī on this route!

Yeah!

inaturalist.nz/observations/28

#birds #tui #nz #EcologicalMonitoring #wildcounts

A photo of a tūī, an irridescent blue-black bird with a distinctive white bobble (poi) of feathers under its beak.

This is my photo. See https://inaturalist.nz/observations/289447711 for more details of where and when.
2025-06-03

I've previously posted graphs from my AudioMoth audio recordings from our garden, with the recordings processed through Birdnet to automatically detect (some) of the bird songs.

Manually counting birds while hanging out laundry is arguably simpler (if you know your birds), and I've been doing it for much longer than the AudioMoth, and storing the results doesn't take terrabytes of storage.

There's still a big space for doing ecological monitoring manually in this high-tech age.
4/4

#EcologicalMonitoring

2025-06-03

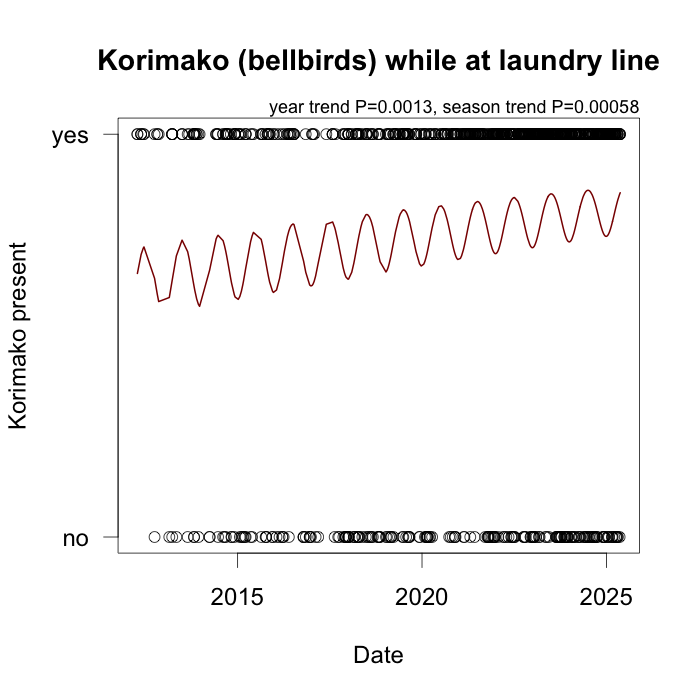
Here are four of the native birds from my weekly #wildcounts while hanging out or bringing in my laundry.

Korimako (NZ bellbirds) are trending up, and are more often in our garden in the winter.

Piwakawaka (NZ fantail) are doing the same.

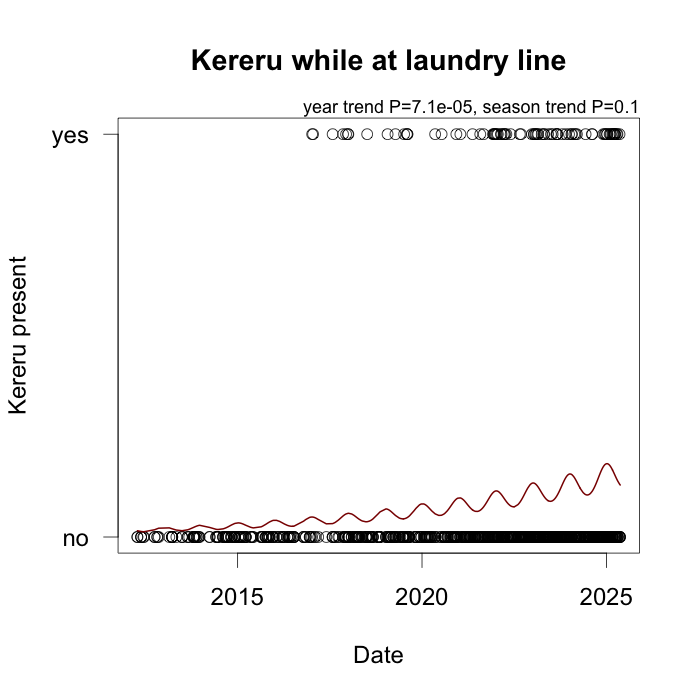
Kererū (NZ wood pigeon) are much more common than they were originally. It wasn't until 2017 that I counted my first kererū from the laundry line.

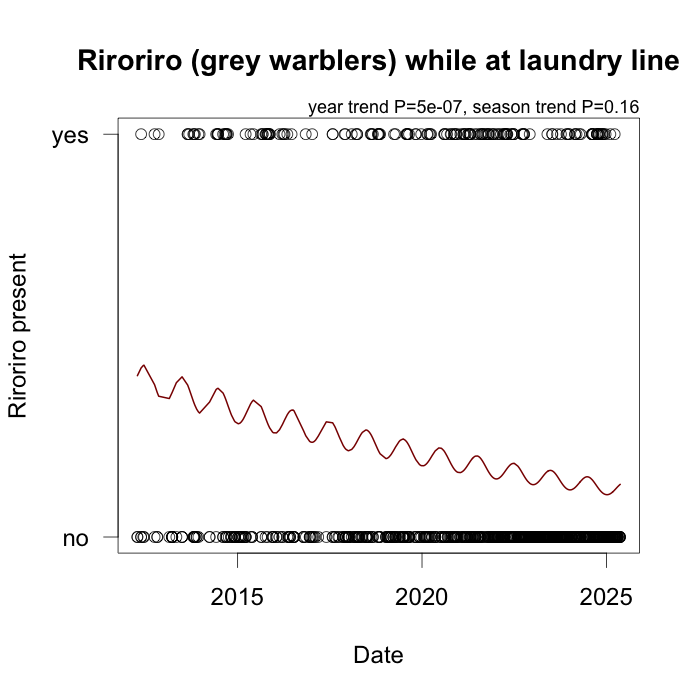
Riroriro (grey warbler) are declining (and I don't understand why).

(Tauhou, the silvereyes, which I've not added a graph for here, are abundant and show no long-term trend.)
3/4

#EcologicalMonitoring #wildcounts #nz #birds

A graph showing the increasing numbers of korimako (NZ bellbirds) seen (or heard) while I'm hanging out or bringing in our laundry. The fitted line on the graph wiggles up and down with the seasons (more in the winter). The line spans 2012–2025.A graph showing the increasing numbers of piwakawaka (NZ fantails) seen (or heard) while I'm hanging out or bringing in our laundry. The fitted line on the graph wiggles up and down with the seasons (more in the winter). The line spans 2012–2025.A graph showing the increasing numbers of kerreū (NZ woodpigeons) seen while I'm hanging out or bringing in our laundry. The fitted line on the graph wiggles up and down with the seasons (more in the winter). The line spans 2012–2025.A graph showing the decreasing numbers of riroriro (NZ grey warblers) seen (or heard) while I'm hanging out or bringing in our laundry. The fitted line on the graph wiggles up and down with the seasons (more in the winter). The line spans 2012–2025.
2025-06-03

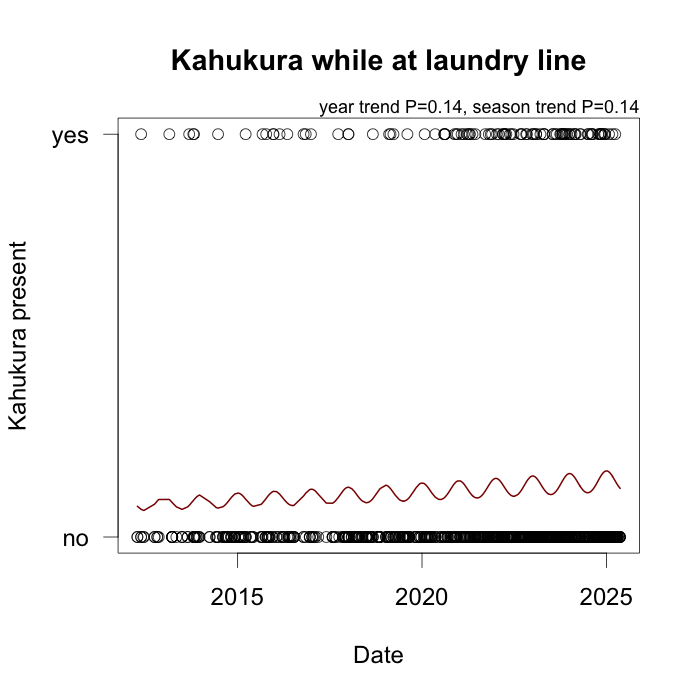
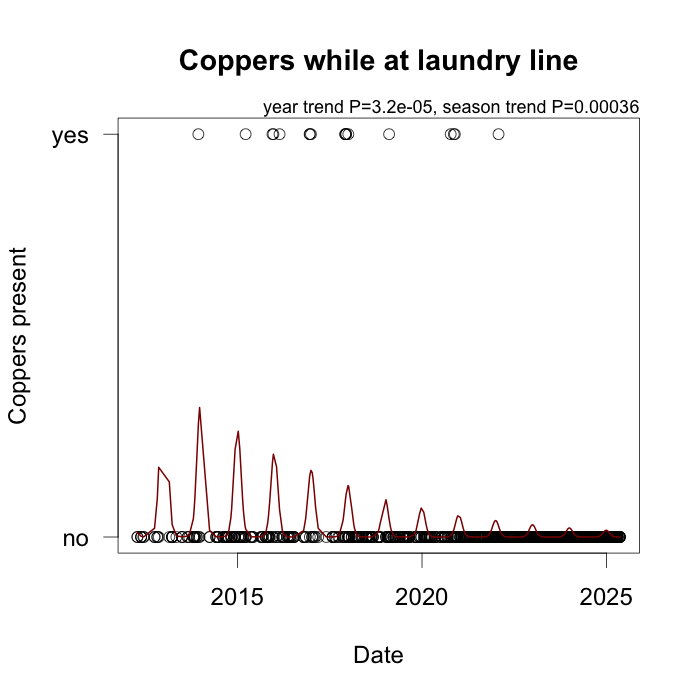
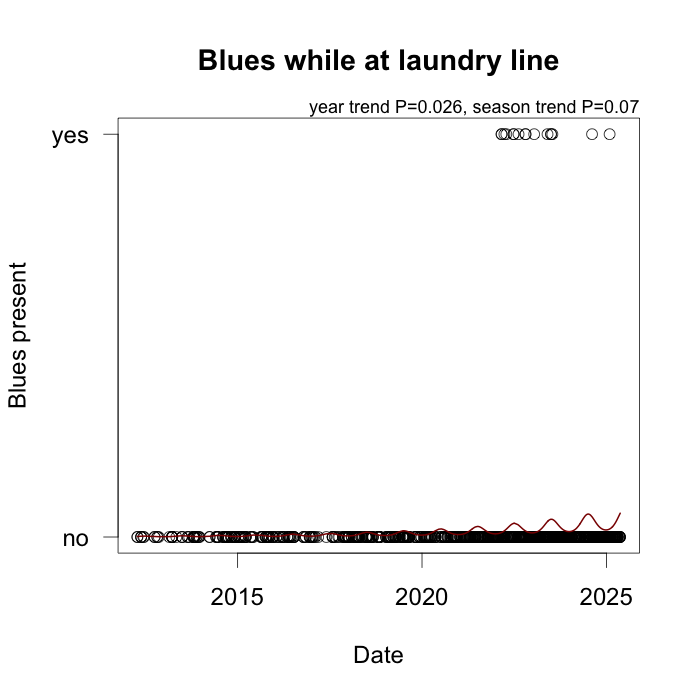
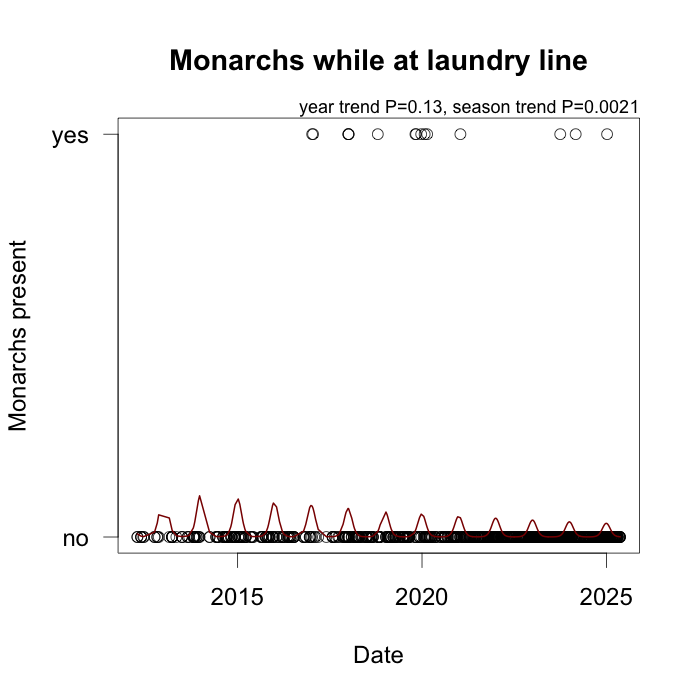
Here are four of the local butterflies from my weekly #wildcounts while hanging out or bringing in my laundry.

Kahukura (NZ red admiral) are trending up, and are more often in our garden in the summer.

Native coppers are trending down (here I've combined the winter copper and glade copper as I don't always stop to chase them to ID which species it is). I don't understand this as their host plant grows nearby.

NZ blues are trending up. I didn't see my first one from the laundry line until 2022 and I've them occasionally since.

Monarchs (the American species, which is wild here) show no trend (we don't plant swan plants so they just fly through).

(The Australian Yellow admirals show no trend, and I see them less frequently than the NZ endemic kahukura.)
2/4

#EcologicalMonitoring #wildcounts #nz #butterflies

A graph showing the increasing numbers of kahukura (NZ red admiral butterflies) seen while I'm hanging out or bringing in our laundry. The fitted line on the graph wiggles up and down with the seasons (more in the summer). The line spans 2012–2025.A graph showing the descreasing numbers of copper butterflies seen while I'm hanging out or bringing in our laundry. The fitted line on the graph wiggles up and down with the seasons (more in the summer). The line spans 2012–2025.A graph showing the increasing numbers of NZ blue butterflies seen while I'm hanging out or bringing in our laundry. The fitted line on the graph wiggles up and down with the seasons (more in the summer). The line spans 2012–2025.A graph showing the numbers of monarch butterflies seen while I'm hanging out or bringing in our laundry. The fitted line on the graph wiggles up and down with the seasons (more in the summer). There's no long-term trend. The line spans 2012–2025.
2025-06-03

Just before Covid knocked me over at the end of last week, I was fortunate to present a talk at the AGM of the Summit Road Society. That's the long-running local community group dedicating to maintaining and restoring the nature and heritage of Christchurch's Port Hills (NZ).

I was asked to talk about how nature has been changing in the Port Hills. Since I live in the hills, I started my talk with our garden. The laundry line, to be exact.

Every time I hang out or bring in our laundry, I count the local birds and butterflies. I've been doing that consistently since March 2012. It allows me to easily see how nature is changing in my garden.

I hadn't updated my graphs since 2023. To keep things simple, the graphs and analyses I showed just use the presence/absence of each species each time I'm at the laundry line (although I also make counts). If you didn't want to count individuals, you could just tick presence/absence and you'd also start to see trends.

I call this kind of simple, consistent, high frequency counting of nature, #wildcounts.

You might be interested in the trends that are appearing. Some species are trending up, others are down, and I don't always understand why.
1/4

#NZ #EcologicalMonitoring #Ōtautahi #Christchurch

A photo of our back garden, taken last week, showing our laundry line (with no laundry hanging on it this day). There are some small trees, a water bath for birds, and an orange sugar water feeder. The lawn needs mowing. On the left of the screen are some of my graphs from my monitoring, since this is a screen shot from my talk about nature in this neighbourhood.
2025-05-23

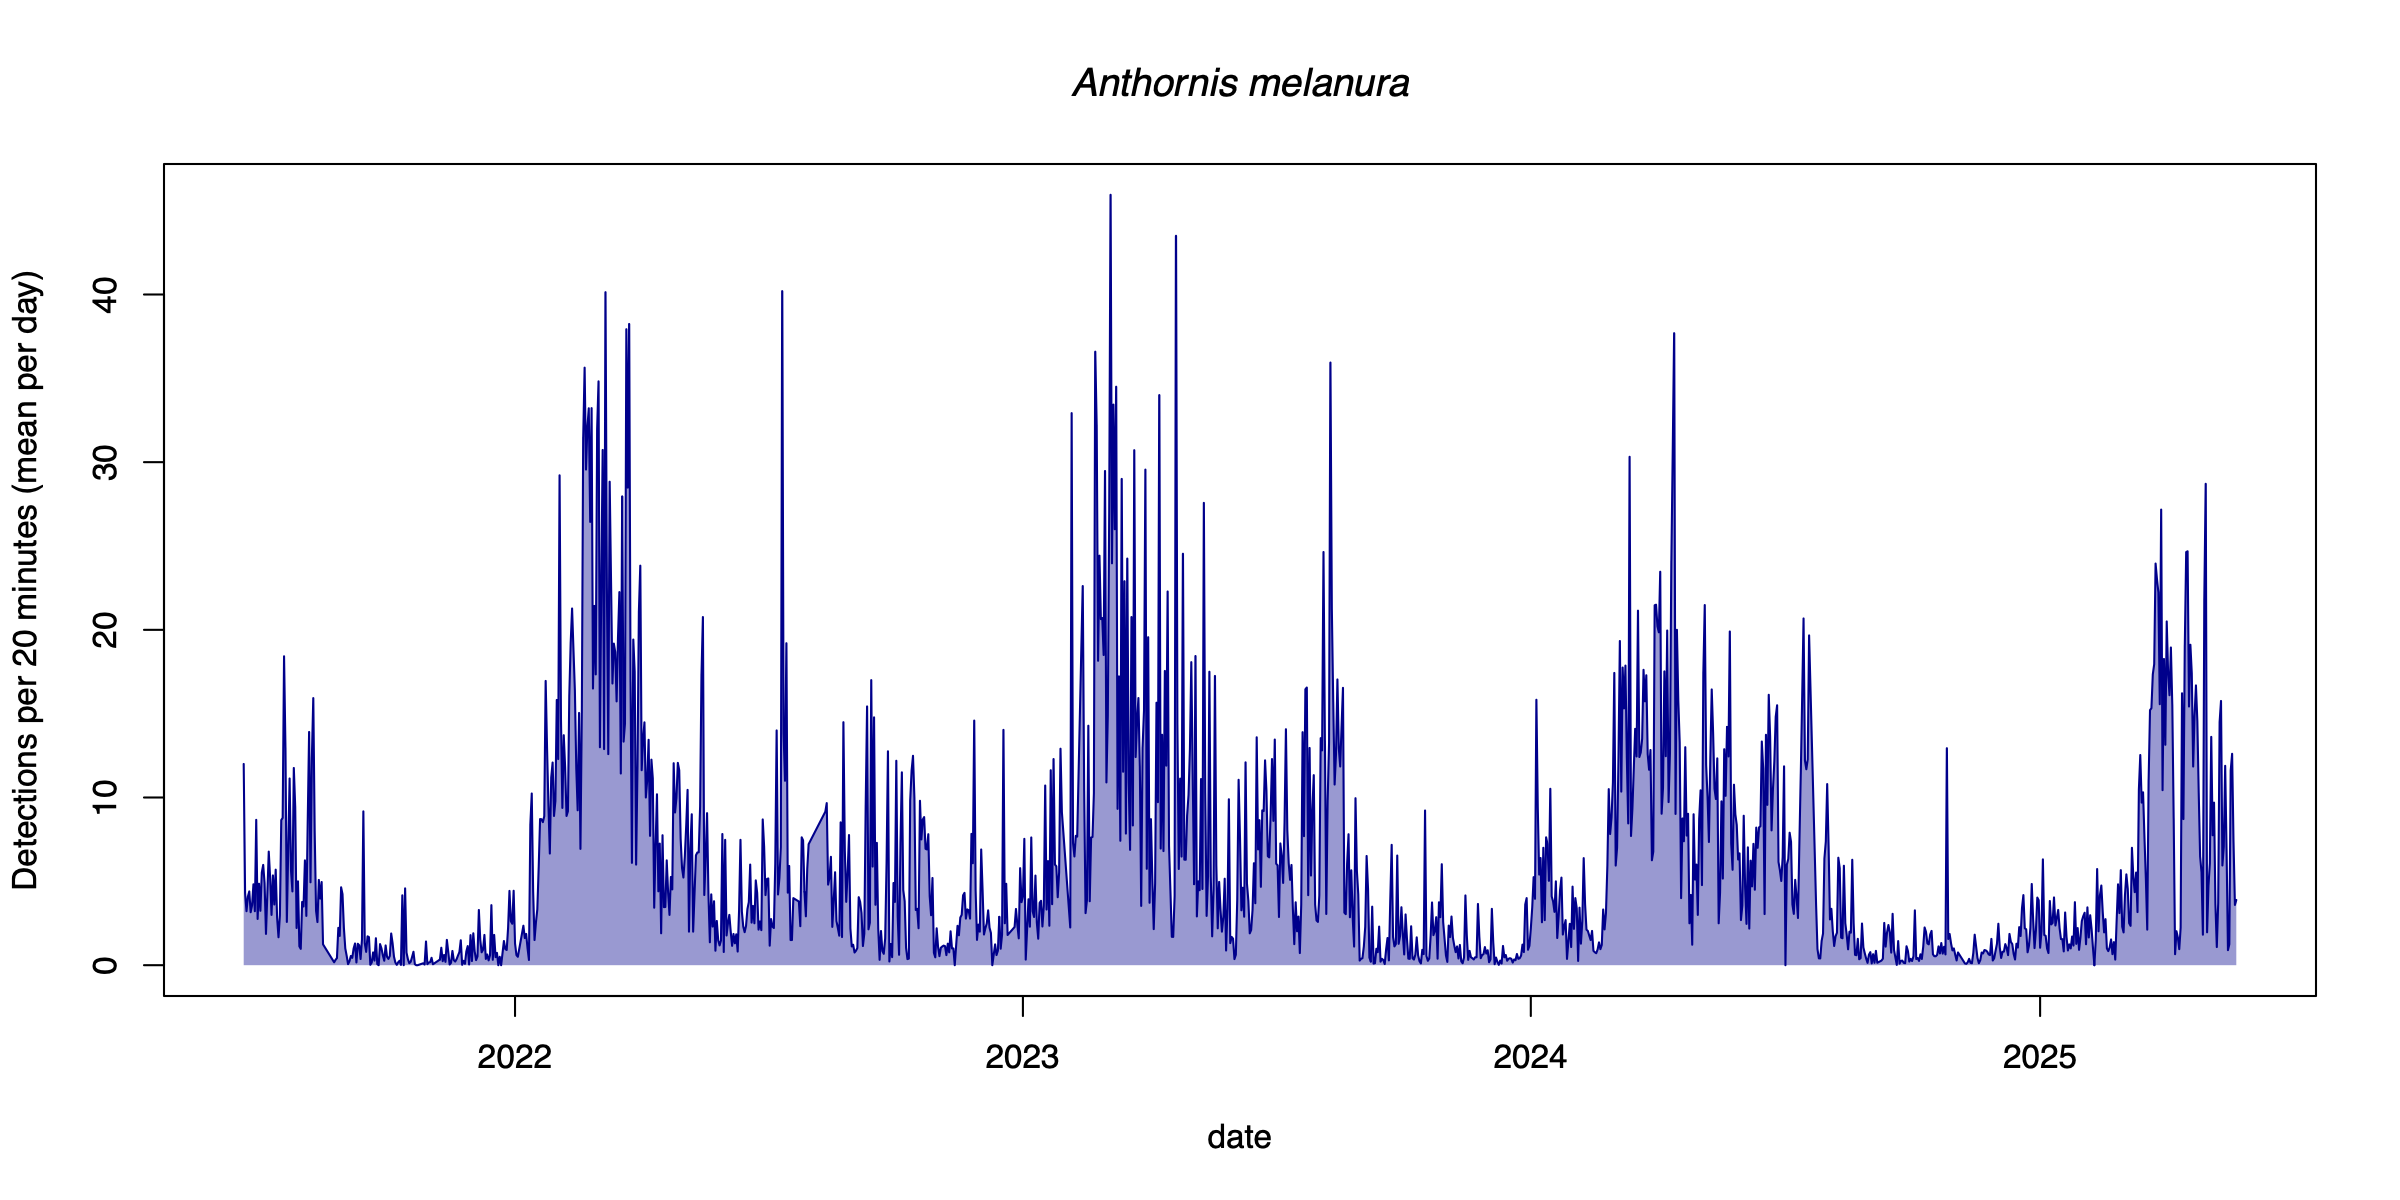
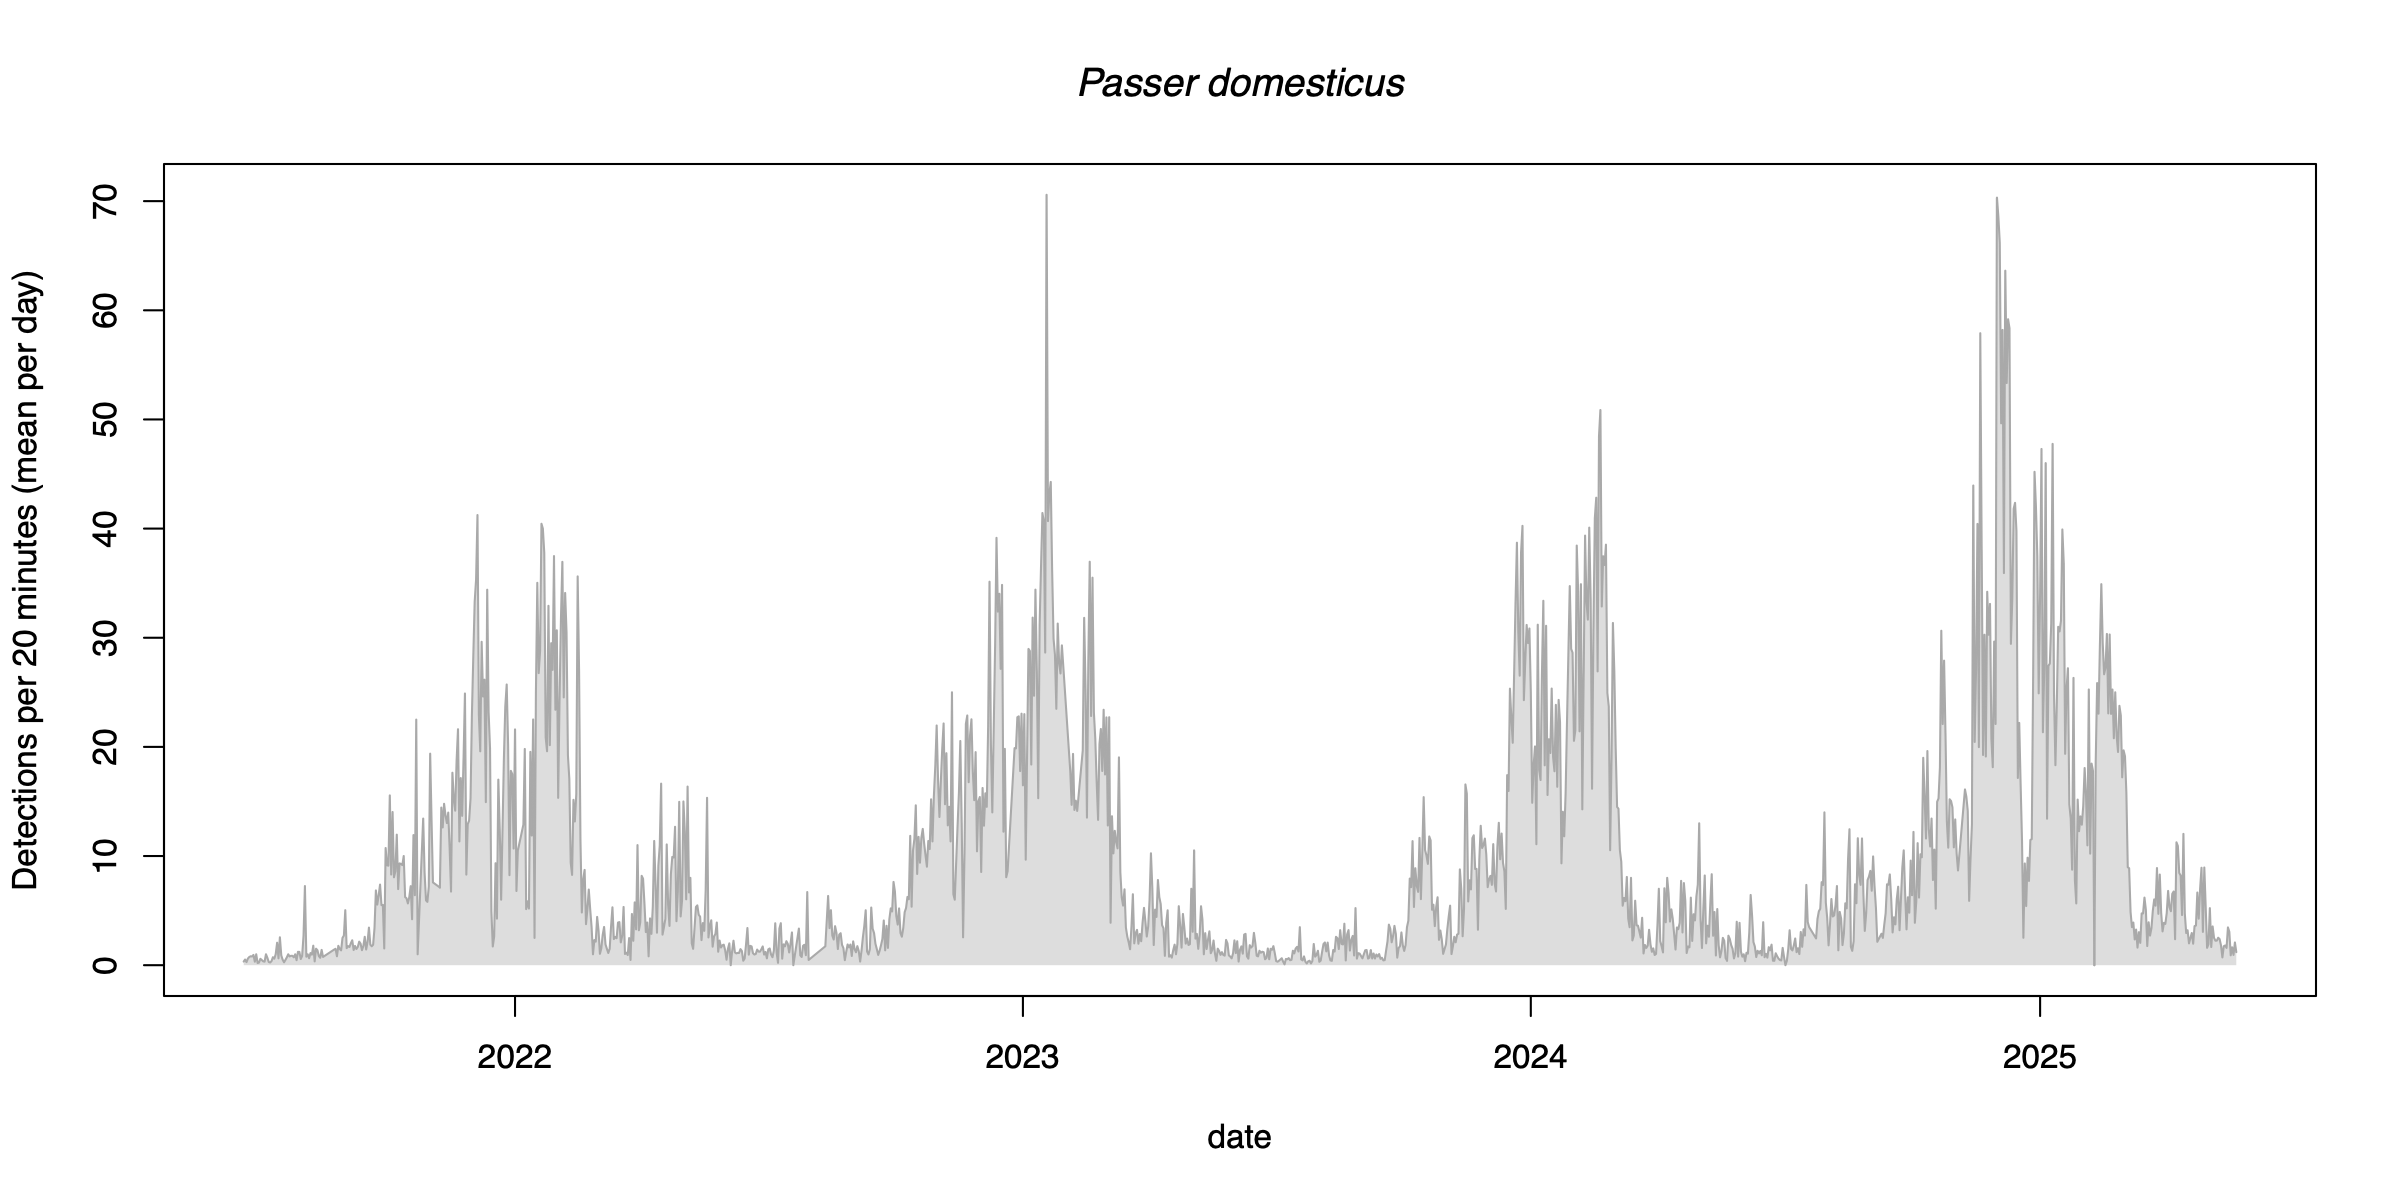
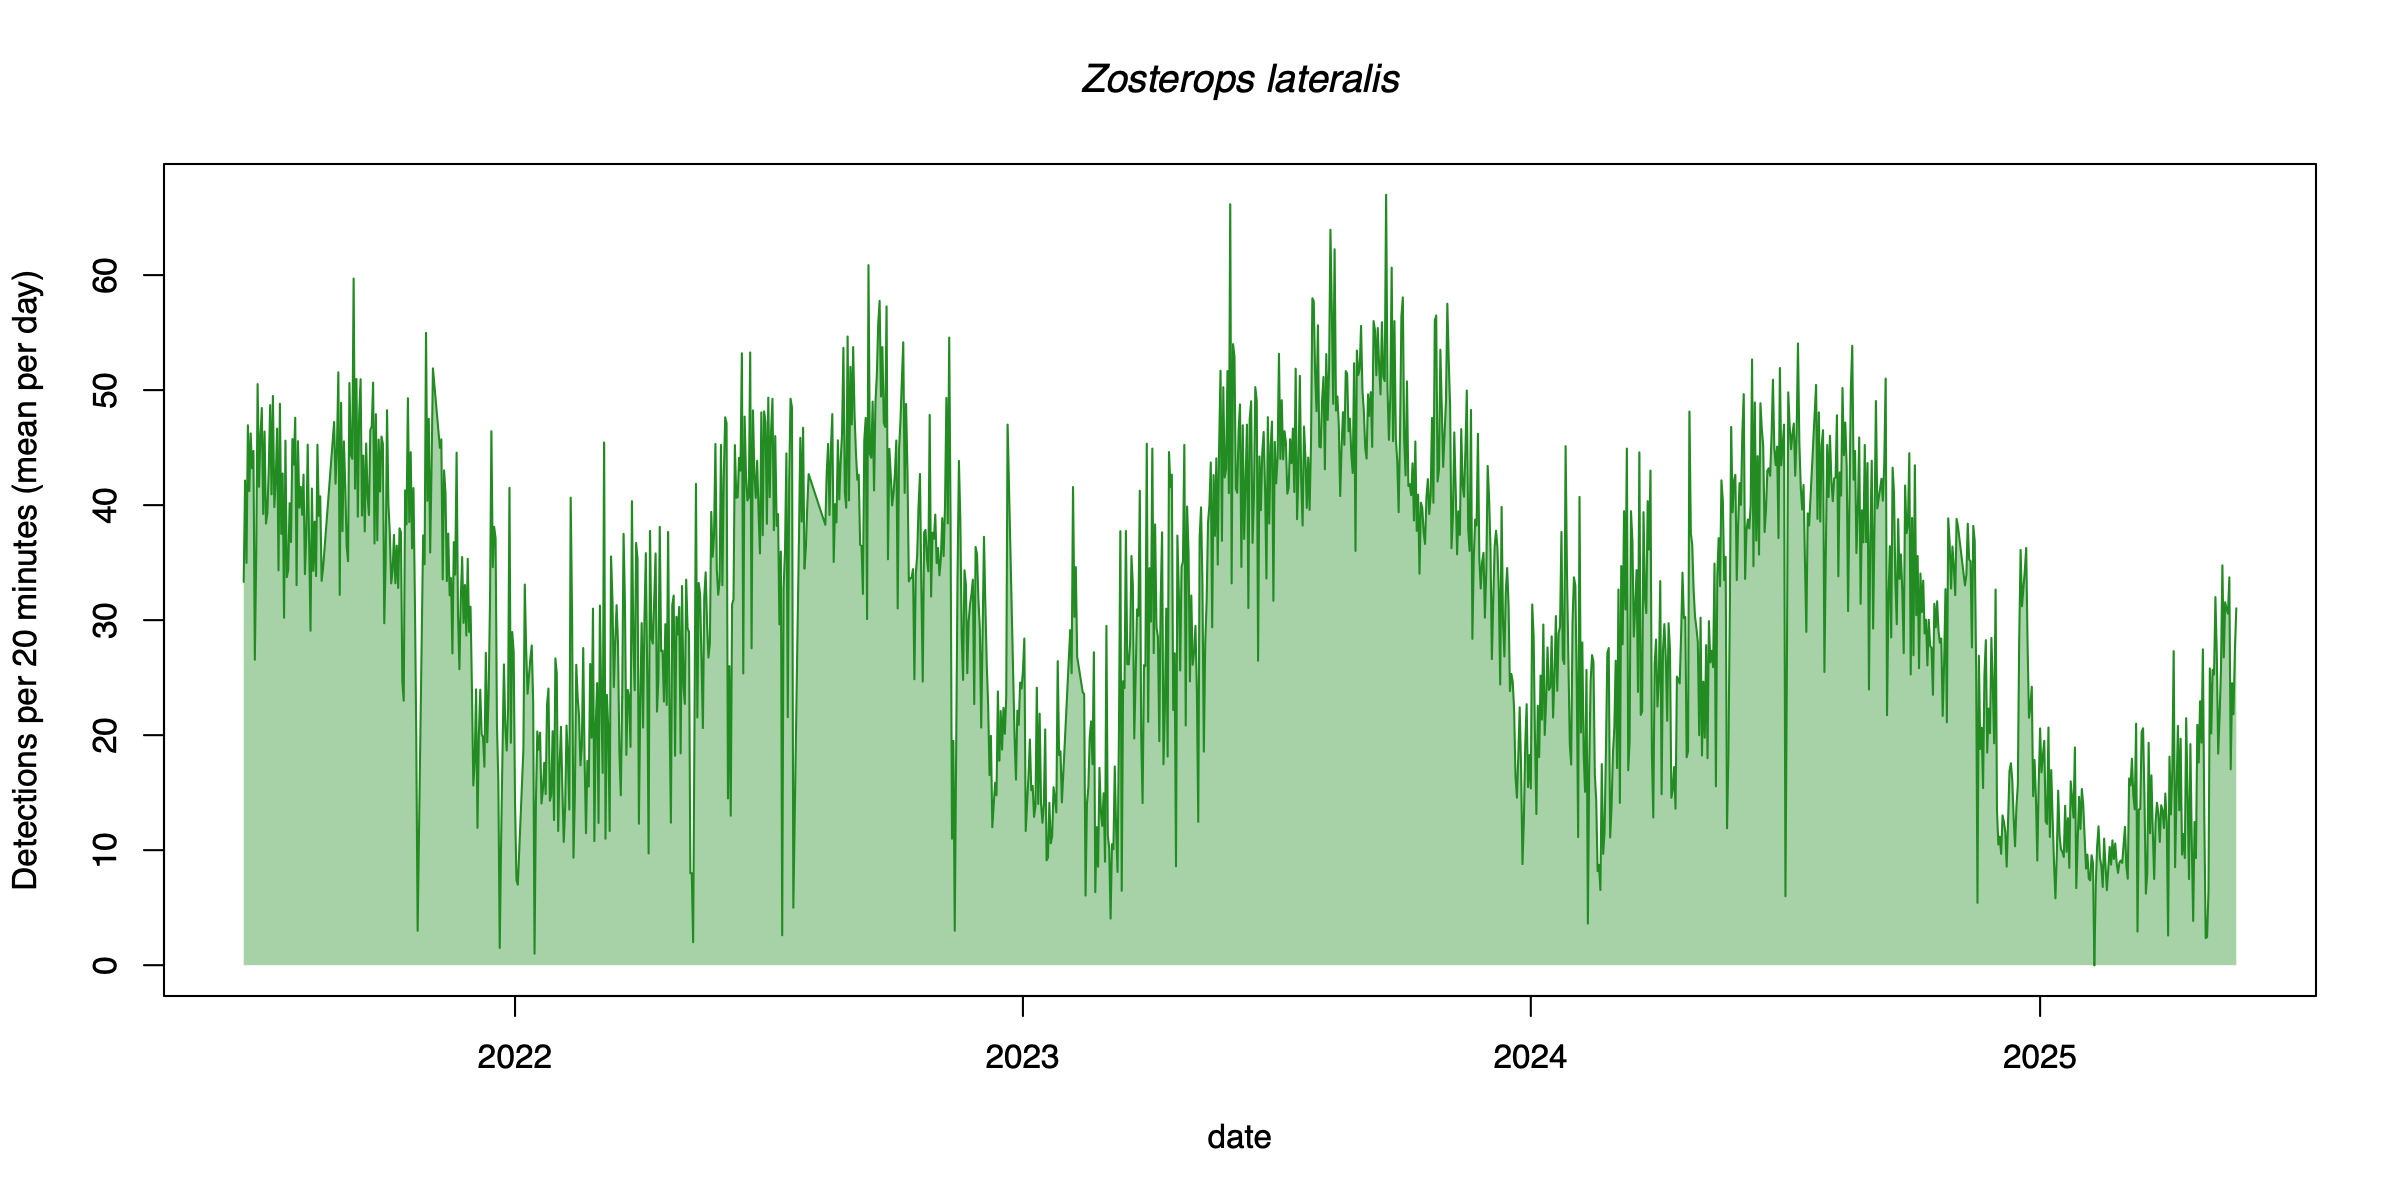
Over lunch I updated my graphs from the AudioMoth bird recorder that runs in our garden in Ōtautahi-Christchurch, New Zealand. I'm coming up on 4-years of continuous recording now, from 2-hours before sunrise to 2-hours after sunset each day.

I find it interesting how different bird species have different, yet annually consistent, seasonal flows in and out of our garden. Here are some examples.

The korimako – NZ bellbird (*Anthornis melanura*), peaks in winter and dips in summer, as does the tauhou – silvereye (*Zosterops lateralis.*), from Australia.

In contrast, the house sparrow (*Passer domesticus*) and greenfinch (*Chloris chloris*), both from Britain, peak in summer and mostly leave the garden in winter.

I don't conpletely understand why this happens. Korimako breed elsewhere up in the hills, so that makes sense, but where do the tauhou go in summer and why do the house sparrows leave in winter?

#birds #nz #seasonality #ecology #EcologicalMonitoring #UrbanEcology

A graph of the songs and calls of the NZ bellbird, or korimako, between June 2021 and May 2025. The y-axis is how many times in 15 second intervals this species was detected per 20-minutes. The detections for korimako peak in autumn and early winter each year. 

The graph is made from recordings in our graden with an AudioMoth processed through BirdNet then graphed using R.A graph of the songs and calls of the house sparrow, between June 2021 and May 2025. The y-axis is how many times in 15 second intervals this species was detected per 20-minutes. The detections for house sparrow peak in summer months each year. 

The graph is made from recordings in our graden with an AudioMoth processed through BirdNet then graphed using R.A graph of the songs and calls of the tauhou – silvereye, between June 2021 and May 2025. The y-axis is how many times in 15 second intervals this species was detected per 20-minutes. The detections for house sparrow peak in summer months each year. 

The graph is made from recordings in our graden with an AudioMoth processed through BirdNet then graphed using R.A graph of the songs and calls of the greenfinch, between June 2021 and May 2025. The y-axis is how many times in 15 second intervals this species was detected per 20-minutes. The detections for house sparrow peak in summer months each year. 

The graph is made from recordings in our graden with an AudioMoth processed through BirdNet then graphed using R.
2025-03-05

I was at home with online meetings today. Some people doodle. I sit by an open window and jot down when I see and hear my favourite wild animals.

It's often quickest to write on paper and enter later. I just typed in today's notes, mostly NZ bellbirds (Bellb) plus fantail (Ft).

I also track the bellbird song types. The main local male song is "doot Doot DEET Doot DEet doot" and females were singing "DEET DOot DEEt Doot DEet".

I know it's odd. 😄

#EcologicalMonitoring #wildcounts #nz #birds

A photo of part of a scrap sheet of paper on which I've written in pencil each time I saw or heard a selection of my favourite birds. You'll see "Bellb" (Bellbird" and "Ft" (fantail) and "Mp" (magpie) here. I write in a shorthand I invented for this. For example, n1xmv is "near one male vocalisation" where near is within 20 metres.The hand-written shorthand notes on paper from the previous image typed into a text editor, before being pasted into my database, where they'll get unpacked by an R script. The bird vocalisations (v) all need to be at least 10 seconds apart, and if one song is longer than 10 seconds, it gets "..@" on the end of it. I try to track the different song types of the NZ bellbirds, which is why you see things like "doot Doot DEET Doot DEet doot".

Everything is consistently noted in 20 minute intervals, with the first five minutes separated by a pipe (|) so I can compare with standard five-minute bird count data.
2025-01-15

I'm off to bed but my computer cranks on. It's using #BirdNet to ID all the bird songs recorded by our garden's #AudioMoth from the first half of the week, while an R script is hooked into AWS to transcribe the 772 geotagged audio notes I made today on my monthly 12 km run up from the city through Victoria Park and around the native forest on Sugarloaf peak.

Some parts of our crazy Big Tech timeline I'm OK with. 😄

#wildcounts #EcologicalMonitoring #nz

A screenshot from my Mac showing a window for the BirdNet app, which has started processing 233 15 minute long consecutive recordings from the AudioMoth recorder in our garden. It's identifying all of the bird songs in the recordings. The other window is R, showing progress transcribing my wildcounts audio notes from my ecological surveys this week. It's on its 7th survey, which has 772 audio notes from my hill run this afternoon. The smaller window in the bottom right shows progress in copying the 3.5 days of AudioMoth recordings (13.19 GB) across to our NAS for storage.
2025-01-10

I was puzzling over the weak seasonal pattern in the tauhou in my BirdNet graphs, since they're more common in the winter in our garden. I carefully checked my R code. Sure enough, I found an error on one line, where I'd added the BirdNet seconds onto the start time from the filename. Turns out adding seconds onto time is a bit slipperier in R than I'd thought.

Here are the greatly improved graphs (up to yesterday's recordings).

#birds #EcologicalMonitoring #BirdNet #AudioMoth #nz

A graph showing the trends in bird singing per day for four native birds that visit our garden in Christchurch, New Zealand. From the top, there's the tauhou (silvereye), korimako (bellbird), tīrairaka (South Island fantail), and riroriro (grey warbler). Tauhou are common in our garden and peak in winter months. Korimako swing up and down with years and seasons, most common in winter months, but show no clear long-term trend. Tīrairaka appear to be more common in winter months and vary a lot. Riroriro were more common in the early months than later months. Both tīrairaka and riroriro are detected much less frequently than the others and it's hard to see their data on the graph as I'm using the same scale for each species. The y-axis is the average (mean) daily number of detections per 20 minute interval (where one detection is whether or not a bird was detected in 15 seconds).A graph of the relative proportions of the bird songs each day made by different species in my garden in Christchurch, New Zealand. I've filtered out the rarities and obvious mis-identifications. The graph goes from 20 June 2021 to 5 January 2025. By far the most common bird is the orange on the graph, which is tauhou/silvereyes, which have a prominent winter peak. The next most common is house sparrows, followed in winter months by korimako(bellbirds) visiting our sugar water feeders, and then blackbirds.
2025-01-08

Since June 2021 I've had an #AudioMoth constantly recording bird song in our garden from 2 hours before sunrise to 2 hours after sunset. Over the past months I've been using #BirdNet to identify all the bird species.

Today I've managed to spit out my first graphs. I'm excited to finally see results so wanted to share them. There's all sorts of things happening.

Next I'll be comparing these automated patterns with all the counts I make manually.

#birds #EcologicalMonitoring #nz #garden

A graph of the relative proportions of the bird songs each day made by different species in my garden in Christchurch, New Zealand. I've filtered out the rarities and obvious mis-identifications. The graph goes from 20 June 2021 to 5 January 2025. There's quite a lot of variation day-to-day but surprisingly weak season patterns and no big long-term trends (that I've noticed so far).A graph showing the trends in bird singing per day for four native birds that visit our garden in Christchurch, New Zealand. From the top, there's the tauhou (silvereye), korimako (bellbird), tīrairaka (South Island fantail), and riroriro (grey warbler). Tauhou and constantly common in our garden. Korimako swing up and down with years and seasons but show no clear long-term trend. Tīrairaka appear to be more common in winter months and vary a lot. Riroriro were more common in the early months than later months. The y-axis is the average (mean) daily number of detections per 20 minute interval (where one detection is whether or not a bird was detected in 15 seconds).
2024-12-02

"chongli me to hi one"?

I've just automatically transcribed my 19,848 audio notes from November, from my ecological surveys around Ōtautahi-Christchuch, NZ. I spoke nature observations into my phone for 3065 minutes (51 hours), mostly while biking and running.

Now I've got some data cleaning to do. Most transcriptions come through spot on, or close to it, but the odd one is like "chongli me to hi one". Here I said "chaffinch song left mid ahead one".

#wildcounts #EcologicalMonitoring #nz

A screenshot from my wildcounts database showing newly downloaded transcriptions from my audio notes from November, in this case from a run up in the hills near where I live in NZ. The transcriptions all generally look clean (eg "fantail song left far one") and then there's "chongli me to hi one" which I needed to listen to and manually transcribe.
2024-11-13

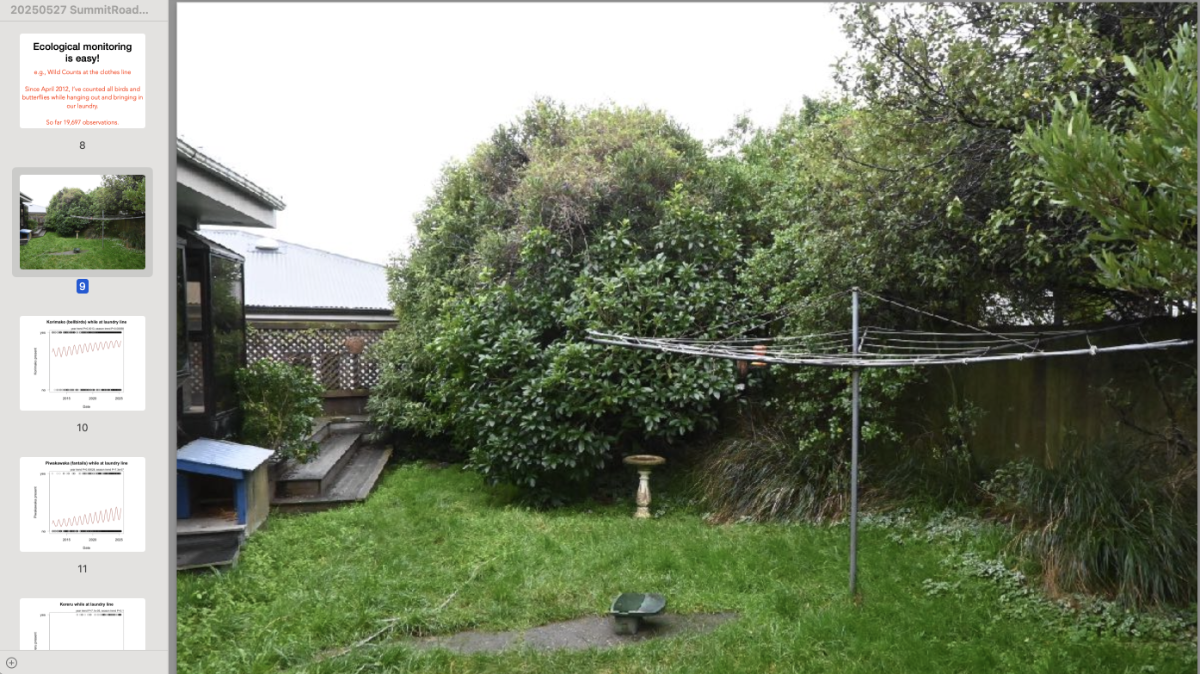
Here's part of my home office desk yesterday.

In the centre of the tangle is my iPad working as a third screen for my laptop. On it are the wildcounts I make through the day, in 20 minute intervals, of whenever I hear or see bellirds, fantails, grey warblers, kereru, and other pre-human native NZ birds, plus butterflies and calling cicadas. I've done this whenever next to an open window, since 2012.

#EcologicalMonitoring is easy!

Also, my desk is a tangled mess. 😄

flic.kr/p/2qtSBdc

2024-10-19

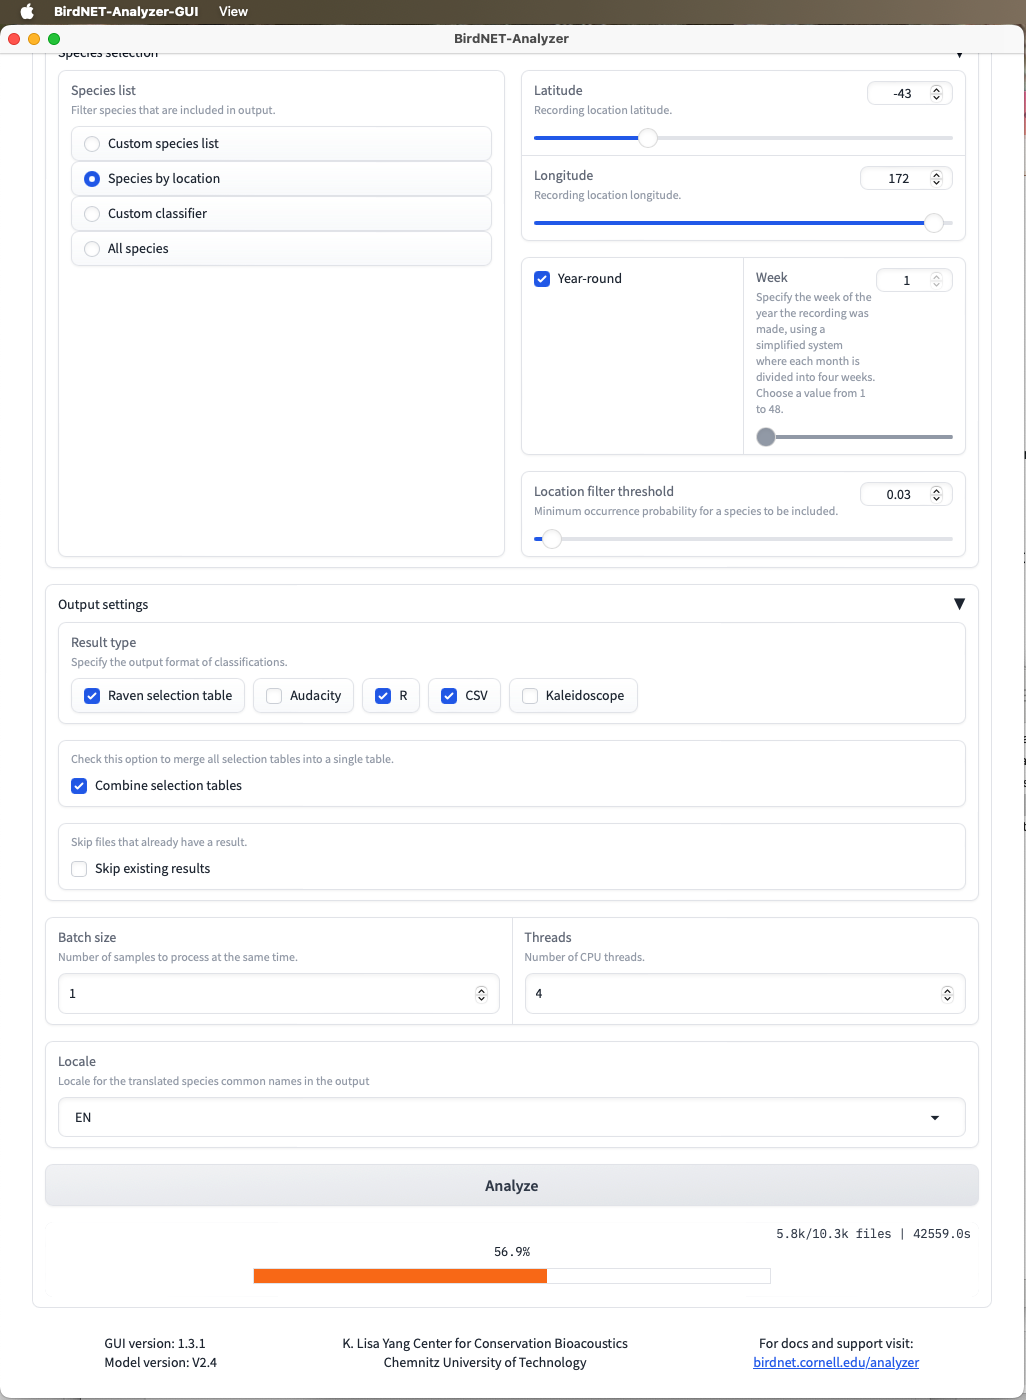
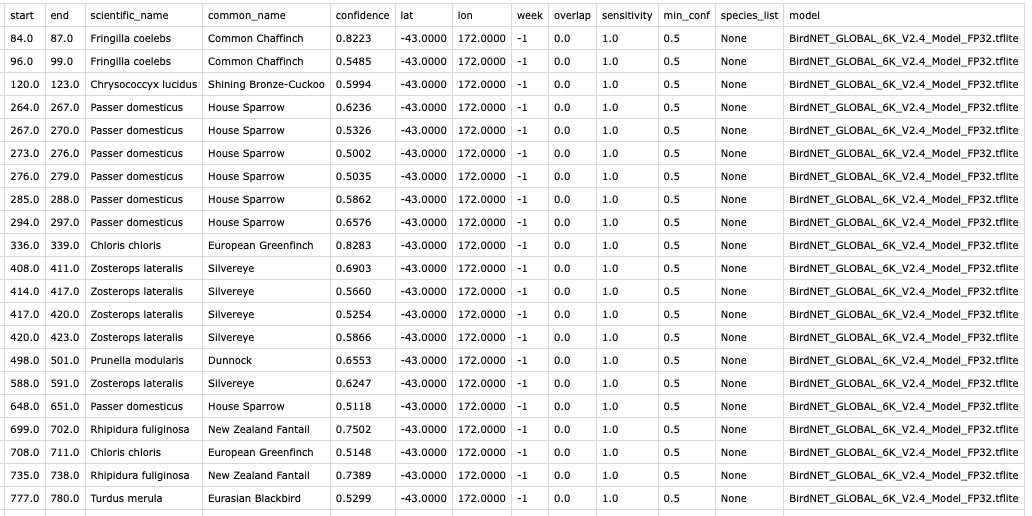
Automated bird song ID is about good enough now so I've got my computer started on the job of identifying all the bird songs from my garden since June 2021. That's when I started recording with an AudioMoth from 2hr before sunrise to 2hr after sunset each day.

The BirdNet-Analyzer app is an offline app from Cornell University's Lab of Ornithology and Chemnitz University of Technology, trained on over 6,000 bird species worldwide.

github.com/kahst/BirdNET-Analy
#EcologicalMonitoring #birds #nz

A screenshot of the BirdNet app, which can take a folder of audio recordings and identify the most prominent bird species it hears in every 3 second section of the recording. On the app screenshot I've set BirdNet to the latitude and longitude of my garden, in New Zealand, so that informs its algorithm.

The screen shows 50.9% done. This is me running 6-months of my recording and my M1 Macbook Air has been running on this for 23-hours now.A screenshot of part of a spreadsheet from the results of BirdNet-Analyzer, running on the audio recording from my garden on 7 October 2025 from 6:45 pm. A variety of species are listed, along with the confidence that BirdNet has in its identifications.
2024-10-15

Today I did my monthly wild counts survey up in the Port Hills of Ōtautahi-Christchurch, New Zealand, mapping and counting assorted species.

It was a cool and windy day, but still a satisfying adventure. This was my 103rd survey of this 12 km route, which takes me from the edge of the city up into wild native forest and back.

Here are some views along the public walking tracks.

#Ōtautahi #Christchurch #NZ #wildcounts #EcologicalMonitoring

A view of Latters Spur track, a dirt track along a fence line on a hill slope with city visible through the cloud down below.A view of the track through the grassland through the northern side of Sugarloaf, one of the peaks of the Port Hills above Christchurch city.A photo of the track through the old planted forest of Victoria Park on the edge of Christchurch City. This is Tawhairaunui track.A view of a narrow forest track with rock steps. This is Mitchell's track through the wild native forest on the southern side of Sugarloaf peak in the Port Hills of Christchurch City.
2024-07-16

Each month I run 12 km up from the edge of the housing in Cashmere in Ōtautahi-Christchurch city, through Victoria Park, and around the tracks in the old native forest on the back of Sugarloaf. Along the way I map and count a bunch of species (eg all birds) and take photopoints.

Today was my **100th survey** of this route.

Here's the upper Harry Ell track in July 2017, 2018, 2021, and 2024, showing the gradual recovery after the February 2017 fire.

#EcologicalMonitoring #wildcounts #nz

A photo in May 2017 of the upper section of the Harry Ell track in the Christchurch Port Hills with bare ground and young grass growing after the Port Hills fire of February 2017.

Full-res photo is on Flickr at https://www.flickr.com/photos/mollivan_jon/36745280586/A photo in July 2018 of the upper section of the Harry Ell track in the Christchurch Port Hills with lots of plastic combi guards protecting recently planted native plants, part of the recovery from the Port Hills fire of February 2017.

Full-res photo is on Flickr at https://www.flickr.com/photos/mollivan_jon/43855368561/A photo in July 2021 of the upper section of the Harry Ell track in the Christchurch Port Hills. The young trees, most planted in 2017, are now established and growing.

Full-res photo is on Flickr at https://www.flickr.com/photos/mollivan_jon/53860587664/A photo in July 2024 of the upper section of the Harry Ell track in the Christchurch Port Hills. The young trees are now fast filling in the space opened by the 2017 fire.

Full-res photo is on Flickr at https://www.flickr.com/photos/mollivan_jon/53859324132/
2024-07-01

It was raining on my bike ride home from work tonight so my iPhone and microphone get wrapped in plastic bags, so I can continue to count the wild as I ride.

As I do.

🙂

wildcounts.org/blog/2018/06/02

#EcologicalMonitoring #wildcounts #nz #BikeTooter

A photo of the handlebars of my bike, at night, with my iPhone turned on inside a plastic bag and attached to a microphone on a stalk, also in a plastic bag. This allows me to keep making audio notes of nature as I ride, even in the rain.

Full-res photo: https://www.flickr.com/photos/mollivan_jon/53827661098/A photo of the handlebars of my bike, at night, with my iPhone turned on inside a plastic bag and attached to a microphone on a stalk, also in a plastic bag. This allows me to keep making audio notes of nature as I ride, even in the rain.

Full-res photo: https://www.flickr.com/photos/mollivan_jon/53827749959/
2024-05-26

One of the notable birds from my Port Hills bike ride yesterday was kōtare, the NZ kingfisher. I saw 5 on them riding to Lincoln. They like to perch on power lines, especially in the farmland, where I expect they catch lizards and small birds.

Over 59 monthly rides since 2019, my median count per ride is 1. I once saw 6 kōtare, in April 2021, but otherwise <5.

There's no clear long-term trend. In this age of environmental change, that's good news.

#birds #WildCounts #NZ #EcologicalMonitoring

A photo of a kōtare, the NZ kingfisher, seen yesterday in Ōtautahi-Christchurch, NZ.A map showing all the places I've seen kōtare, the NZ kingfisher, over 59 Port Hills bike rides since 2019. The sightings are scattered across the route, especially in the farmland north of Te Waihora-Lake Ellesmere.A graph showing the total number of kōtare, NZ kingfisher, that I've seen on each monthly bike ride. The highest is 6, in April 2021, and the next highest is 5, from yesterday. While their numbers fluctuate, there's no clear long-term trend up or down in this landscape.
2024-04-22

We are hiring a Fall Ecological Monitoring Assistant under the Green Jobs Internship Program. Gain valuable environmental monitoring experience while gathering vital data on the health of our habitats at rare!

To learn more and apply, visit: raresites.org/fall-ecological-

#Conservation #GreenJobs #WaterlooRegion #EcologicalMonitoring

2024-04-09

For a workshop talk I'm working on, I looked up the public biodiversity data for Ōtautahi-Christchurch, #NZ. #iNaturalistNZ has 282,811 observations. #GBIF has 407,858 obs (incl. 115,098 research grade obs from iNat). I tallied up how many #wildcounts I've made from Ōtautahi, mostly from my bike rides to work and my weekend runs, and it's about 1,584,522 observations. So, about 4x everything else!

It underscores how very little biodiversity monitoring NZ does.

#EcologicalMonitoring

A map of Ōtautahi-Christchurch city, NZ, showing points for all of the species observations I've made along my travels through the city. Many are surveys along regularly repeated routes. A lot of this was recorded as audio notes that I recently finished transcribing and I'm still cleaning up so I can release it all (to somewhere—NZ has no biodiversity infrastructure for data like this and no funding for it either).
2024-02-18

Here are 3 Australian critters I saw on my run yesterday in Ōtautahi-Christchurch, NZ. All are recent arrivals to the city and are spreading.

Little humped spiders showed up in 2014 and have since spread out to Pegasus, Leeston & Little River.

Passionvine hoppers showed up in Christchurch on iNaturalistNZ in 2016. They've exploded since & eat a wide range of plants.

Steelblue ladybirds first showed up in Christchurch in 2020.

#BiologicalInvasions #nature #EcologicalMonitoring #nz #WildCounts

A photo of lots of passionvine hopper insects feeding on a stem of a native poroporo plant. Adult passionvine hopper insects look like little moths (sort of).

https://inaturalist.nz/observations/199618196A photo of a messy spider web on the ground filled with lots of small spiders. These are Australian little humped spiders and they're semi-social, living in a big messy shared web. Their first record in New Zealand was in Christchurch in 2014.

https://inaturalist.nz/observations/199618186A photo of a spiky yellow larva of a steelblue ladybird.

https://inaturalist.nz/observations/199620012A photo of an adult steelblue ladybird, which is small, round, and steelblue. The species was introduced into NZ around 1900 as a biocontrol agent for citrus pests, and is now widespread in the North Island, but only reached Christchurch in 2020.

https://inaturalist.nz/observations/199618181

Client Info

Server: https://mastodon.social
Version: 2025.04
Repository: https://github.com/cyevgeniy/lmst