Generating maps with Folium is SO much easier than working with Leaflet.js directly in JavaScript. Highly recommend! #folium #leafletjs https://python-visualization.github.io/folium/latest/#
#leafletjs
Finally! @leaflet, the venerable lightweight JS tilemap display library, is gearing up for a 2.0.0 release! 🎉
🇵🇹 Tutorial de introdução ao Leaflet 🇧🇷
🗺️ Quer aprender cartografia interativa com #LeafletJS?
Publiquei um **tutorial completo e progressivo**, ideal para iniciantes:
✔️ Camadas e controle de exibição
✔️ Dados GeoJSON
✔️ Popups e ícones personalizados
✔️ Mini-projeto final com publicação online
👉 Acesse aqui: https://www.sigterritoires.fr/index.php/pt
🗺️ ¿Quieres aprender cartografía interactiva con #LeafletJS?
He comenzado a publicar un **tutorial paso a paso** para principiantes:
✔️ Capas y control de visibilidad
✔️ Datos GeoJSON
✔️ Popups e iconos personalizados
✔️ Mini-proyecto final y publicación web
➡️ Disponible aquí: https://www.sigterritoires.fr/index.php/es/
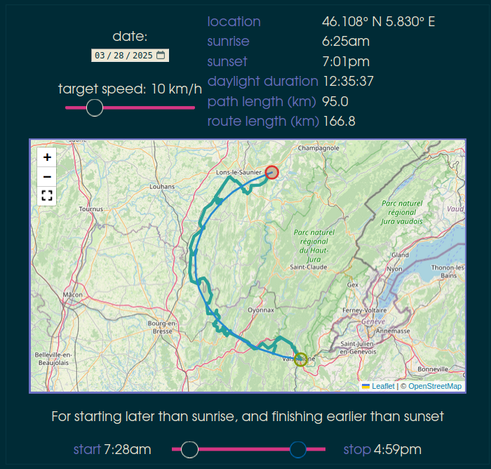
Want to go somewhere this weekend, but not sure where?
Try following your shadow...or if you don't want to do that - have a look at where it would have taken you.
I made a thing, and wrote about it:
https://tlohde.com/blog/2025/03/shadow-chasing/
#WebMapping #map #GnomonOnWheels #shadow #RoutePlanning #indieweb #blog #leafletjs #suncalc #gis #gischat #osm #cycling #builtwith11ty #eleventy
#firefox135 ships a regression perf fix (https://bugzilla.mozilla.org/show_bug.cgi?id=1848824) that affected users on potato phones (2016 era) scrolling a #leafletjs map with many markers. It all started with dotwatching #tcrno9
ps: bmo is a nice experience still, I think due to the maintenance efforts of Kohei Yoshino and others. You just have to know there is a "instant search" tab when checking for already filed bugs
Released version 0.5.0 of django-geocad, a #django app that imports #cad drawings and shows them on #leafletjs Maps!
https://pypi.org/project/django-geocad
Breaking changes, follow instructions when upgrading from 0.4.0!
I guess one reason why I haven’t done heat maps before is because I don’t think they are as useful compared to other cartographic #dataviz techniques such as binning and choropleths. But maybe I’m missing something?
Anyway, for the heat map, I used the Leaflet.heat #LeafletJS plugin by Volodymyr Agafonkin, creator of Leaflet: https://github.com/Leaflet/Leaflet.heat
The hexbin map uses the #H3 hex grid system with the #Viridis Inferno sequential palette.
🧵 2/2
I'm working with #LeafletJS today.
The Bing ML buildings data is from this GitHub repo and first released in 2022: https://github.com/microsoft/IdMyPhBuildingFootprints
I used the following tools/services:
▪︎ @geofabrik for the OSM buildings
▪︎ #OverpassTurbo for extracting clipping polygons from OSM
▪︎ Osmosis for filtering the OSM buildings
▪︎ @qgis #QGIS for GeoJSON clipping and data conversion
▪︎ A couple of hand-coded Perl scripts for data manipulation
▪︎ #TurfJS
▪︎ #LeafletJS for rendering
▪︎ H3 for hexbinning
▪︎ @GIMP #GIMP for final map prep
🧵 3/4
Create Stunning Maps Effortlessly - Master React Leaflet with TypeScript! https://jsdev.space/mastering-react-leaflet/ #react #leafletjs #typescript #vite
🌍 Nouvelle vidéo : Créez une carte OpenStreetMap avec #LeafletJS, #PHP et #MySQL ! 📍
Apprenez à :
✅ Créer une API en PHP
✅ Connecter MySQL
✅ Afficher des données dynamiques
🔗 Découvrez la vidéo : https://youtu.be/OFMz4y9uY0M
🌍 NOUVELLE VIDÉO DISPONIBLE ! 📹
Découvrez le dernier tutoriel pour intégrer une carte OpenStreetMap sur votre site web avec Leaflet.js ! 🚀 Suivez les étapes détaillées pour créer des cartes interactives et personnalisées, parfaites pour enrichir vos pages web. 📍
📌 Regardez la vidéo ici : https://www.youtube.com/watch?v=N3hTwPvn_Xk
👉 Ne manquez pas ces astuces et conseils pratiques !
#OpenStreetMap #LeafletJS #WebDevelopment #Cartographie #TutorielWeb #NouvelleTechno
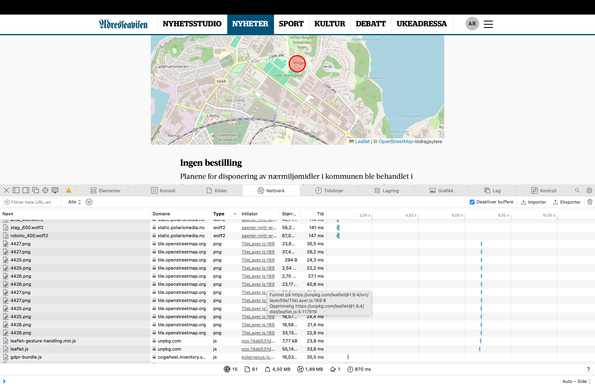
Et absolutt minimum burde være at Scibsted og Polaris Media gir midler og ressurser til https://leafletjs.com
F.eks. https://github.com/sponsors/Leaflet
#OpenStreetMap #Schibsted #PolarisMedia #Adressa #allheimen #norsktut #Leaflet #LeafletJS
Jeg regner med Schibsted/Polaris Media bidrar rundhåndet til #OpenStreetMap.
Det hadde vel ikke kostet dem så mye i det minste å legge kart-flisene bak en mellomlagrende reversproxy slik at trafikken ikke går direkte til osm?
#Schibsted #PolarisMedia #Adressa #allheimen #norsktut #Leaflet #LeafletJS
Currently I'm trying to control #leafletJS with #AlpineJS that gets mounted by #unpolyJS (or #htmx / #turbo for the sake of hashtags). It's a freaking nightmare, because there are no full page reloads anymore and I can't find anything how to teardown Alpine when Unpoly unloads the page fragment.
Either I'm a total idiot (high possibility) or alpineJS tries to be too clever and doesn't surface an Alpine.destroy() method.
Join the next UNIGIS Talks episode: "#LeafletJS Session - From Basics to Brilliance in #WebMapping!" 🗺️💻
💡 Our guest speaker is Suman Baral, who is a #geospatial #dataanalyst and #GIS #developer.
💻 Jan., 10th, 2024 I 2:15 to 2:45 pm (CET) I online
🔗 https://attendee.gotowebinar.com/register/5398655304904510550?source=mastodon
#leaflet #leafletmapping #leafletmaps #geoinformatics #geoinformation #cartography #webmap
#DailyBloggingChallenge (143/200)
TIL how zooming on maps work. The fascinating part is how much data needs to be store to make it feel seamlessly.
In (1) they work with an initial presetation of Earth on a 256px x 256px square for a zoom of 0.
When zooming in by one level the spuare length is doubled and thereby the Earth is being presented on 4 times 256px x 256px square for a zoom of 1.
This can be generalized to $4^{zoom}$ for square count and $squareLength_0 * 2^{zoom}$ for square length.
#LeafletJs states in (1) that tile servers max out at a zoom level of 18, whereas #OpenStreetMap’s website goes to zoom 19. At zoom 19 the legend distance is at 5m. On #OsmAnd the max zoom achieves a legend distance of 1m.
One can just imagine how much data is being stored/provided to achieve such a zoom level of detail.
References:
Finally finished upgrading one of my #leafletjs maps away from the old Stamen Maps tiles to Stadia Maps, using this tutorial: https://en.osm.town/@stadiamaps/111365605705625797
It was but 30 additional seconds' work to switch to vector tiles. Hooray!
