
Mapping The Effectiveness Of Climate Solutions Using Geospatial Data
--
https://www.linkedin.com/pulse/mapping-climate-solutions-using-geospatial-data-ankur-shah-0uwhf/ <-- shared LinkedIn technical article
--
[this post should NOT be considered an endorsement of any specific technical approach or vendor]
“When tackling climate change, data is only as powerful as our ability to see it, interpret it, and act on it. This is why geospatial visualization is becoming indispensable for climate solutions: it allows decision-makers, businesses, and communities to connect complex science with real-world action…”
#GIS #spatial #mapping #spatialanalysis #spatiotemporal #global #pollution #climatesolutions #pollution #industry #cost #visualisation #webmap #climatechange #solutions #realworld #actionable #risk #hazard #mitigation
#webmap


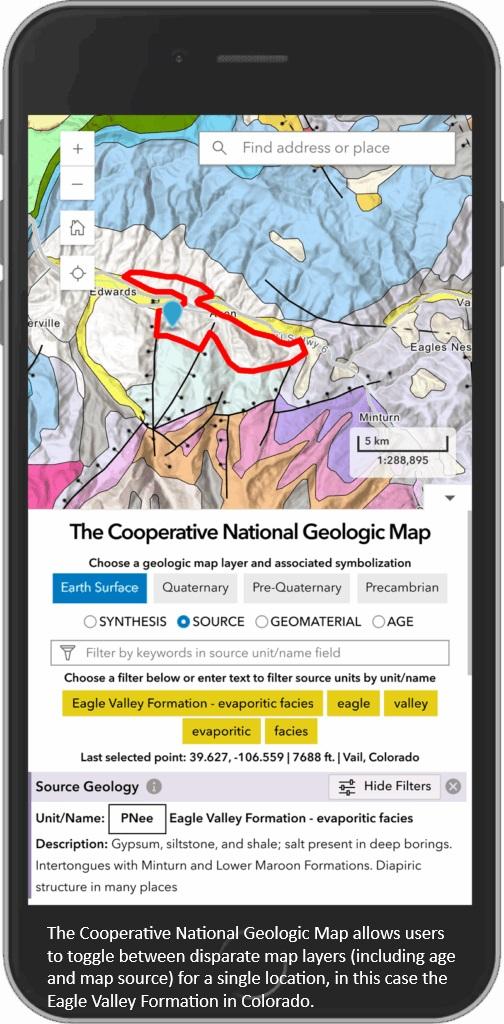
New USGS Map Offers An Interactive Look At The Rocks Beneath Our Feet
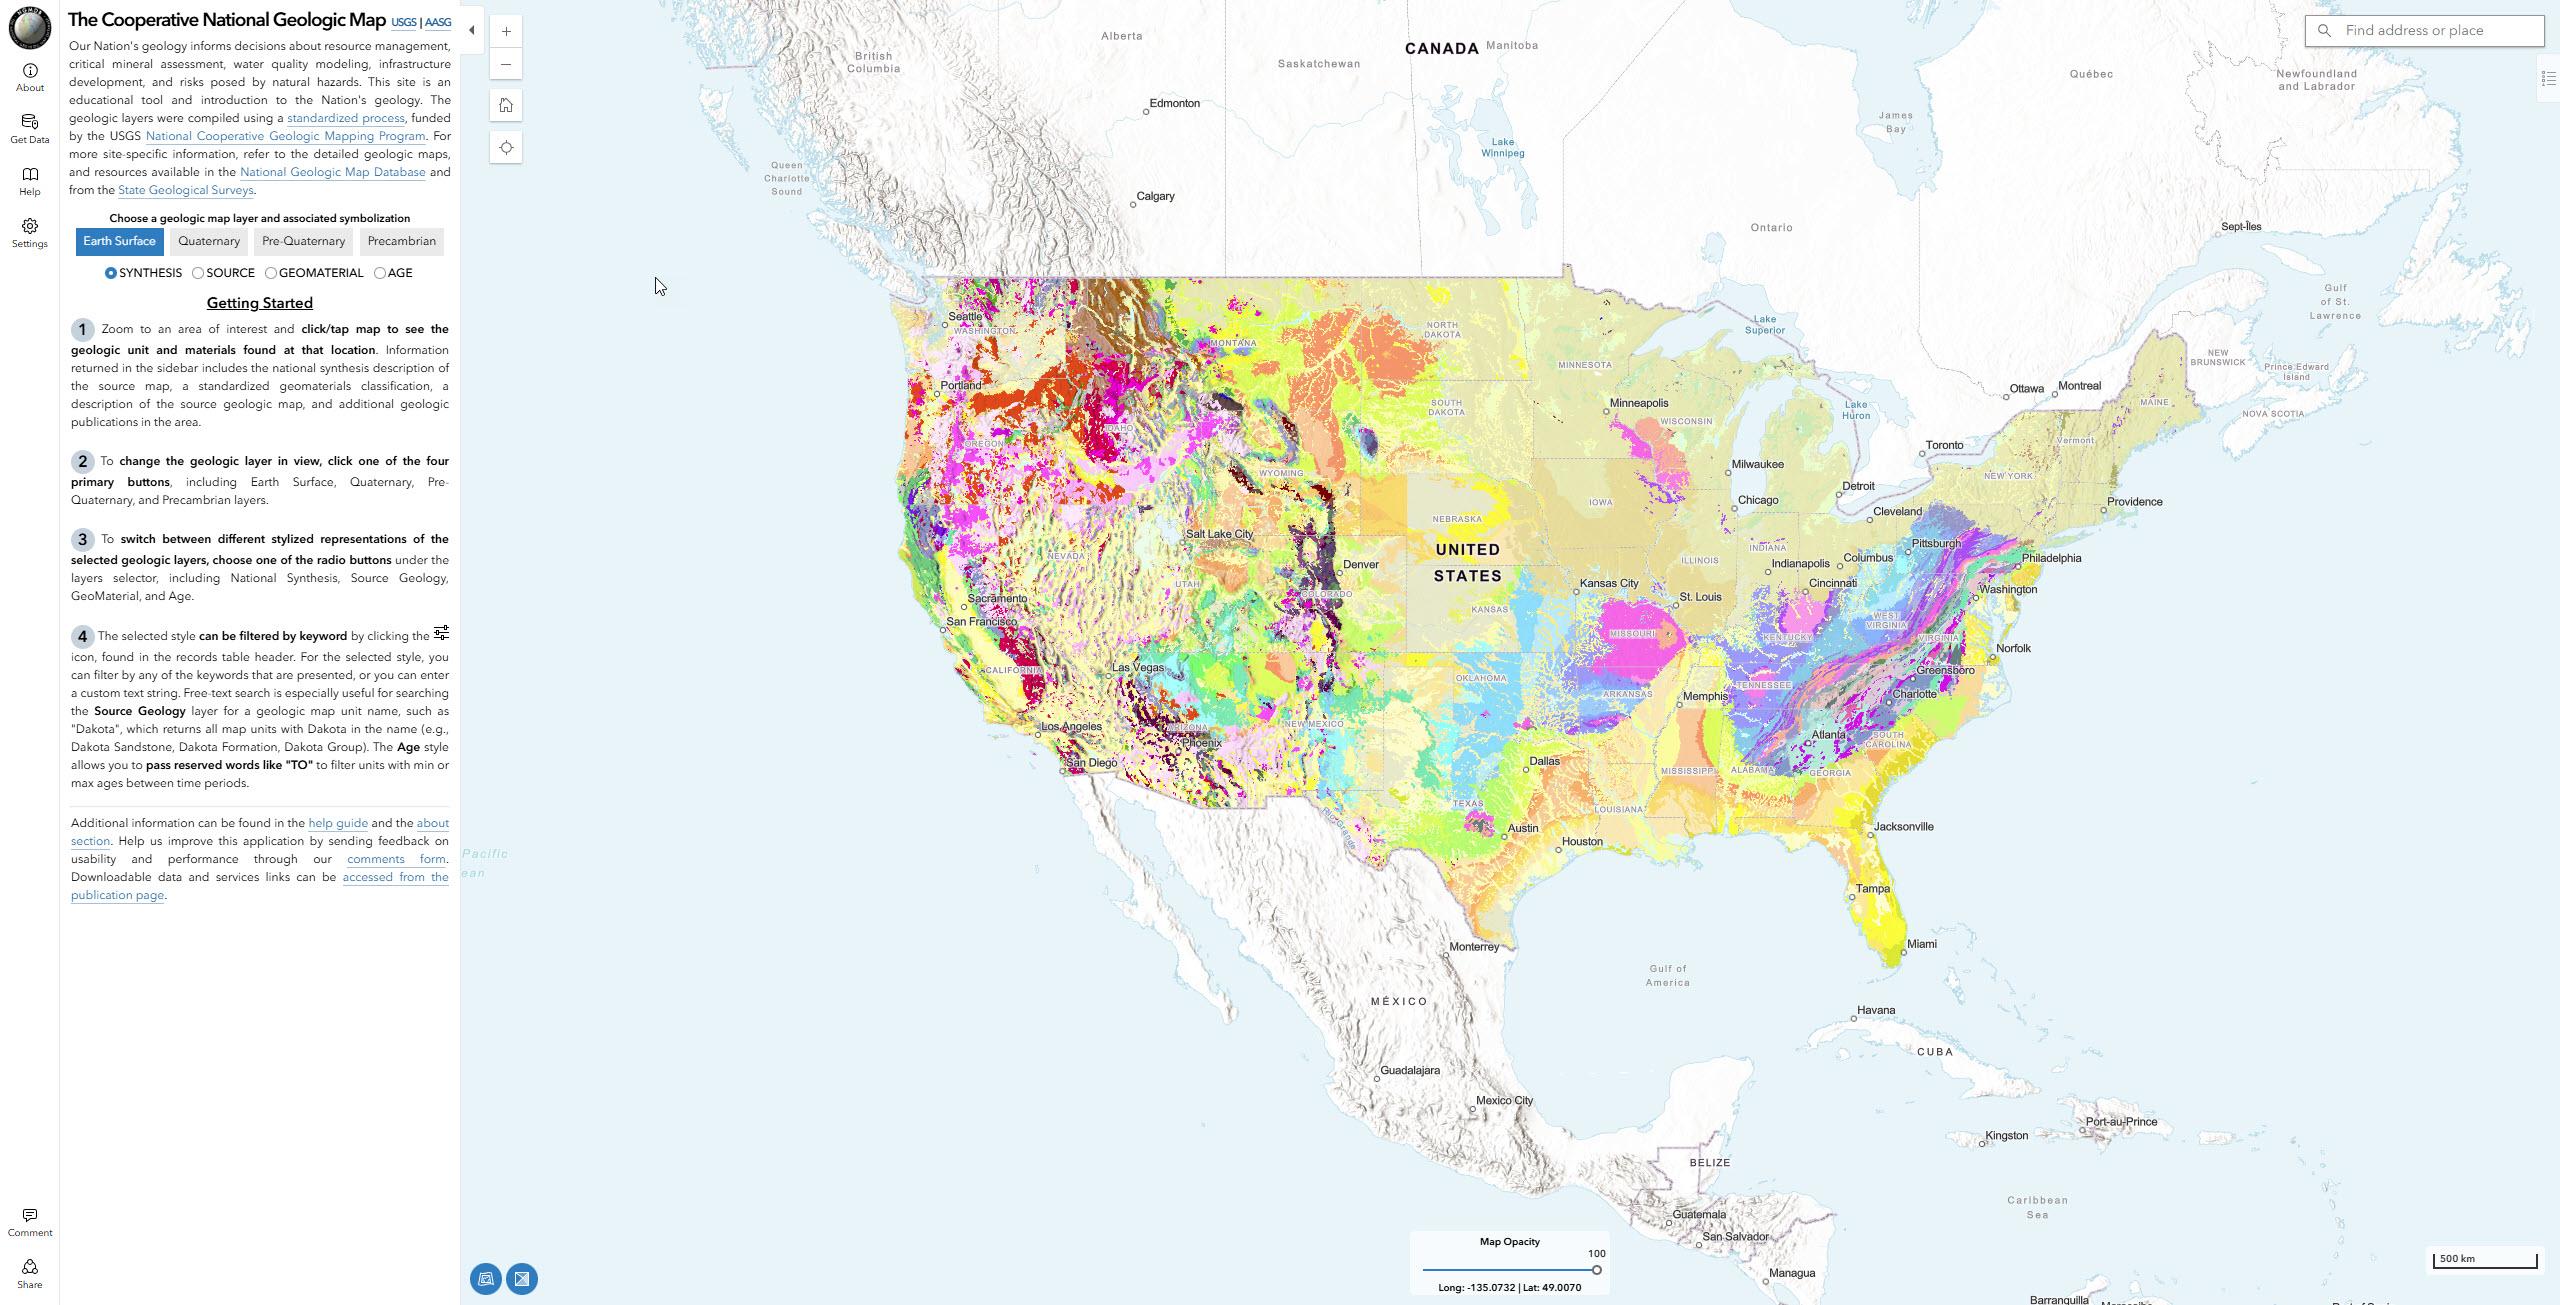
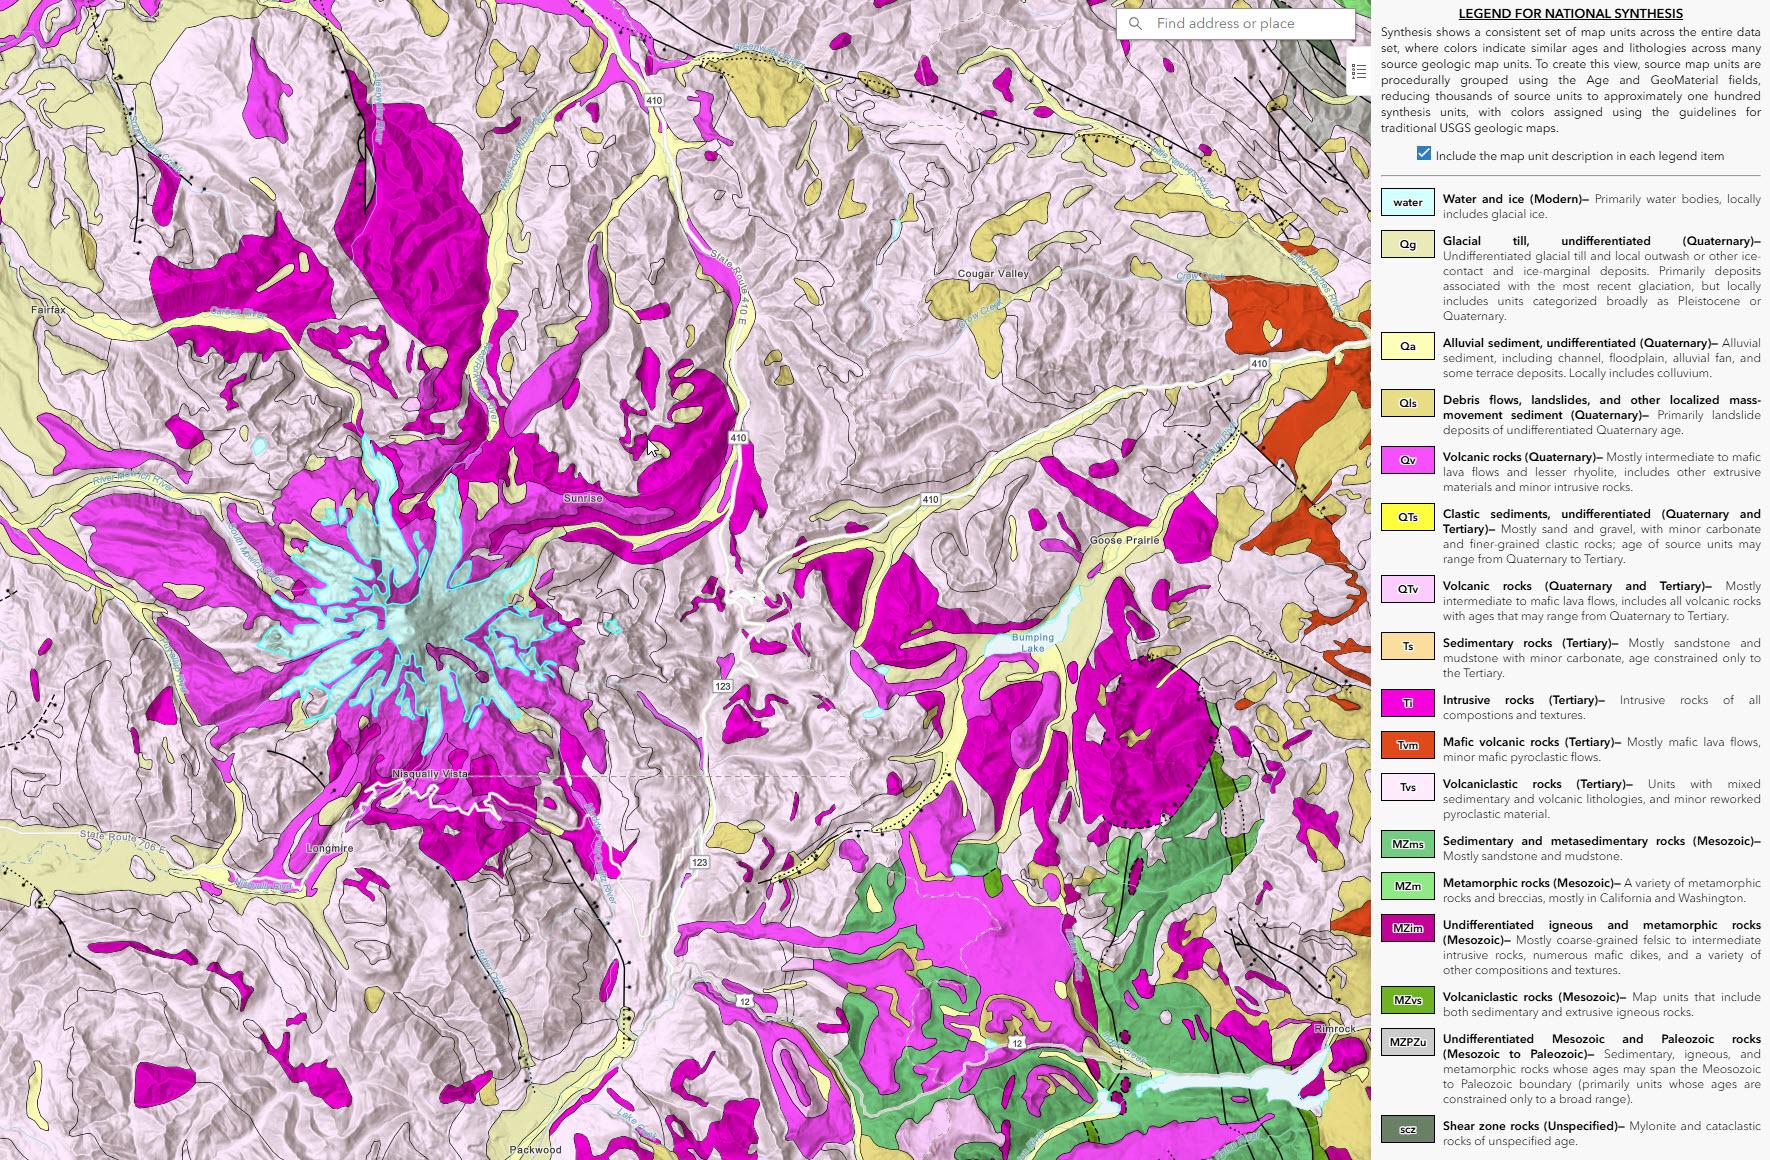
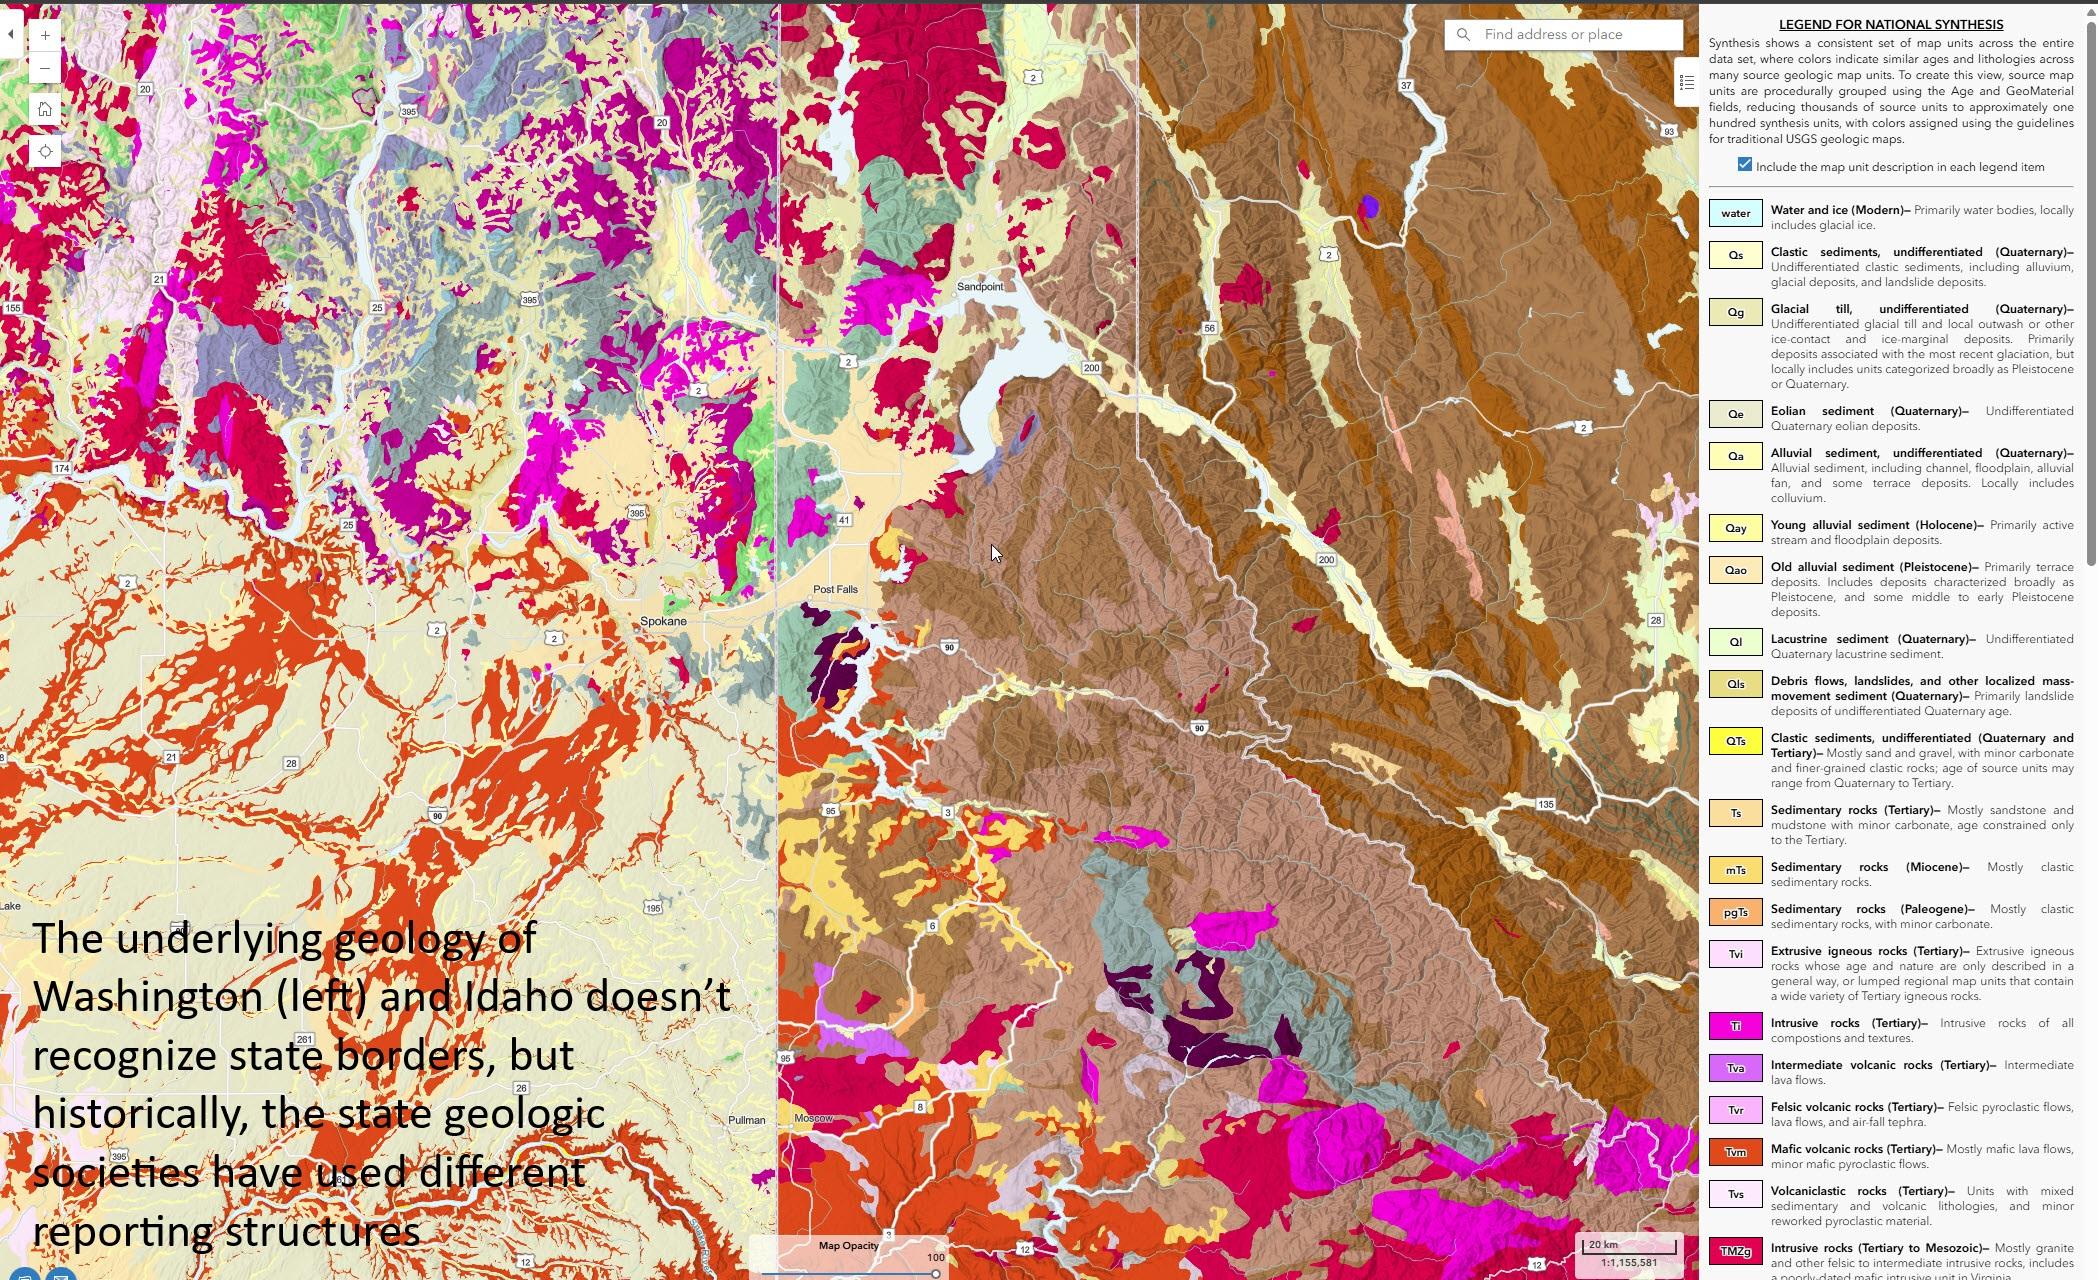
The Cooperative National Geologic Map is an interactive tool that builds on both cutting-edge technology and decades of mapping by geoscientists.
--
https://eos.org/articles/new-usgs-map-offers-an-interactive-look-at-the-rocks-beneath-our-feet <-- shared EOS-source technical article
--
https://ngmdb.usgs.gov/nationalgeology/#lat=37.0000&lng=-97.5000&zoom=5&theme=esurf&symbology=synthesis <-- shared @USGS resource
--
[recognising that I posted something similar earlier ~smile~]
#GIS #spatial #mapping #data #fedopendata #fedscience #geologicmap #geology #webmap #geologicdata #energy #minerals #mining #waterresources #hydrology #risk #hazard #landuse #infrastructure #planning #realestate #insurance #rock #sediment #mapunits #compilation #criticalminerals #economicgeology #nation #mobile #fieldwork #interactivewebtool #publicgood #online #state #federal #map #usecase #energy #resources #CooperativeNationalGeologicMap #USGS #mainland #CONUS
@USGS
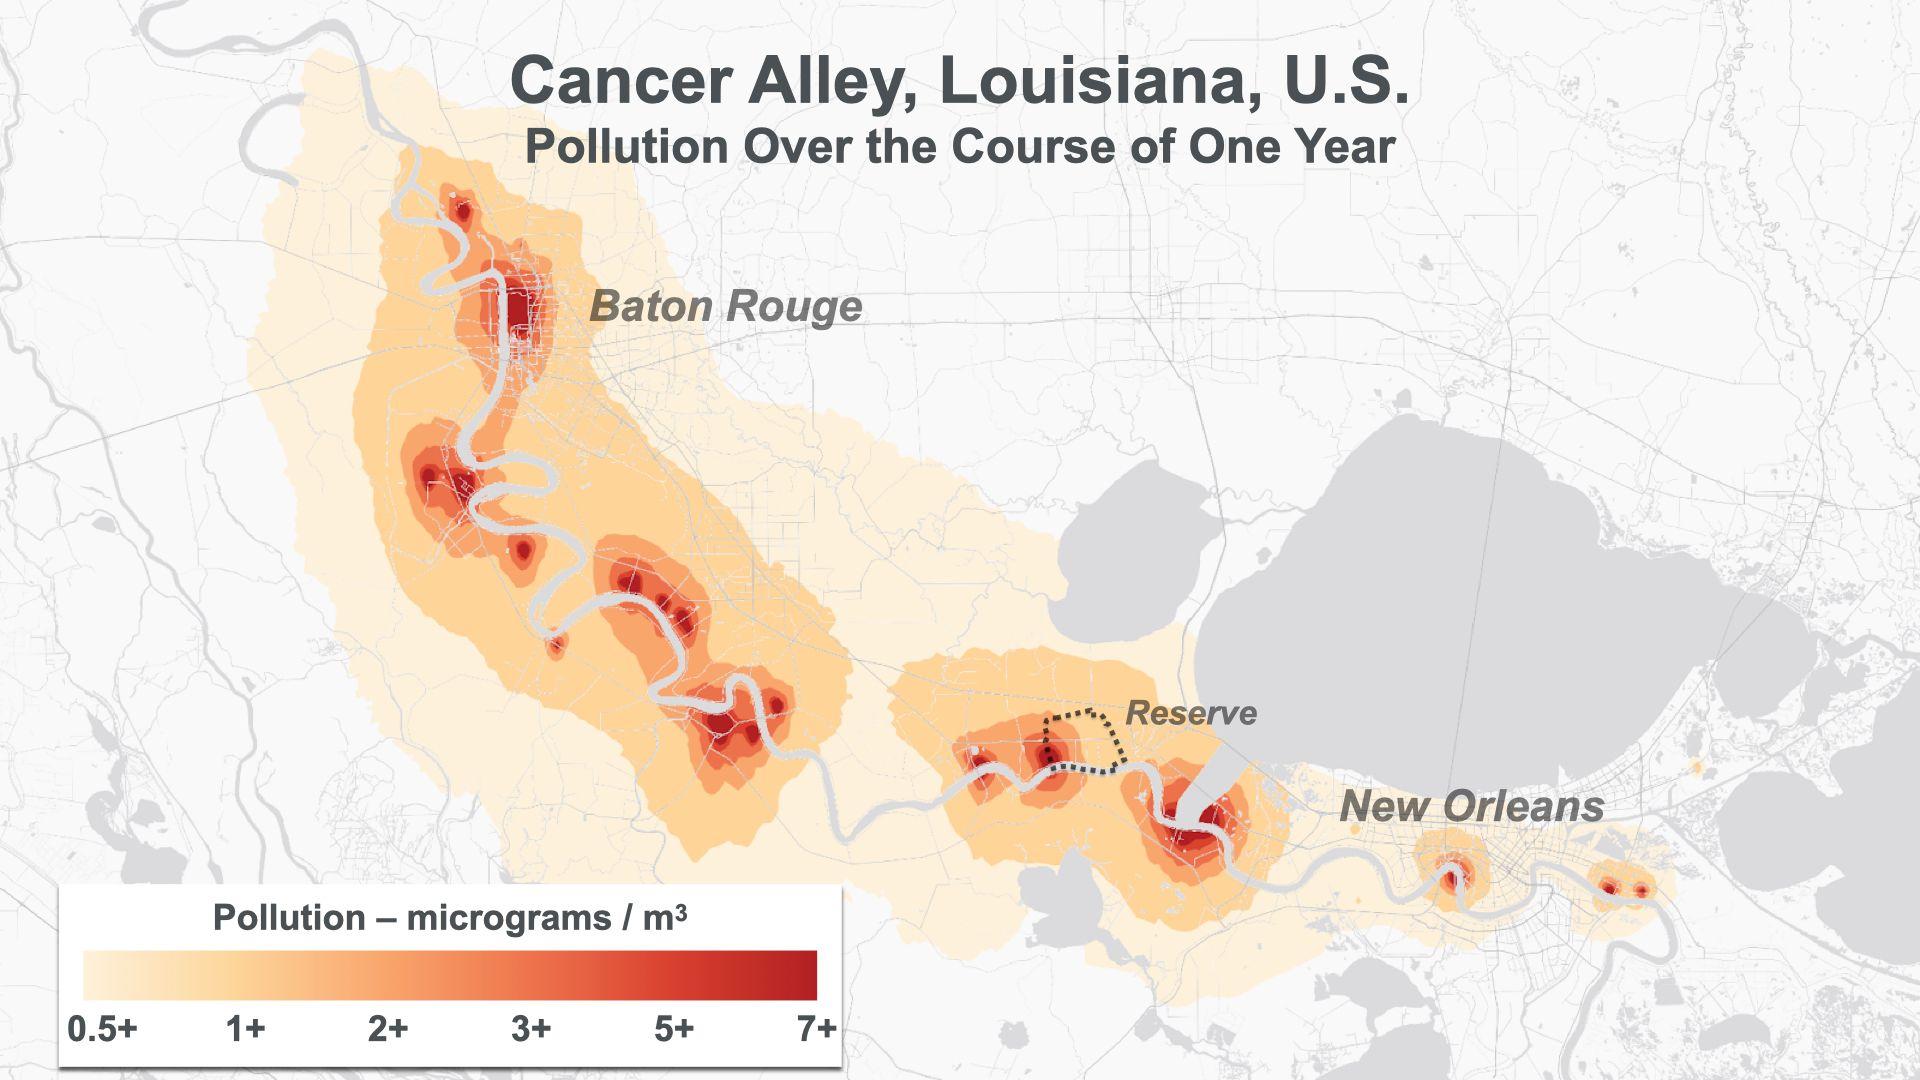
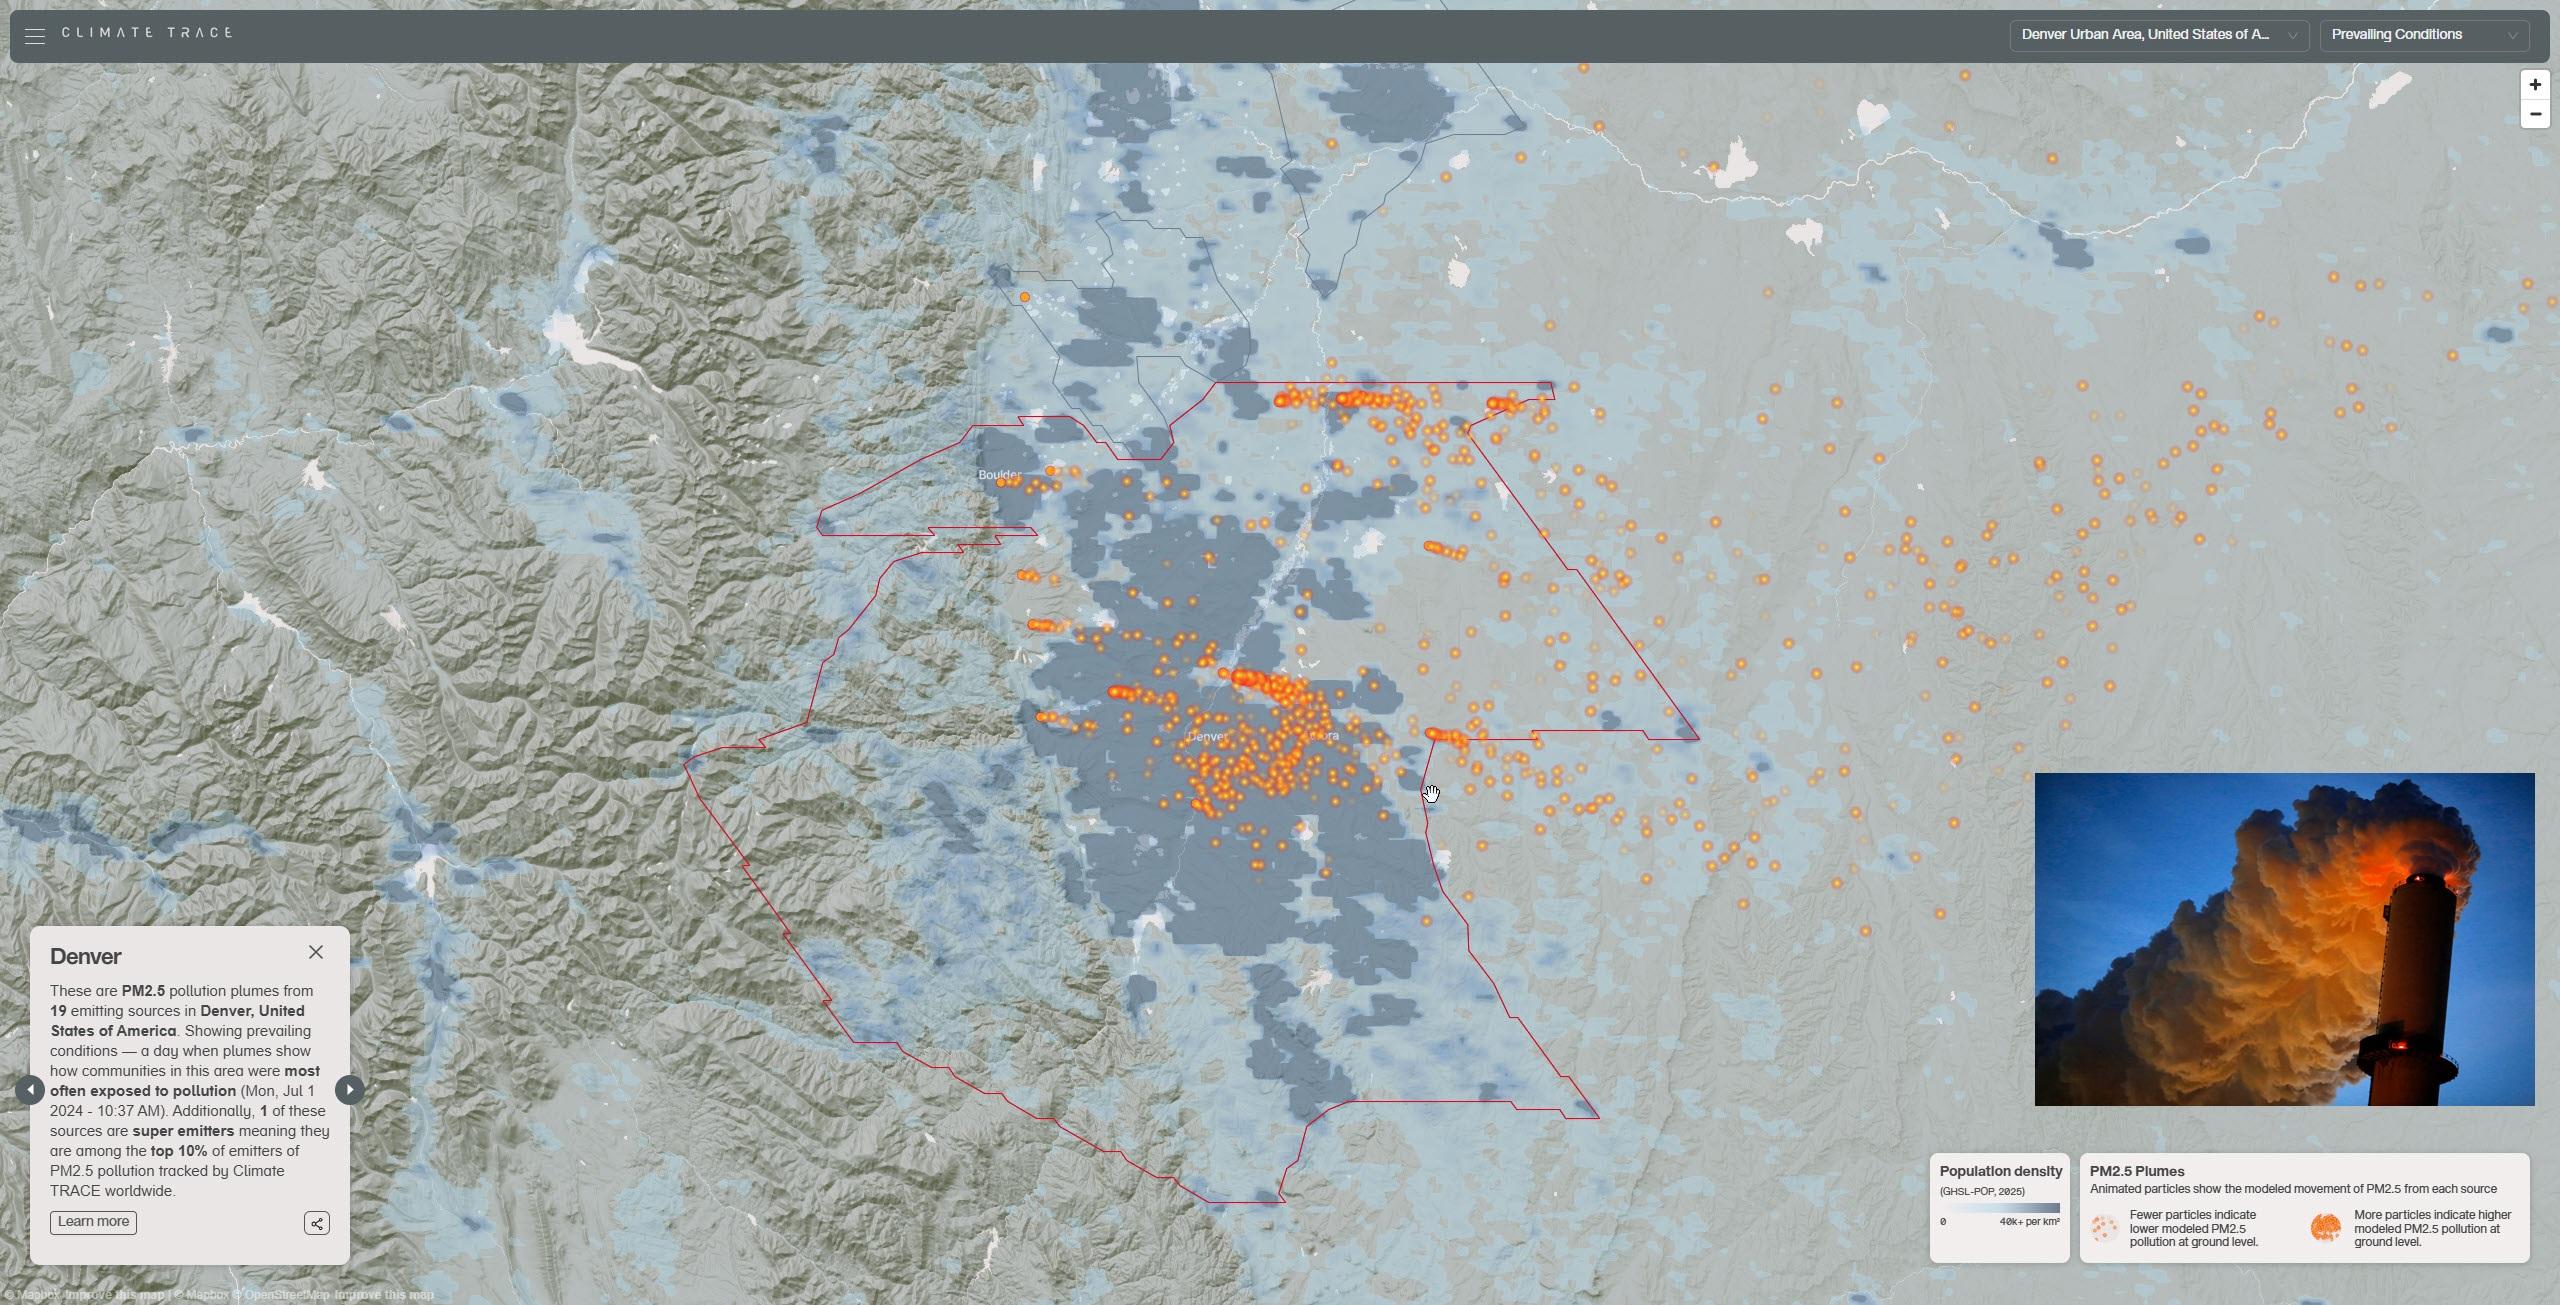
Mapped & Animated Air Pollution Around The Globe, Via a Web Map
--
https://climatetrace.org/air-pollution <-- shared web map
--
https://climatetrace.org/news/climate-trace-shows-how-and-where-facilities-that-contribute-to-the-climate-crisis-expose-1-6-billion-people-to-harmful-air-pollution <-- shared technical article / overview
--
#GIS #spatial #mapping #webmap #opendata #opensource #tool #webtool #pollution #airpollution #ClimateTRACE #publichealth #industrial #publicsafety #model #modeling #global
@earth Genome | @create Lab | @Carnegie Mellon |@Climate TRACE

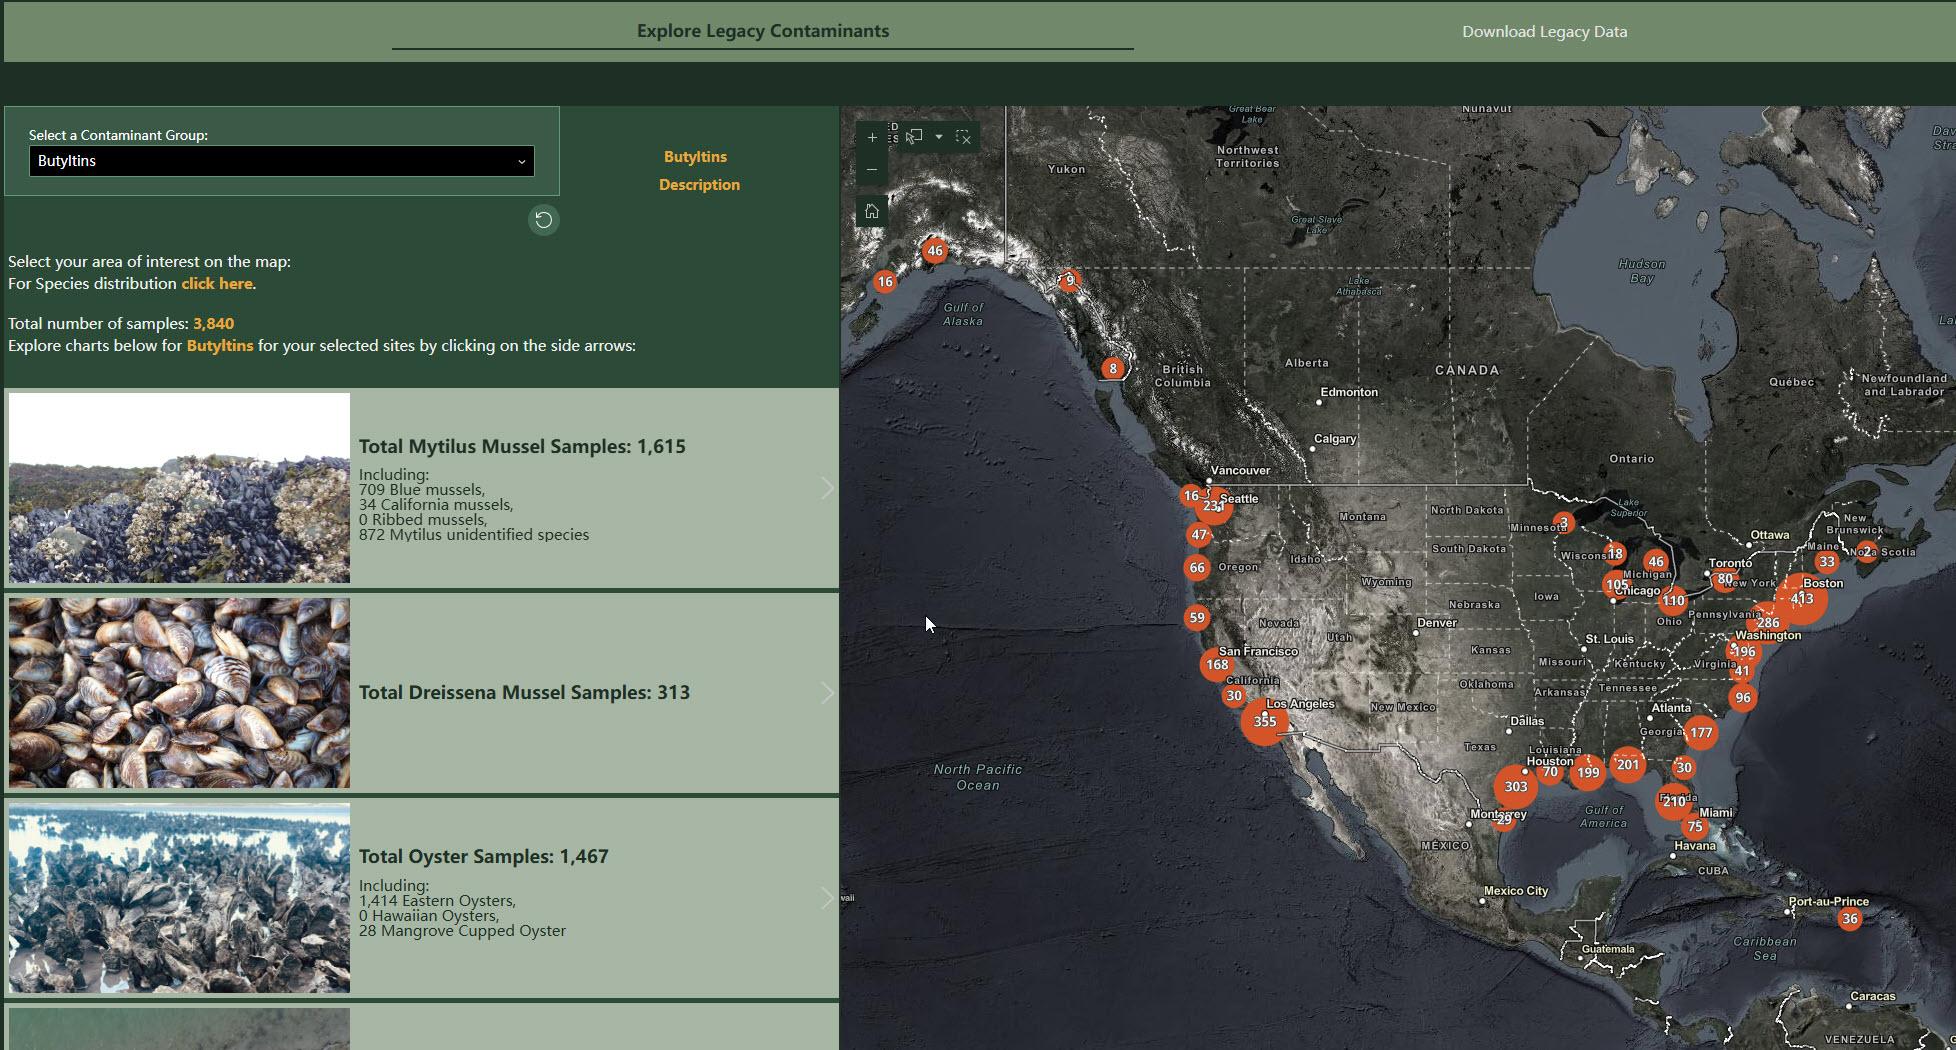
[NOAA] Coastal Pollution Data Explorer [#US]
--
https://coastalscience.noaa.gov/project/coastal-pollution-data-explorer/ <-- shared technical resource
--
H/T NOAA Centers for Coastal Ocean Science
#GIS #spatial #mapping #opendata #fedopendata #fedscience #shellfish #sediment #oyster #mussel #bivalve #pollution #contaminants #indicators #samples #coast #coastal #USA #interactive #dataportal #webmap #spatiotemporal #spatialanalysis #NCCOS #NOAA #toxicology #resources #marine #ocean #history #ecology #management #mitigation #CoastalPollutionDataExplorer
@NCCOS @NOAA


USGS Unveils New National Geologic Map
--
https://www.usgs.gov/news/national-news-release/usgs-unveils-new-national-geologic-map <-- shared technical article
--
https://ngmdb.usgs.gov/nationalgeology <-- access The #USGS Cooperative National Geologic Map
--
#GIS #spatial #mapping #data #fedopendata #fedscience #geologicmap #geology #webmap #geologicdata #energy #minerals #mining #waterresources #hydrology #CooperativeGeologicMappingProgram #risk #hazard #landuse #infrastructure #planning #realestate #insurance #rock #sediment #mapunits #compilation #criticalminerals #economicgeology #nation #mobile #fieldwork #interactivewebtool #publicgood #online #state #federal #map #usecase #energy #resources
@USGS


Okinawa DEM1A_webMap
GISCARTA’s New Interactive Web Map Dedicated To The Kiel Canal In Northern Germany
--
https://map.giscarta.com/viewer/9d883cca-93f0-4ad5-9b3d-7d87d6471204 <-- shared GISCARTA storymap
--
“🗺️ This detailed cartographic application offers a comprehensive spatial overview of the region’s maritime infrastructure, navigation environment, and key port connections between the North and Baltic Seas.
🎢 With step-by-step storytelling, analytical widgets, and rich attribute tables enhanced by photographs, the project provides a powerful tool for analyzing maritime logistics, infrastructure, and safety along the canal.
🌏 Explore the story, discover key features, and gain new insights into one of Europe’s most important waterways!...”
#GIS #spatial #mapping #webmap #storymap #GISCARTA #gis #dataviz #geo #map #geodata #geoprocessing #dashboards #geoanalytics #KielCanal #Kiel #accidents #monitoring #Germany #transportation #visualisation #usecase #logistics #shipping #cargo
#GISCARTA


US National Inventory Of Dams [NID] [open spatial data]
--
H/T Data Is Plural https://www.data-is-plural.com/
--
“The National Inventory of Dams [https://nid.sec.usace.army.mil/] [is a is a congressionally authorized] ‘document[ing] all known dams in the U.S. and its territories that meet certain criteria’ related [https://nid.sec.usace.army.mil/#/about-the-nid/mission] to the dam’s height, reservoir size, and likely impacts of its ‘failure or mis-operation.’..."
#GIS #spatial #mapping #fedscience #NationalInventoryofDams #NLDI #US #USA #dams #criteria #inventory #opendata #downloadable #risk #hazard #infrastructure #energy #HEP #waterresources #hydroelectric #webmap #USACE #operations #dataset #safety #inspection #uses
@USACE @FEMA @EPA


Drifter-Derived Climatology of Global Near-Surface Currents
--
http://alturl.com/hqckv <-- shared web map
--
https://www.aoml.noaa.gov/phod/gdp/mean_velocity.php <-- shared #NOAA dataset page
--
https://doi.org/10.1016/j.dsr.2017.04.009 <-- shared paper
--
“[Here is a] climatology near-surface currents and temperatures for the world, at monthly and one-quarter degree resolution, derived from satellite-tracked surface drifting buoy observations.
Animations of these currents are available [also at https://www.aoml.noaa.gov/phod/gdp/animations.php].
Maps of these currents in various regions can be seen on the Ocean Surface Currents web site [https://oceancurrents.rsmas.miami.edu/atlantic/img_gosv_seasonal.php]…”
#GIS #spatial #mapping #webmap #animation #currents #ocean #marine #global #temperature #buoys #model #modeling #spatialanalysis #spatiotemporal #measurement #OceanSurfaceCurrents #climatology #drifter #nearsurface
@NOAA
[USGS] Geologic Hydrogen Prospectivity Map Explorer
--
https://www.usgs.gov/index.php/tools/geologic-hydrogen-prospectivity-map-explorer <-- shared technical resource
--
https://doi.org/10.3133/pp1900 <-- shared USGS publication
--
https://certmapper.cr.usgs.gov/data/apps/hydrogen/ <-- link to web map
--
#GIS #spatial #mapping #remotesensing #geology #geophysics #geophysical #magnetics #gravity #gravimetric #hydrogen #geologichydrogen #fuel #fuelsource #prospecting #spatialanalysis #USA #prospectivity #webmap #CONUS #naturalhydrogen #hydrogengas #cleanfuels #fossilsfuels #climatechange #serpentinization #radiolysis #geologicprocesses #geostatistics
@USGS
![Map showing concentrations of geologic hydrogen greater than 0.5 mole percent as reported in drill-well gas samples throughout the conterminous United States (data from U.S. Geological Survey [2019], Zgonnik [2020], and Brennan and others [2021]). Symbol size correlates with concentration. Labeled concentrations are rounded to the nearest integer value.](https://files.mastodon.social/cache/media_attachments/files/113/879/732/173/567/830/original/9bc1a67bf93c6756.jpg)


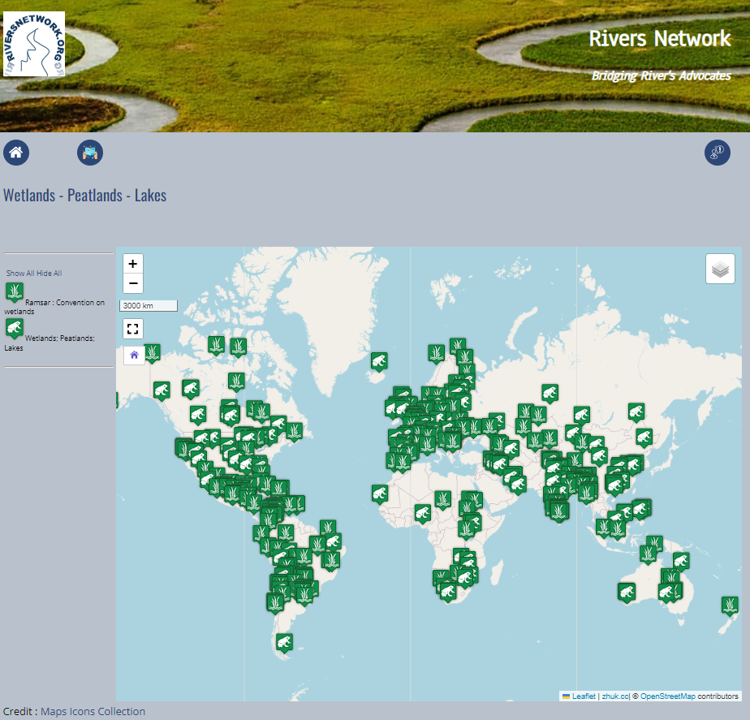
Explore riversnetwork.org....Plenty of river stories #Biodiversity #ecosystems #mangroves #wetlands #river #webmap and many others...

MarineTraffic – Web Map Of Global Shipping
--
https://www.marinetraffic.com/en/ais/home/shipid:381733/zoom:10 <-- shared live web map example
--
https://youtu.be/1QJknKiP9_Y?si=cjHHA-SmWXWs8bqQ <-- introductory video
--
[sharing of this website/service does not constitute an endorsement]
#GIS #spatial #mapping #webmap #spatialanalysis #global #MarineTraffic #shipping #telecommunications #research #vessel #movement #tracking #safety #navigation #incidents #critical #risk #hazard #mitigation #planning #marine #ocean #informationsystems #geostatistics #statistics #ports #pollution #routing #weather #metrology #piracy #protection #cargo #trade #internationaltrade


Millions In The US May Rely On Groundwater Contaminated With PFAS For Drinking Water Supplies
--
https://phys.org/news/2024-10-millions-groundwater-contaminated-pfas.html <-- shared technical article
--
https://doi.org/10.1126/science.ado6638 <-- shared paper
--
https://geonarrative.usgs.gov/pfasinusgroundwater/ <-- web map
--
#GIS #spatial #mapping #waterquality #waterresources #groundwater #contaminants #polyfluoroalkyl #PFA #PFAs #drinkingwater #watersecurity #model #modeling #contamination #planning #watermanagement #wells #public #private #webmap #probability #risk #hazard #USGS #assessment #state #regional #national #foreverchemicals #publichealth
@USGS
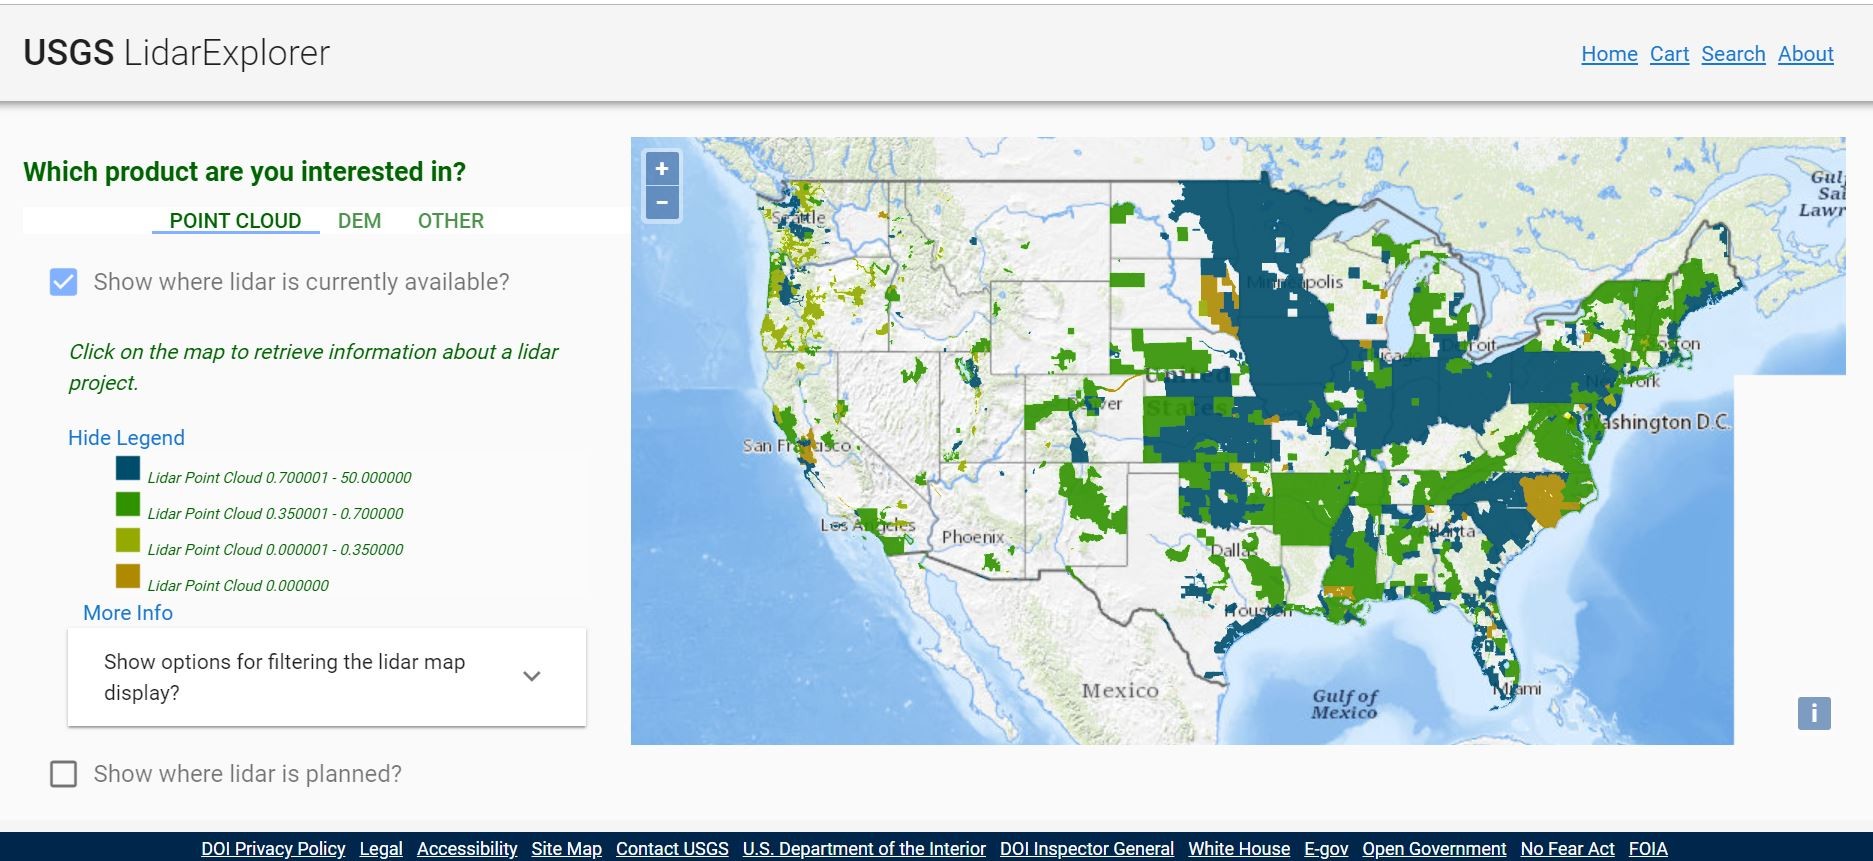
Lesson 10k1 - Using LiDARExplorer [USGS National Map training video]
--
https://youtu.be/36cfnwFWzj4?si=Ne5uk_jjbAjIaSGE <-- shared technical tutorial video
--
https://apps.nationalmap.gov/lidar-explorer/#/ <-- link to USGS app
--
https://www.usgs.gov/3d-elevation-program <-- USGS 3DEP home page
--
“This [USGS] National Map training video is an introduction to using the LidarExplorer application to easily access lidar data and derived products. In LidarExplorer, you can search for lidar projects, digital elevation models, and lidar point cloud files to meet your needs…”
#GIS #spatial #mapping #remotesensing #LiDAR #LidarExplorer #app #webmap #data #opendata #NationalMap #training #video #tutorial #selfhelp #onlinelearning #3dep #US #USA #DEM #elevation
@USGS


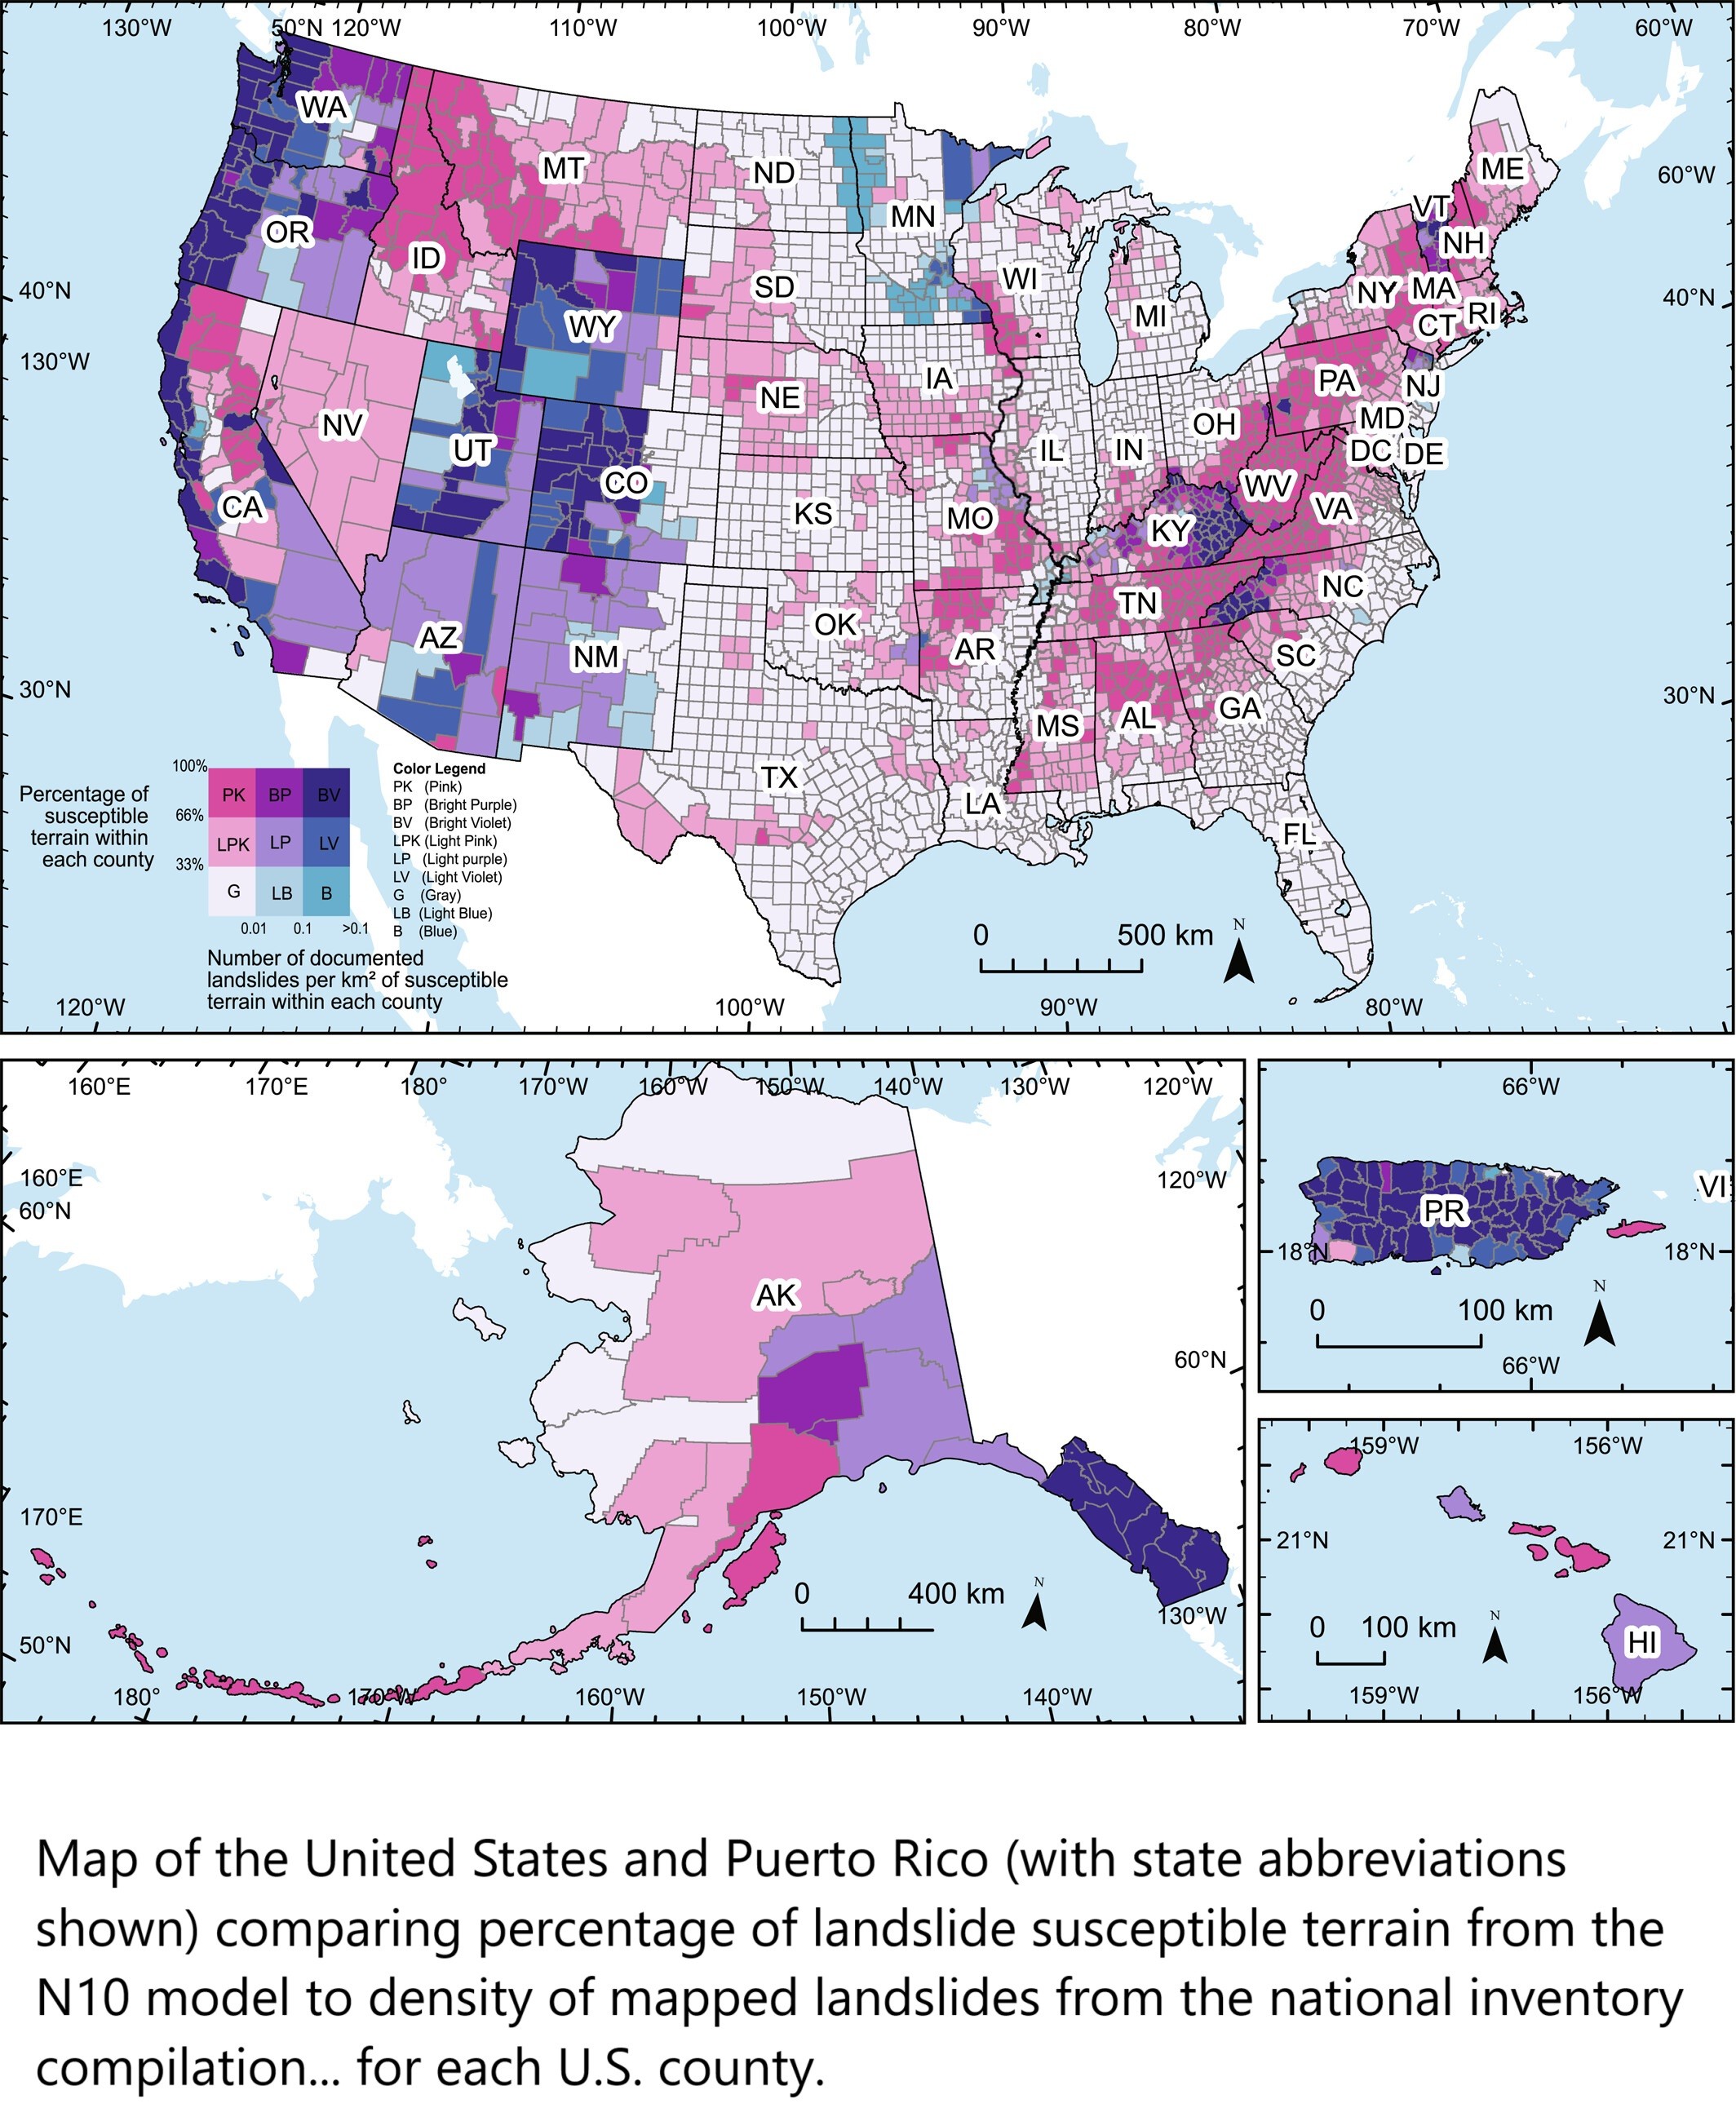
U.S. Landslide Inventory and Susceptibility Map [updated, USGS]
--
https://www.usgs.gov/tools/us-landslide-inventory-and-susceptibility-map <-- shared technical resource, with map and county-level metrics are available as structured data
--
http://alturl.com/ztxbs <-- shared link to USGS Landslide Susceptibility WebMap
--
https://www.usgs.gov/media/videos/parsimonious-landslide-susceptibility-modeling-continental-scales-a-new-high <-- shared video overview
--
https://doi.org/10.1029/2024AV001214 <-- shared paper
--
https://doi.org/10.5066/P13KAGU3 <-- shared 2024 USGS technical publication
--
#GIS #spatial #mapping #model #modeling #spatialanalysis #geology #engineeringgeology #massmovement #landslide #spatialanalysis #historicdata #webmap #USA #3dep #elevation #topography #geomorphometry #geomorphology #risk #hazard #riskreduction #suspectibility #opendata #remotesensing #database #compilation #inventory #terrain #landuse #planning
@USGS


Explore 500 Million Years Of Climate Data Across The Changing Globe With Climatearchive.Org
--
https://jeangoldinginstitute.blogs.bristol.ac.uk/2021/08/09/climatearchive-org-540-million-years-of-climate-history-at-your-fingertips/ <-- shared technical article
--
https://climatearchive.org/ <-- shared technical resource
--
#GIS #spatial #mapping #climate #opensource #climatehistory #openscience #download #webmap #global #visualisation #climatemodel #climatechange #society #ecosystems #environmentalscience #integration #model #modeling #interdisciplinary #climatedynamics #webapplication #paleoclimate #opendata
More Faults, More Resolution, More Features - The New Zealand Active Faults Database Webmap Gets A Major Upgrade
--
https://www.gns.cri.nz/news/more-faults-more-resolution-more-features-the-nz-active-faults-database-webmap-gets-a-major-upgrade/ <-- shared technical article
--
https://data.gns.cri.nz/af/ <-- New Zealand Active Faults home page/ webmap
--
#GIS #spatial #mapping #spatiotemporal #fault #faulting #NewZealand #earthquake #geology #risk #hazard #groundsurface #webmap #record #database #surfacetrace #geomorphology #geomorphmetry #NZAFD #infrastructure #earthquakeengineering #engineeringgeology #planning #urbanplanning #regulations #geotechnical #landuse #permits #slip #frequency #riskassessment #GNS
@gnsscience


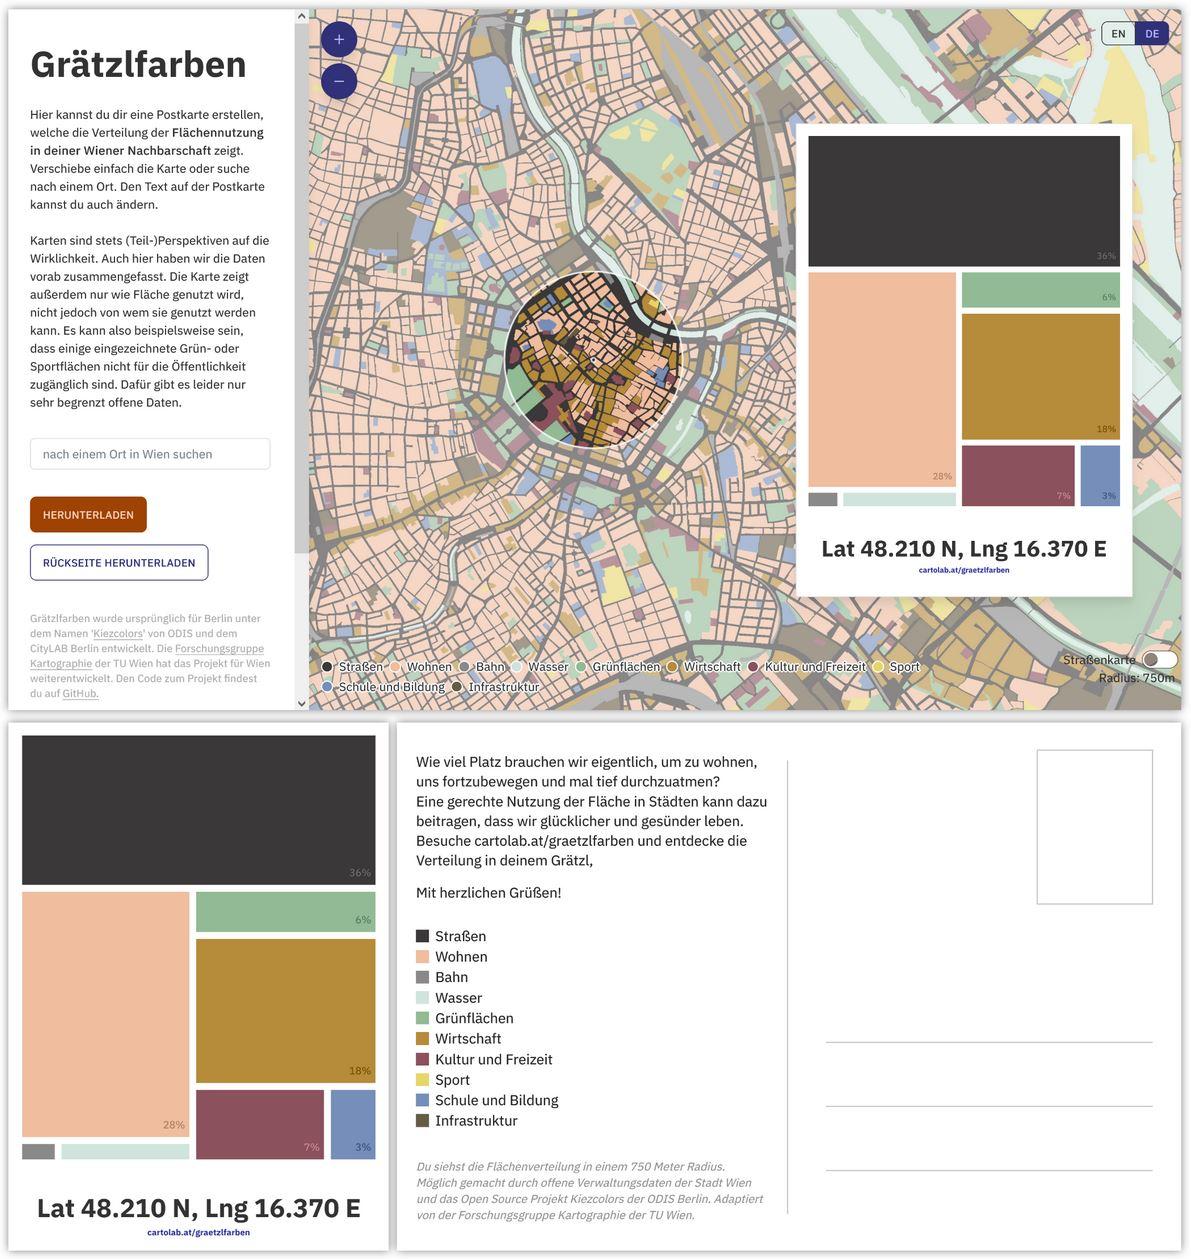
Neue #opendata Anwendung: Grätzlfarben 🌈🗺️ – erkunde die Flächennutzung in Wien mit einer interaktiven Webmap und erstelle deine eigene Postkarte. Zeigt die Vielfalt in den Wiener Grätzln auf einen Blick #ogdwien #SmartCity #Webmap #Innovation https://www.data.gv.at/katalog/application/eca79b74-4672-4b62-b3c0-e0f937b44605
Latest Earthquakes Interactive [Global] Map – USGS
--
https://earthquake.usgs.gov/earthquakes/map/ <-- shared global map
--
https://www.usgs.gov/programs/earthquake-hazards <-- USGS earthquake hazards home page
--
“The USGS monitors and reports on earthquakes, assesses earthquake impacts and hazards, and conducts targeted research on the causes and effects of earthquakes. [They] undertake these activities as part of the larger National Earthquake Hazards Reduction Program (NEHRP)…”
The interactive map shows “Latest earthquakes map and list (past 24 hours, M2.5+) from the ANSS (Advanced National Seismic System)…”
#GIS #spatial #mapping #earthquakes #webmap #onlinemap #mapportal #earthquake #earthquakehazard #risk #hazard #catalogue #impacts #cause #effect #geology #engineeringgeology #global #USGS #NEHRP #ANSS #seismicity #mitigation
@USGS


