The weekend’s Bonus Drop is a bit tardy as what it is based on took a bit longer to get going and was also interrupted by IRL happenings.
Also: just as I had figured out how to get paid subs moved to WordPress, WordPress does a **** move and turns AI-evil, so stay tuned for a move to Buttondown over the coming weeks.
Type your email…
Subscribe
Self-Hosted Observable Framework Sites
I wanted to put together a larger, and more structured introduction to Observable Framework to further demonstrate the potential this new offering has to disrupt “dashboarding” and “reporting”. Before digging into the tech bit, I just want to take a second to note how bold a move this is by the Observable team. I don’t know how many folks are going to opt for the new xyx.observable.cloud hosted reports, which has to be one of the goals for Framework. Making the core technology hosting platform-agnostic is, IMO, a risk. The fact that I was able to throw together a repeatable self-hosted Docker+Caddy setup means that literally anyone else can too. And, at work, our initial Framework-based “data quality dashboard” is working great in our Kubernetes cluster. Truth-be-told, you can just plop the contents of dist/ into any web context, and it’ll “just work”. That being said, lots of folks do not want to be in the hosting business, and if Observable supports custom domains and fully private/authenticated dashboards/reports, then I think they can absolutely succeed in this endeavor.
With that out of the way, let’s dig into the new project example.
Yet-Another CISA KEV Report
I’m still not able to expose some of our internal data to show off the internal site I built, so I turned to the public source data I use fairly often in these Drops, the CISA Known Exploited Vulnerabilities (KEV) catalog. I’m also using Project Discovery’s cvemap utility, which has a lovely -kev CLI parameter, which lets us get CVE metadata for all KEV entries.
The code is on codeberg, and the report is at:
What’s different about this setup?
- The project is far more structured and makes use of JavaScript components along with some separation of concerns (more on that in a bit)
- There are multiple data loaders in curl/Bash and R; and, no remote data sources are used
- 99% of the data wrangling (outside the data loaders) is using DuckDB and SQL (I worry about the folks who like to wrangle data in JavaScript-proper)
- This is a multipage dashboard/report (dashport?)
- There are some interactive elements in it beyond just chart tooltips
- The Justfile has been updated to be more generic and support deploying to Observable’s project cloud
Digging In
Rather than include a massive number of code blocks, I’ll be using some snippets and linking to the sources on Codeberg.
Here’s the overall structure (unnecessary directories/files hidden):
├── Dockerfile├── dist│ ├── 01-vendor.html│ ├── 02-vendor-vulns.html│ ├── 03-cves.html│ ├── 04-cwes.html│ └── index.html├── docs│ ├── 01-vendor.md│ ├── 02-vendor-vulns.md│ ├── 03-cves.md│ ├── 04-cwes.md│ ├── components│ │ ├── kev-utils.js│ │ ├── queries.js│ │ └── utils.js│ ├── data│ │ ├── cisa-kev.json.sh│ │ ├── kev-cve.json.R│ │ └── kev-cwe.json.R│ ├── index.md│ └── styles.css├── justfile└── observablehq.config.ts
Let’s start with the use of “components”.
In queries.js, we have the SQL queries used primarily by kev-utils.js. I find that it makes the code making the queries far more readable, and this also lets me have a library of standard queries I can mix and match. This is one example:
// SQL query to get the days since last kev releaseexport const daysSinceLastKevReleaseQuery = `FROM kevSELECT DATEDIFF('day', MAX(dateAdded), NOW()::TIMESTAMP::DATE) AS daysSince`; Notice that we take full example of the upgraded SQL experience afforded us by DuckDB.
You’ll see that utils.js is pretty sparse since these are not KEV-specific function. One shortcut function I like to keep around for WASM DuckDB ops is:
export function resultsetToArray(data) { return data.map((d) => d.toJSON());} This turns the query results — which end up being an array of Proxy object — to something we can use in other contexts. These are used in kev-utils.js like this:
import { prevalenceByVendorQuery, daysSinceLastKevReleaseQuery, dateDeltasQuery, kevVendorDeetsQuery, pubVSKevQuery,} from "./queries.js";…const db = await DuckDBClient.of({ kev: internalKEV, cveMeta: kevCVEMeta,});…export const prevalenceByVendor = resultsetToArray( await db.query(prevalenceByVendorQuery),); That’s very clean and succinct (at least I think it is).
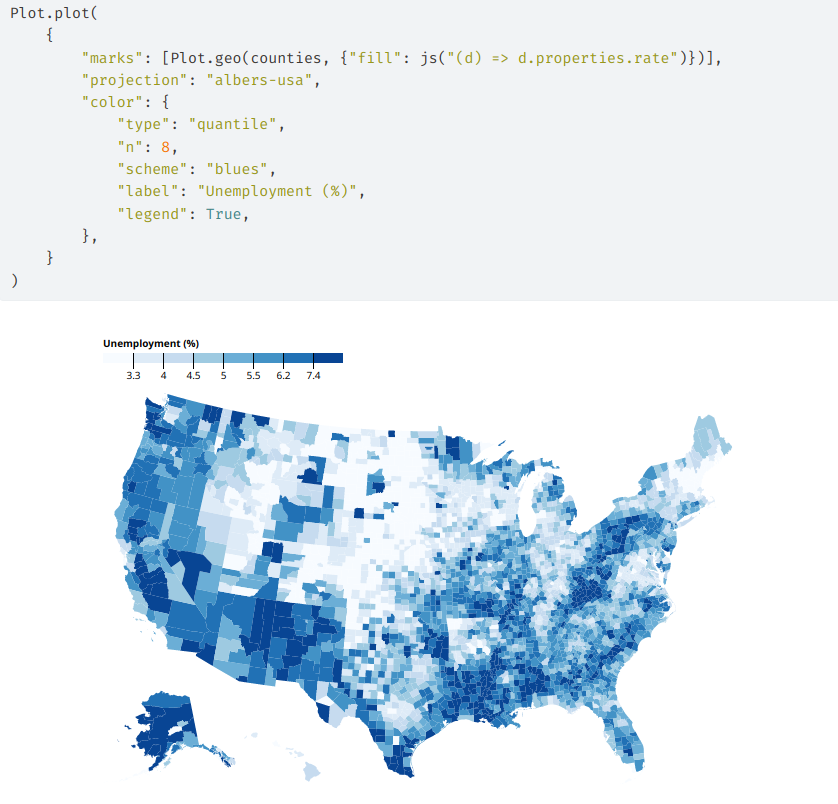
We also move all calls to Plot into here, like this one, so we can just call it from the Markdown documents.
Data Loaders
Before we get to the markdown bit, I’ll just note that there are three data loaders.
cisa-kev.json.sh just grabs the KEV JSONkev-cve.json.R reads from some JSON I use in other places. It’s generated by calls to the aforementioned cvemap. I have it yank out various fields and turn timestamps into dates.kev-cwe.json.R uses the same files as kev-cve.json.R, but is 100% focused on the CWEs (common weakness info). It also needs to do some cleanup because data in my industry is awful.
Observable Markdown Pages
While I could do page organization in the observablehq.config.ts file, Framework groks directory structure, and I can use a trick from Quarto, and use numeric prefixes to get the order I want (hence the 01-, 02-, etc.).
By placing all the Plot code into components, the <div>s are much cleaner:
<div class="grid grid-cols-2"> <div class="card"> ${resize((width) => PlotKEVEntriesCumulativeSum(width))} </div> <div class="card"> ${resize((width) => PlotKEVEntriesDeltaDays(width))} </div></div> Note the passing of width downstream.
One of the pages lets the human reviewing the dashport (that term most certainly will not stick) pick a vendor and then displays different details. We first make an select menu:
const selectedVendor = view( Inputs.select(vendors, { value: vendors[0], label: "Select Vendor:" }),); Then we use it:
<div class="grid grid-cols-1"><div class="card">${resize((width) => PlotVendorDetails(selectedVendor, width))}</div></div><div class="grid grid-cols-1"><div class="card" style="padding-left:5%; padding-right: 5%">${deets(selectedVendor)}</div></div> It’s great having the familiar Observable reactivity to lean on.
Jusfile Enough
There are some notable changes to the Justfile.
First, we use variables up top, which makes the Justfile more easily made generic, and also means we don’t have to change multiple values in multiple places:
exposed_port := "9101"container_port := "80"image_version := "0.2.0"image_name := "kev-report"container_name := "kev-report-fwrk"
We also added a section to enable deployment to Observable cloud:
# deploy to Observable@deploy: npm run deploy -- --message "cron"
Automation
I have a cron job that runs twice daily (KEV has two update windows per M-F) and runs just build-image daemon. It takes less than 15 seconds to build a new report + image and start the new container.
FIN
I was forced to use GoDaddy for the hrbrmstr.app domain (ages ago), but they have a great CLI, so adding a new dashport to this dashporting server is something that can be all done via “infrastructure as code”.
Hopefully, this helps folks ponder their own idioms for working with Framework (though, this approach applies to lots of similar idioms).
Remember, you can follow and interact with the full text of The Daily Drop’s free posts on Mastodon via @dailydrop.hrbrmstr.dev@dailydrop.hrbrmstr.dev ☮️
https://dailydrop.hrbrmstr.dev/2024/03/04/bonus-drop-43-2024-03-05-adding-a-bit-more-structure-to-self-hosted-framework/
#html #javascript #markdown #observableFramework #observablePlot