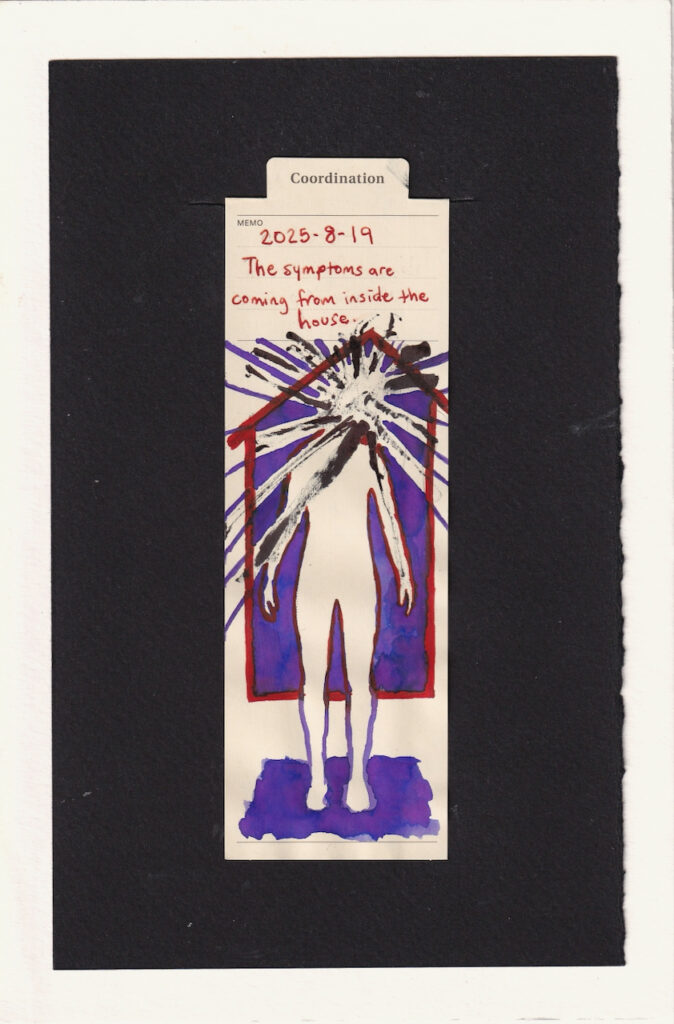
2025_8_19 The symptoms are coming from inside the house.
We are in a severe Covid surge right now thanks to Late Summer/Back To School, and it will also probably worsen significantly again for the winter holidays. Because your risk for Long Covid increases with each infection, here are some steps you can take during the acute infection to lower your risk of Long Covid, or lower the severity of how a reinfection will worsen your existing Long Covid.
This is not medical advice, this is a summary of things I have read from various studies, journalists, and newsletters, and what I try to prioritize for myself. I send this to loved ones who accept my offer for it when they or someone they know gets infected, and I figured I should make it more broadly accessible.
Ways to Lower Your Risk of Long Covid &
Lower The Severity of A Reinfection’s Worsening Your Long Covid
Medicines, Vitamins, and Supplements
- Increase Vitamin D ASAP and sustain it for at least a month. It’s a reserve vitamin so you can’t cram it all in 2 days, and should not. It is possible to have too much Vitamins A & D, so please be mindful of dosing.
- Increase Iron ASAP and sustain it, similarly to above.
- Zinc, like Vitamin D, is key to our immune system’s functioning & signaling. Zinc can help boost underactive immune features, calm overactive immune features, and reduce inflammation. Additionally, studies have found Zinc levels are significantly reduced during Covid infection, and reduced in relationship to severity of infection, so it makes sense to combat this.
- Metformin has LOTS of evidence of decreasing Long Covid risk with typically few side effects, but it does require a prescription.
If you’re asking your doctor, I recommend supplying a trusted source: This 2023 Quadruple Blind RCT Study is a Gold Standard for clinical trials. If relevant, additionally add 2025 Study found added efficacy in Fat Folks, 2023 BMJ Blog, 2025 RECOVER Blog. - H1 Antihistamines have preliminary research to support them decreasing LC risk and SIGNIFICANT research supporting them as treatments in Covid-19 infections, plus ways to lower your Covid infection risk overall. All H1 antihistamines have shown in vitro benefits, however the ones I’ve seen most studied in humans are cetirizine/zyrtec, ebastine, azelastine, and loratadine. Most trials in humans used modern antihistamines, which I agree with. I do not generally suggest any first generation antihistamines including Dramamine, Benadryl, NyQuil, or their generic versions unless you have a medical reason for choosing them & their adverse anticholinergic effects. H1 antihistamines are typically available without a prescription in the US.
- A recent study from Germany found a Nasal H1 Antihistamine, Azelastine Nasal Spray reduced covid infections by 69% (nice). Some people have critiqued this study’s methods, so more research is needed. However, if you need to be on a nasal H1 antihistamine anyways, a 2x a day dose of Azelastine, or 3x a day dose of German Azelastine is extrapolated to be beneficial from a long covid precaution perspective, similarly to other H1 medications above. This is typically available without a prescription.
- H2 Antihistamines, especially Famotidine/Pepcid, reduce both symptom severity and viral load, leading to an earlier resolution of infection. These are available without a prescription in the US, and typically inexpensive.
- Paxlovid is less effective at decreasing Long Covid risk in the acute phase, but does have other benefits, even if started late. It is additionally showing progress as part of a combination therapy. Stock up on mints and cough drops though.
- Magnesium, Vitamin C and other immune-boosters can be very beneficial IF you are not autoimmune/don’t have other relevant considerations.
- If you are on trans masculine HRT or similar medications please continue. Men & NB people with similar levels of hormones have lower risk and sometimes lower symptom burden than women & NB folks with similar hormone levels. We aren’t sure why yet.
Other OTC items which might help lower the viral load or otherwise make the acute infection less impactful:
- A mouth wash containing PVP-I [povidone-iodine] or CPC [cetylpyridinium chloride]. This can be used multiple times a day.
- Green tea (ECGC)
- Hibiscus tea (ACE2), though PEANUT ALLERGIES SKIP THIS ONE, including folks sensitive due to aflatoxins by Mast Cell Activation Syndrome — peanuts and hibiscus are often intercropped.
- Antioxidants and omega-3 fatty acids (including flaxseed oil, fish oil) help remove oxidative stress, which is helpful in both acute Covid (infection and replication causes OS) and in multiple forms of Long Covid. I’ve read . Antioxidants are vitamins A, C, E, Selenium (Se), and Zinc (Zn). Vitamin A is possible to overdo, so please be mindful of dosing.
- Nicotine, surprisingly to some, though Indigenous People of Turtle Island know Traditional Tobacco as Medicine. If you are already using nicotine (including patches), you can keep it up during the acute phase to hopefully lower some risk. It is also being investigated as a Long Covid treatment, I had a positive experience with my experiment.
Transmission Precautions (how to protect people you live with, etc):
COVID is most often transmitted via the air, not droplets like we thought early in the pandemic. As such:
- Fresh air will be your easiest and most effective option, assuming climate safety. Even a slightly open window will be MUCH better than closed windows.
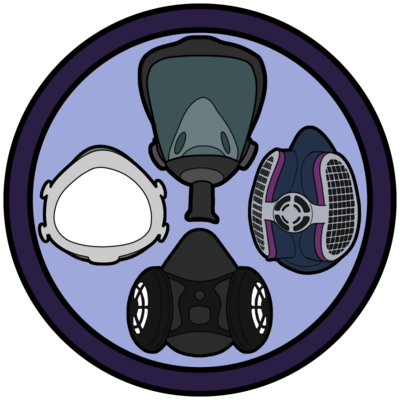
- Masks are extremely effective, especially when both parties wear them. Respirators (aka a mask with a safety rating such as N95, KN95, KF94, P2, FFP2, DS) are best, but anything is better than none. Try to get as good of a seal as you can/minimize air leaks.
- Air filtering with HEPA filters is great if you have access and funds. Try to make sure the filter(s) you use are sufficient for the square footage of the space. Earlier variants had a filter goal of 6 air changes per hour (ACH), but anything is better than nothing, especially when combined with opened windows, etc. If the filters are insufficient for the square footage/meterage or ACH, place them for largest impact: for example close to the sick person, in areas with poor ventilation, or areas of high social contact.
- If HEPA filters are too expensive or unavailable, try to make a Corsi-Rosenthal Box (a DIY air filter alternative using MERV13+ filters and a box fan, free directions abound online). Same strategies as above.
- Last home air filter precaution: most climate control systems have a filter, and if that filter is already or can easily be changed to a MERV13+ filter, that will be an additional help.
- If you must run errands/go to work/etc, please prioritize one of the rated respirators above. Try to do curbside or other distanced, outdoor pickup options where available.
- There are nasal precaution options including the aforementioned OTC H1 Antihistamine Azelastine and Profi Spray (which is highly effective, but their science was measured with nasal swab application, not spray).
- It doesn’t take a lot: We have stopped the acute spread of Covid in our home two times (that we know of!–the real number is probably much higher) by using only a couple strategically placed HEPAs and window cracking.
- When in doubt, think Swiss Cheese:
Please Take Care:
https://www.illmarks.com/symptoms-are-coming-long-covid-prevention-tips/
#allergy #art #backToSchool #backtoschool #besafe #bodyHorror #bodyMapping #cdc #chronicIllness #covid #covidIsAirborne #covidIsNotOver #covid19 #covid19 #covidcompetent #CovidIsntOver #environmental #health #healthcare #longCovid #longcovid #maskUp #maskup #mastCell #mastCellActivationSyndrome #mastCellDisease #mastcell #mcas #medArt #medart #medblog #medicalArt #MillionsMissing #pwme #SaltingTheVibes #SaltingTheVibes #sarsCov2 #sars2 #sciArt #SciArt #WearAMask #WearARespirator


![Chart: Est. U.S. Variant Proportions by Common Name
Sources: CDC, Cov-Lineages, NYITCOM, others
[ beadsland on Ko-fi ]
Reskin of CDC's Variants Nowcast, and any significant variants in GISAID not broken out by CDC.
Five bar-style tree-charts, for fortnights through 5/25–6/7. Legend of last fortnight, organized by subheadings of color-grouped families and convergent clusters. Percentages overlay each color key, reflecting share as of most recent tree-chart.
WHO-Vaccine-Target JN.1 accounts for over three fifths. JN.1.11 for over two fifths.
For 5/11–5/24, packed bubble charts fill single-variant tiles, reflecting GISAID detail not shown by CDC's Nowcast.
Legend:
JN.1.11 + FLiRT31 [blues]:
38% - LP.8.1.1 / NY† & other FDA-Vaccine-Target LP.8.1
⅛% - XEK
Omicron-2 BA.2 [purple]:
37% - Nimbus NB.1.8.1 / PQ
LF.7 + NTD-meets-RBD [browns]:
8% - XFG.2† & other XFG
7% - XFC
JN.1 + FLiRT-LF-7 [reds]:
5% - LF.7.7.2, LF.7.9.1 / PY† & other LF.7.9
1% - LF.7.7.1 / PV & other LF.7
JN.1.11 [greens]:
⅜% - KP.3 & XEQ
1% - PA.1, MC.10.1, MC.1 & other KP.3.1.1 / MC
Other [greys]:
½% - LB.1.3.1 / NL
2% - XEC.4 & other XEC
0% - Other (not specified)
_____
Nimbus NB.1.8.1 / PQ is a scion of left-field Razor-Blade-Throat XDV.
Razor-Blade-Throat XDV was a child of Winter 2024's WHO-Vaccine-Target JN.1 and left-field recombinant XDE.
XDE was a child of left-field Hyperion grandkid FL.13.4 and left-field Hippogryph scion GW.5.1.
[Some footnotes omitted, due to too many recombinants.]](https://files.mastodon.social/cache/media_attachments/files/114/669/819/381/858/175/original/f4da997bf48ff821.jpg)