#RayleighWave

💧🌏 Greg CocksGregCocks@techhub.social
2024-11-05

A Seismic Precursor 15 Min Before The Giant Eruption Of Hunga Tonga-Hunga Ha'apai Volcano On 15 January 2022
--
doi.org/10.1029/2024GL111144 <-- shared paper
--
"KEY POINTS:
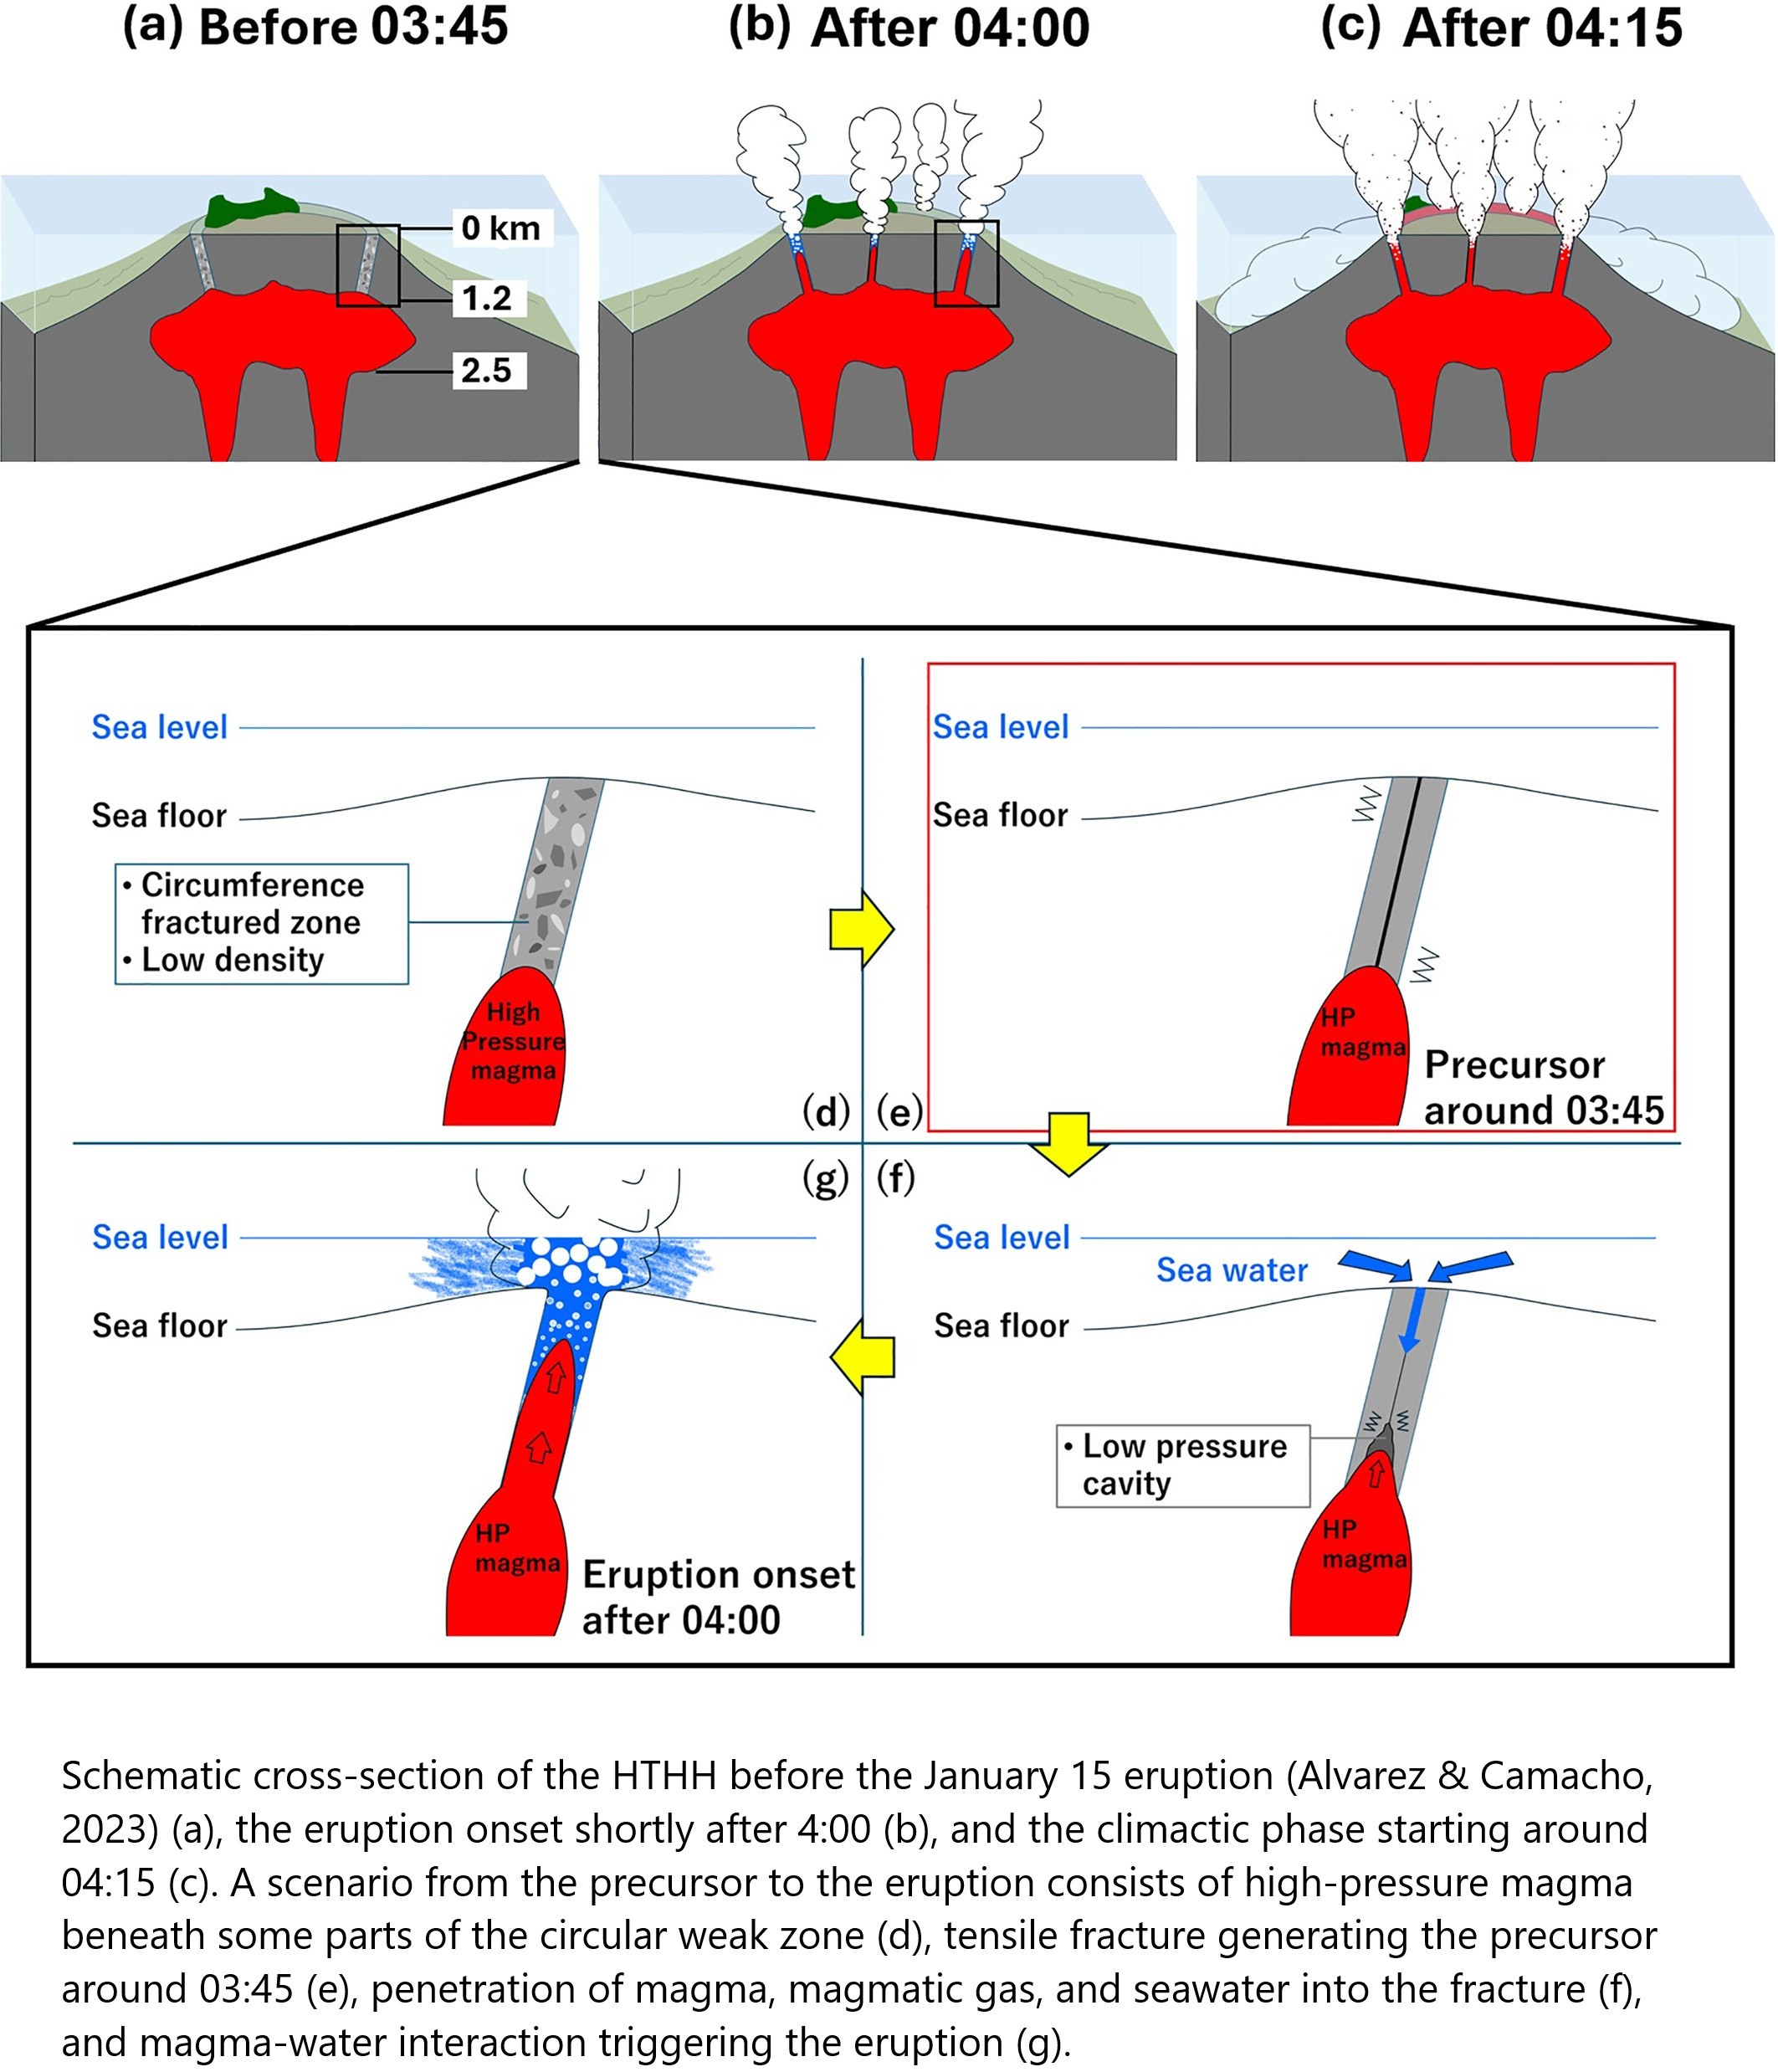
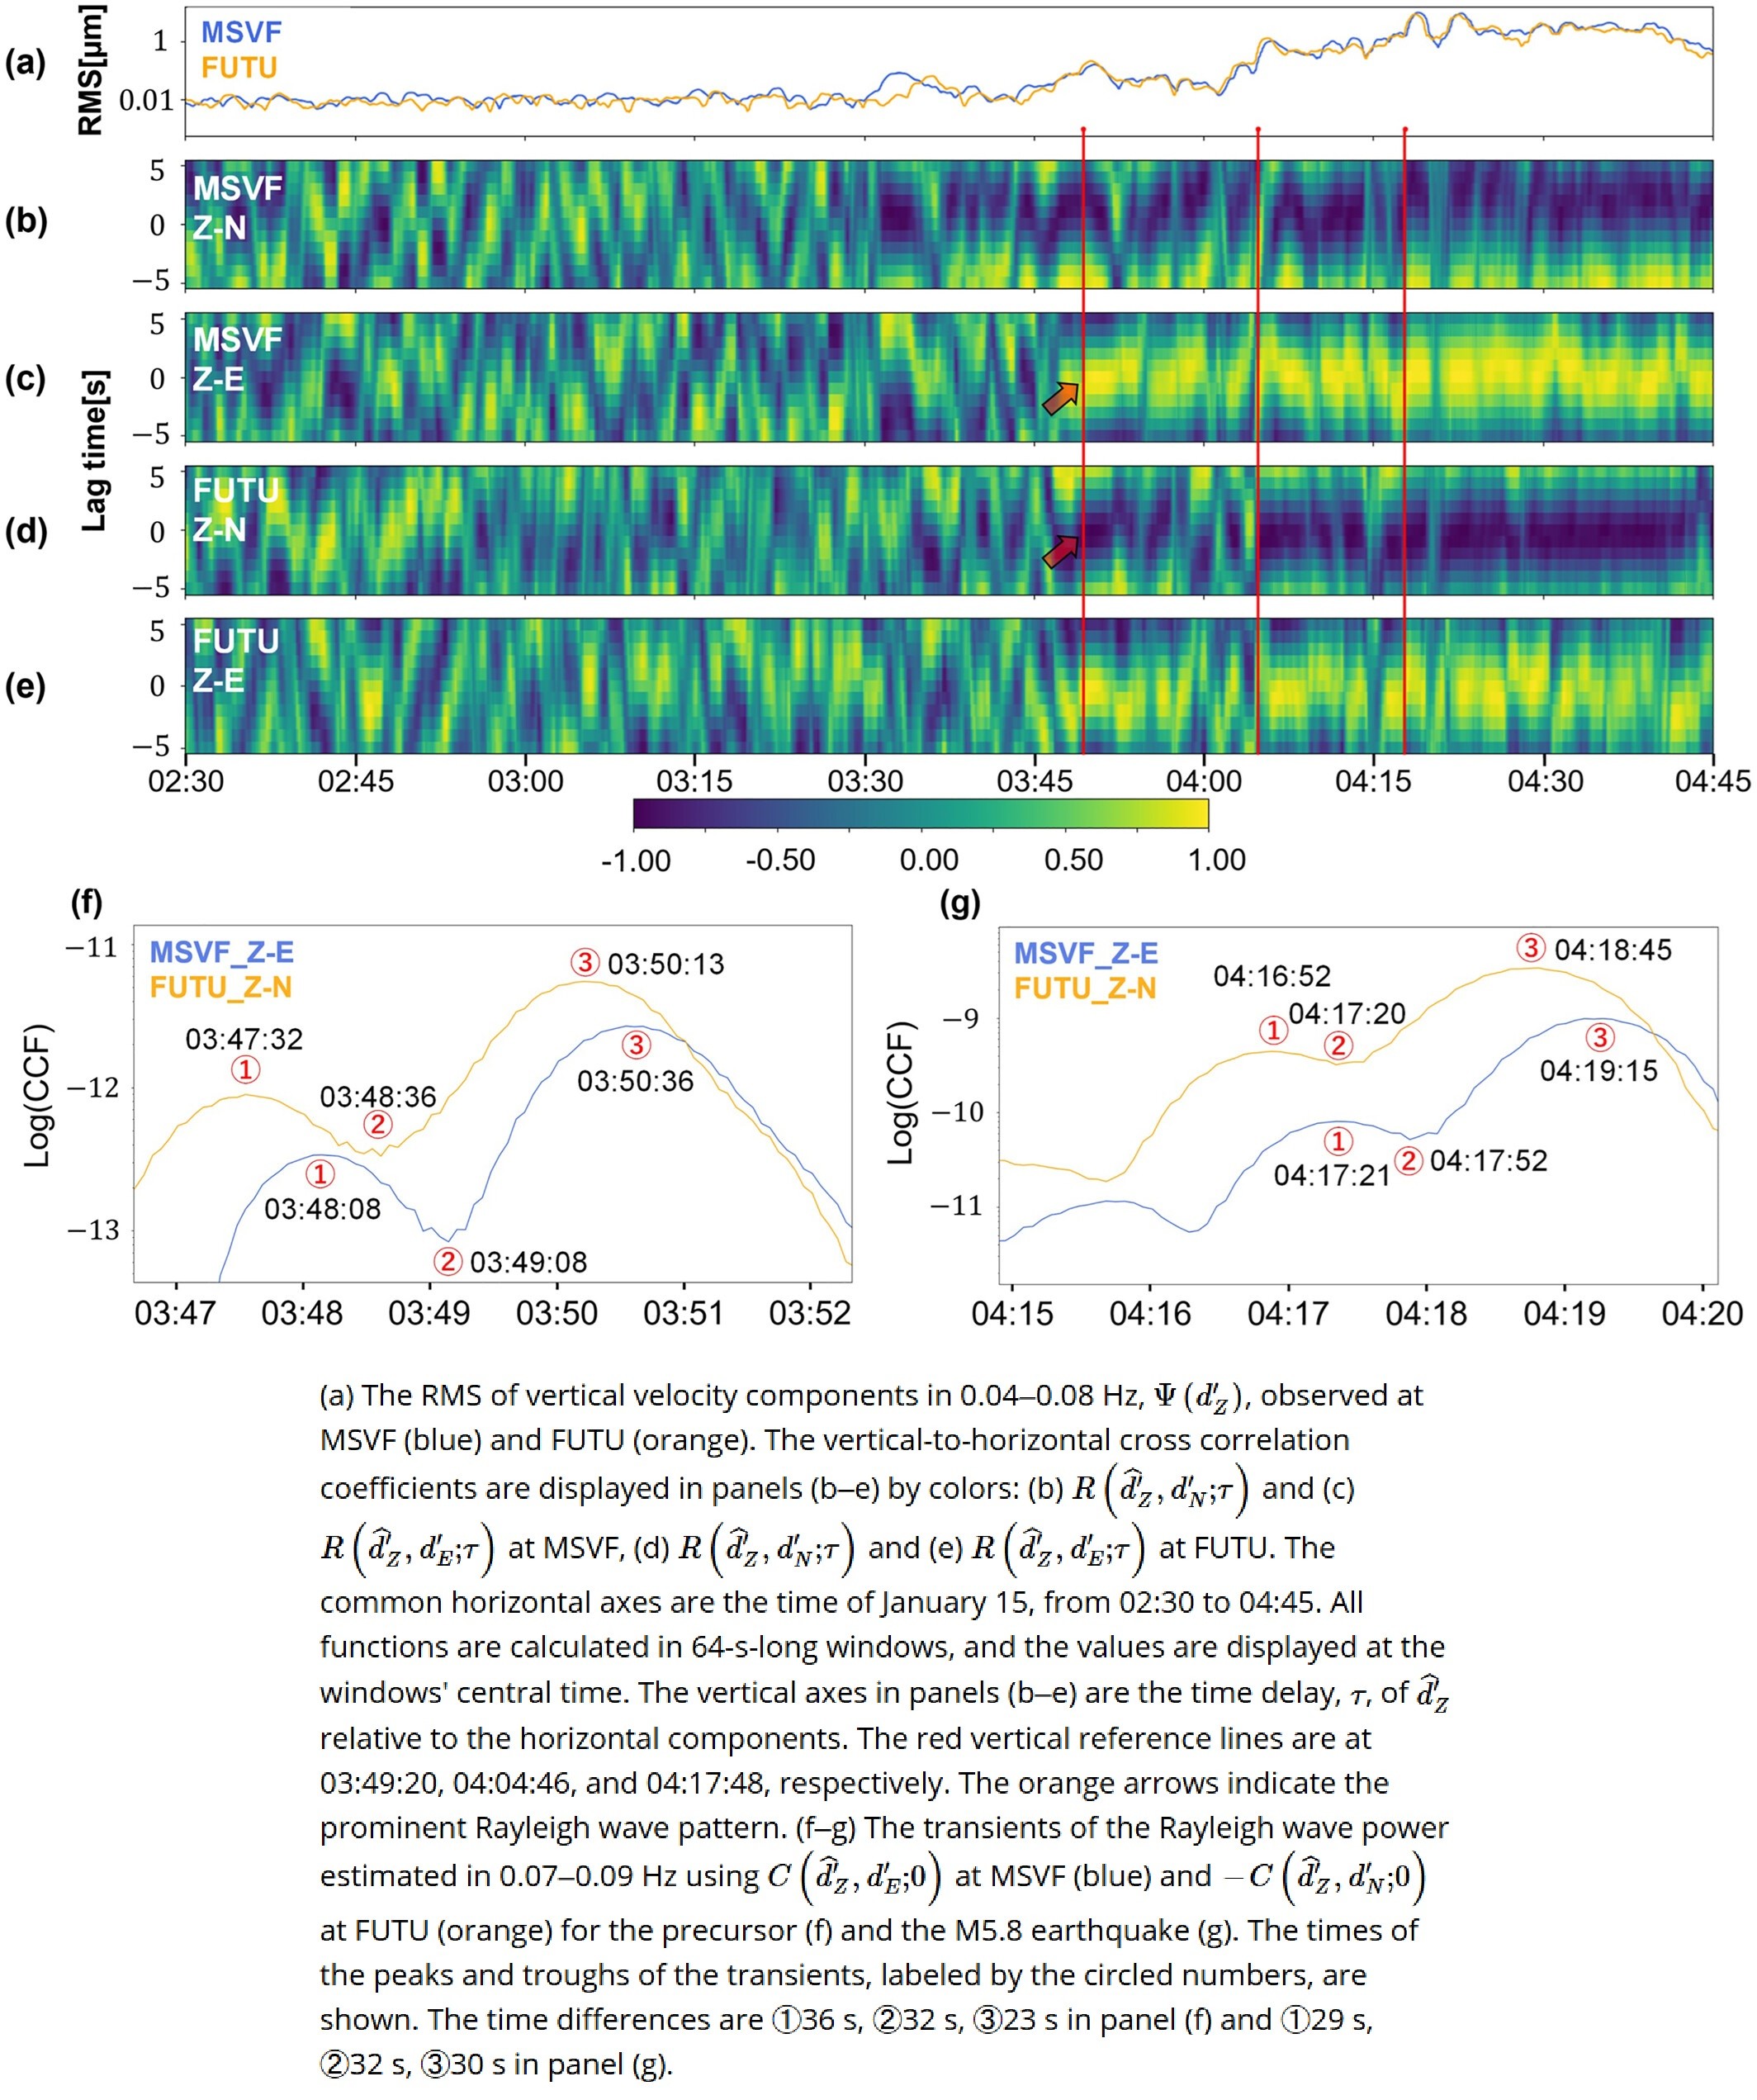
• The volcano generated Rayleigh waves about 15 min before the giant eruption with no apparent surface activity
• These waves dominated in 0.03–0.1 Hz with amplitudes comparable to the amplitude of M4.9
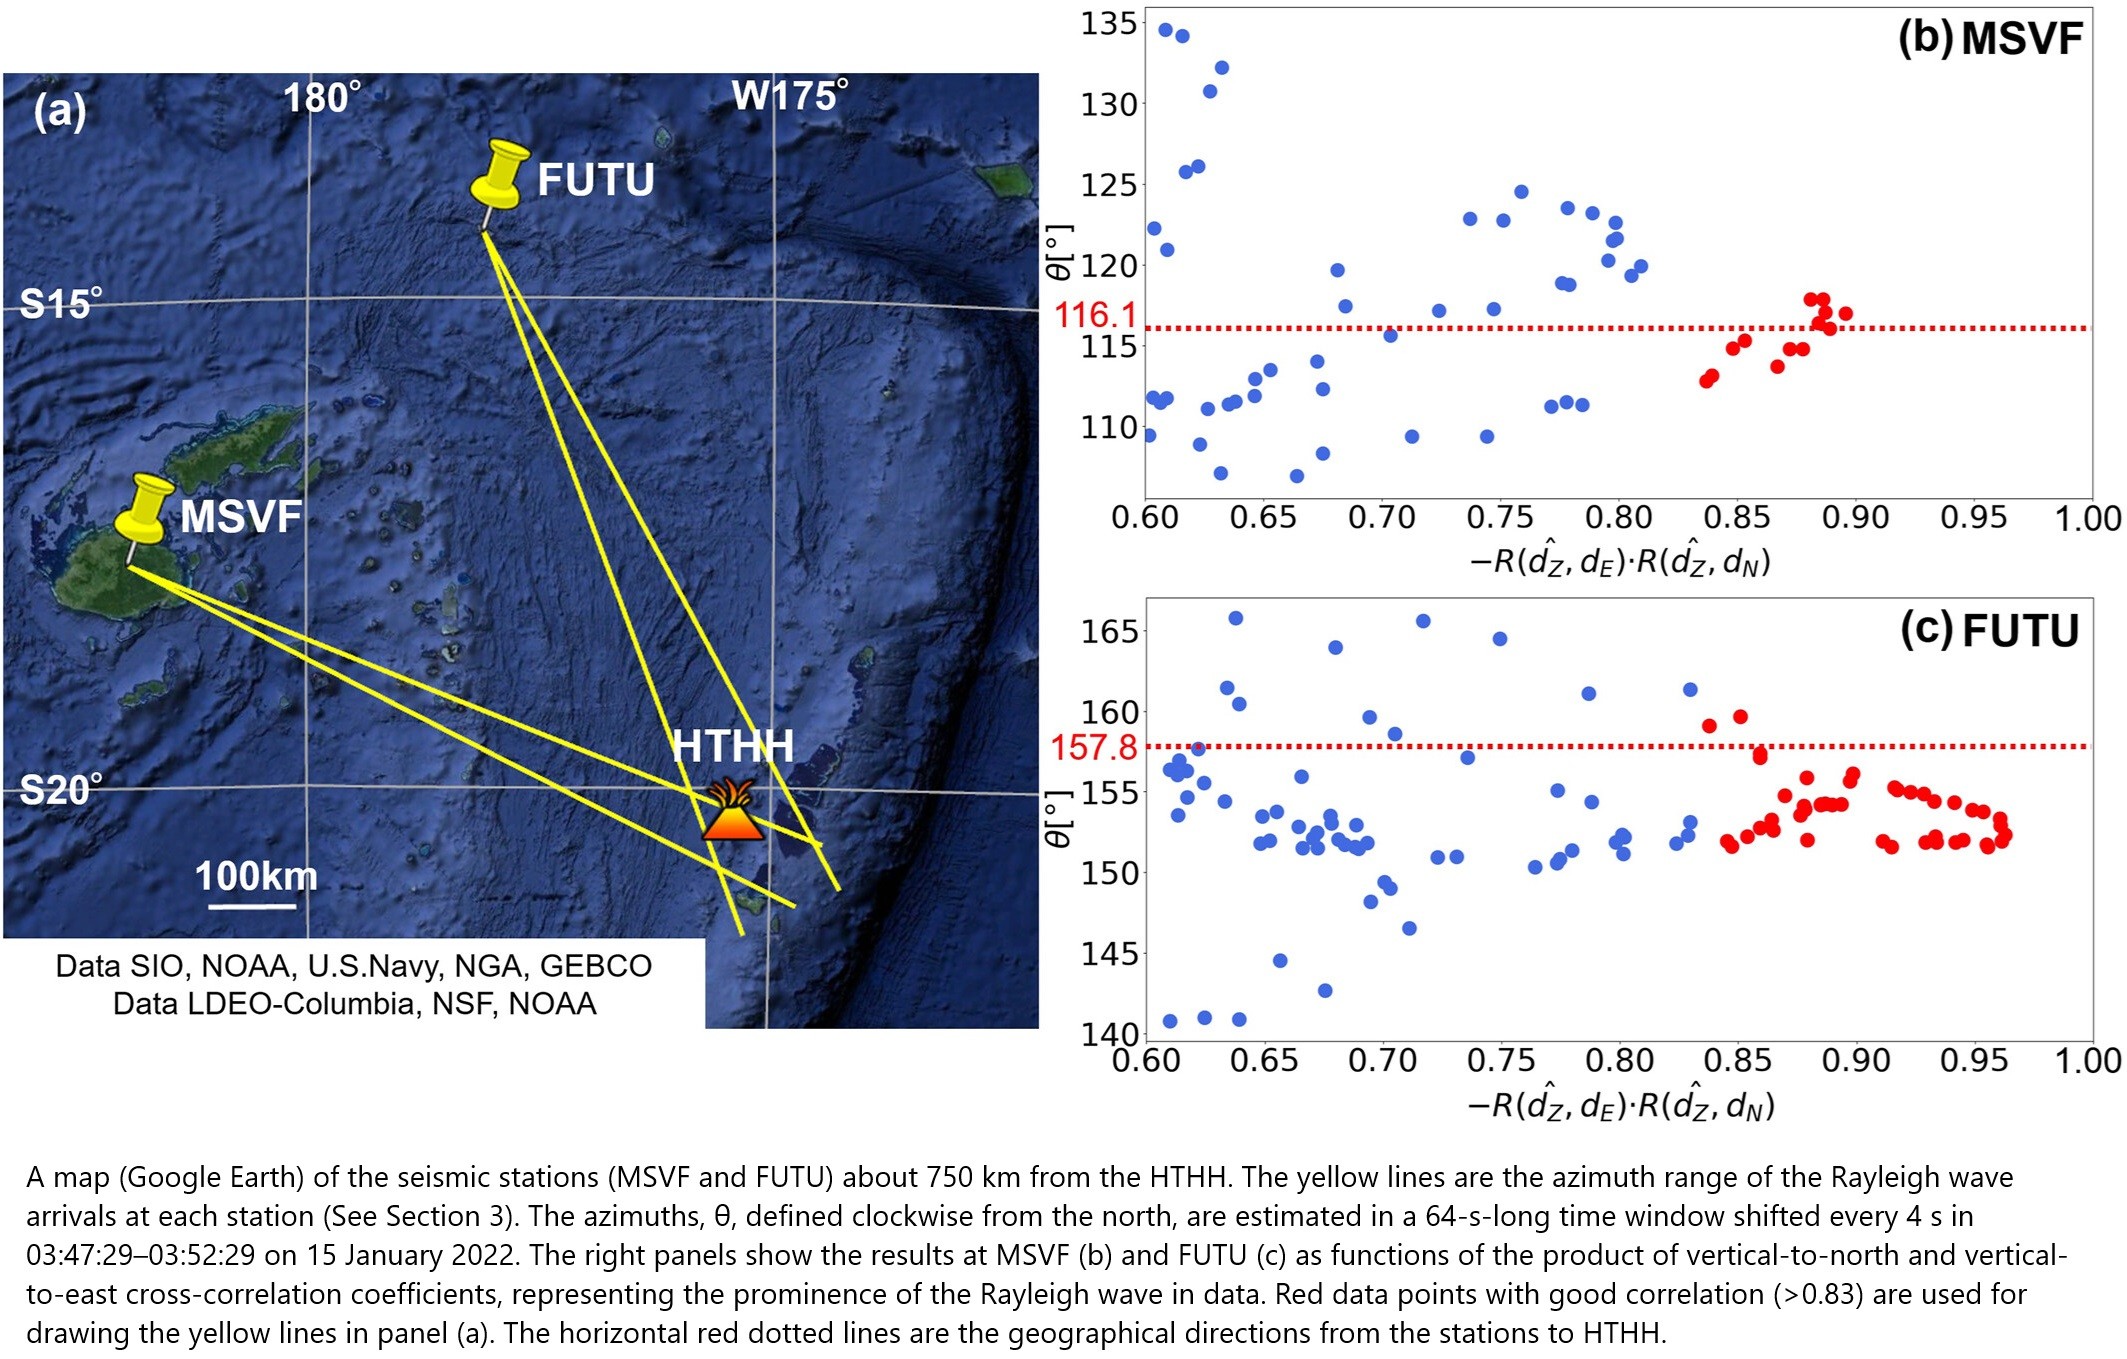
• Seismic stations 750 km from the volcano and appropriate data analyses allowed [them] to capture precursors of the catastrophic eruption..."
#geology #seismology #tonga #volcano #eruption #vulcanism #HungaTonga #RayleighWave #earthquake #precursor #remotesensing #imagery #satellite #HTHH #model #modeling #spatialanalysis #spatiotemporal #caldera #seismicstation #monitoring #naturalhazard #naturaldisaster #risk #hazard #engineeringgeology

geology cross sections / schematics - Schematic cross-section of the HTHH before the January 15 eruption (Alvarez & Camacho, 2023) (a), the eruption onset shortly after 4:00 (b), and the climactic phase starting around 04:15 (c). A scenario from the precursor to the eruption consists of high-pressure magma beneath some parts of the circular weak zone (d), tensile fracture generating the precursor around 03:45 (e), penetration of magma, magmatic gas, and seawater into the fracture (f), and magma-water interaction triggering the eruption (g).map and chart - (a) A map (Google Earth) of the seismic stations (MSVF and FUTU) about 750 km from the HTHH. The yellow lines are the azimuth range of the Rayleigh wave arrivals at each station (See Section 3). The azimuths, 
, defined clockwise from the north, are estimated in a 64-s-long time window shifted every 4 s in 03:47:29–03:52:29 on 15 January 2022. The right panels show the results at MSVF (b) and FUTU (c) as functions of the product of vertical-to-north and vertical-to-east cross-correlation coefficients, representing the prominence of the Rayleigh wave in data. Red data points with good correlation (
0.83) are used for drawing the yellow lines in panel (a). The horizontal red dotted lines are the geographical directions from the stations to HTHH.photos - sequences - eruption of Hunga Tonga-Hunga Ha'apai Volcano, Tonga, 2022charts - (a) The RMS of vertical velocity components in 0.04–0.08 Hz, 
, observed at MSVF (blue) and FUTU (orange). The vertical-to-horizontal cross correlation coefficients are displayed in panels (b–e) by colors: (b) 
 and (c) 
 at MSVF, (d) 
 and (e) 
 at FUTU. The common horizontal axes are the time of January 15, from 02:30 to 04:45. All functions are calculated in 64-s-long windows, and the values are displayed at the windows' central time. The vertical axes in panels (b–e) are the time delay, 
, of 
 relative to the horizontal components. The red vertical reference lines are at 03:49:20, 04:04:46, and 04:17:48, respectively. The orange arrows indicate the prominent Rayleigh wave pattern. (f–g) The transients of the Rayleigh wave power estimated in 0.07–0.09 Hz using 
 at MSVF (blue) and 
 at FUTU (orange) for the precursor (f) and the M5.8 earthquake (g). The times of the peaks and troughs of the transients, labeled by the circled numbers, are shown. The time differences are ①36 s, ②32 s, ③23 s in panel (f) and ①29 s, ②32 s, ③30 s in panel (g).

Client Info

Server: https://mastodon.social
Version: 2025.04
Repository: https://github.com/cyevgeniy/lmst