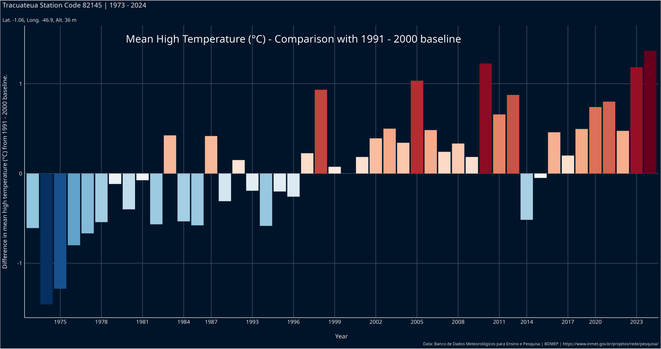
The temperature (mean high °C) anomaly with reference to the period 1991-2000 for Bragança, Pará, Brazil, generated from meteorological data of around 50 years from the nearby (15 km distant) Tracuateua station. We can see the global pattern mirrored in the local pattern. I will be showing my students how to create this kind of graph and the stripes graph too using R.
#Rlang
"R is now available in emscripten-forge, enabling the Xeus-R kernel in JupyterLite"
https://blog.jupyter.org/r-in-the-browser-announcing-our-webassembly-distribution-9450e9539ed5
Your turn guys :) https://github.com/A2-ai/rv #Rlang
Seems https://en.wikipedia.org/wiki/Carcinisation is a real thing, for language package managers at least...
( pole @HydrePrever )
Heard a rumor Doug Bates has left #rlang for #JuliaLang. Has the Rapture begun?
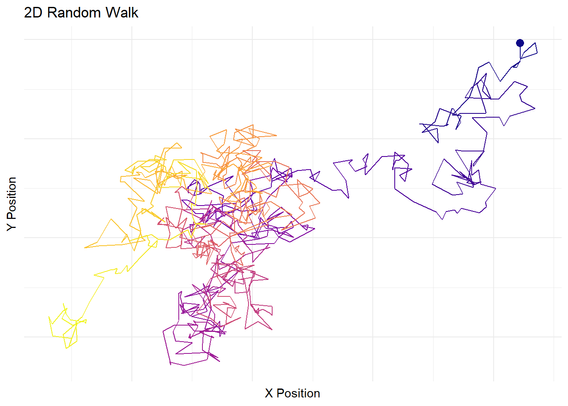
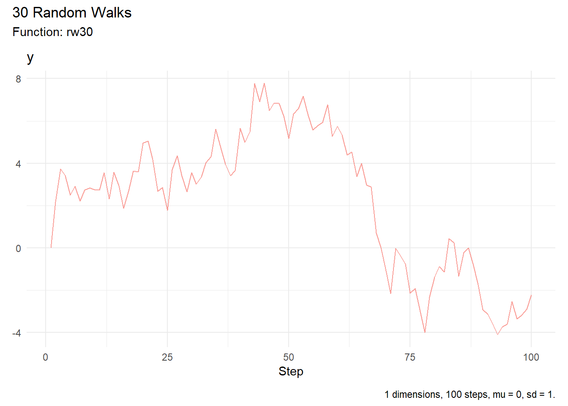
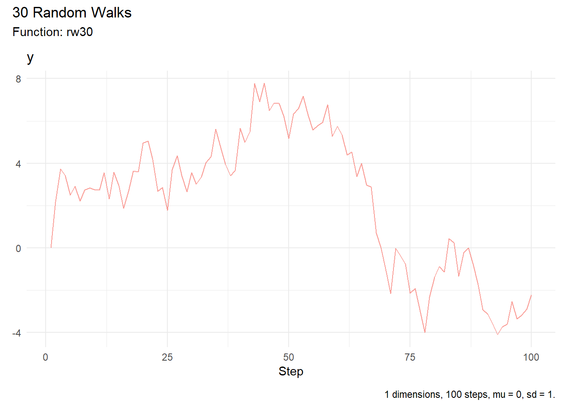
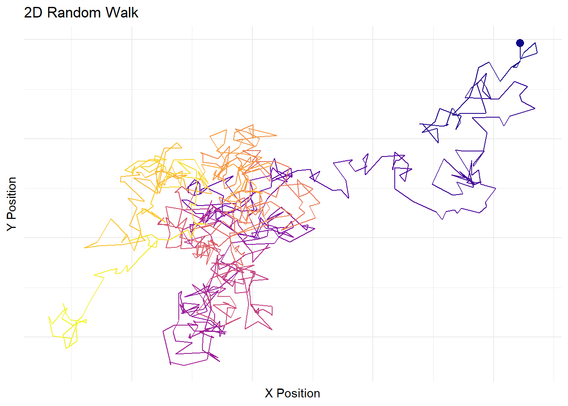
💡 The latest update to RandomWalker (v0.3.0) is here! With new features like confidence intervals and subsetting, your random walk analysis just got easier.
Explore the new capabilities: www.spsanderson.com/steveondata/...
#RStats #Data #RLang #Analysis #Stat
RandomWalker for R 0.3.0: Expa...
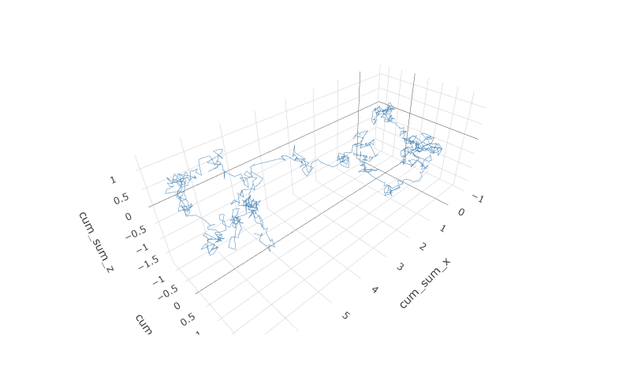
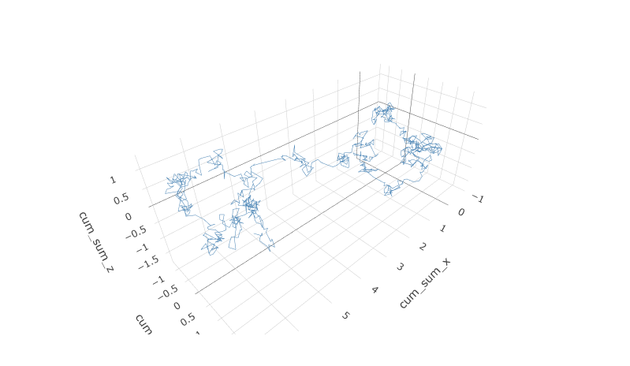
📊 Just released: RandomWalker 0.3.0! Now you can generate random walks in up to 3 dimensions. This is a must-read for R programmers looking to enhance their simulations.
Dive into the details: [https://www.spsanderson.com/steveondata/posts/2025-05-09/
#Data #RLang #Stats #RData #Blog #CRAN #RStats #TimeSeries #RandomWalker
Want to use {pak} as backend for {renv} actions? Set the variable RENV_CONFIG_PAK_ENABLED = TRUE https://github.com/rstudio/renv/issues/1210 #renv #pak #reproducibility #RLang
Running RStudio in a rootless container on Linux.
This approach avoids dealing with compiling basic packages or adding extra repositories to your main OS, and it's targeted for running the container on your computer and not somewhere else.
1. Get Podman (make sure it works rootless)
2. Run the following command in a terminal (see "man podman-run" for details on what it does)
podman run --rm -it -p 8787:8787 -e PASSWORD=baa -v $HOME:/root/home -v $HOME/.config/rstudio:/root/.config/rstudio docker.io/rocker/verseIf you need other sets of preinstalled packages see the rocker docs for other images than
docker.io/rocker/verse. For example docker.io/rocker/shiny-verse.This blog post helped me figure out what things are worth mounting in the container (you may want to add more things than only the Rstudio configuration).
I'm probably gonna turn this post into an article over at my blog at some point later.
#Rlang #Rstudio #Bioinformatics
@josi If anyone out there wants to get paid to work on an open source project and cares about an R-based IDE stack I’d welcome contributions to {debugadapter} and would be happy to help co-author an ISC proposal to work on it.
off-late, I've been feeling like i need to start learning a programming language with practical applications. something I can use to write stuff on my Linux system for my use or something which i can put up on my Sourcehut. and something a little challenging too, because where's the fun in straightforward stuff?
R has been great but, of course, that's just for data analysis. python seemed interesting but more recently Rust is what has been drawing me in.
how does one get started with Rust? what are some good resources for learning and practicing the language? i can figure out the Emacs side of things myself.
#RustLang #Programming #Language #RStats #RLang #AskFedi #AskMastodon
Looking at some of my old R code this morning... As #rlang goes, it's good code, but I wish now I'd done it with #CommonLisp or #julialang 😢
#TechnicalDebt
I'm explaining Hamiltonian Monte Carlo in my grad-level stats class tomorrow, so I put together this animation illustrating HMC in one dimension. I find it very soothing.
#bayesian #BayesianInference #posterior #stats #r #rlang #statistics #MCMC
#Rlang question for #bioinformatics & #datascience folks.
I'm used to python/julia way of running everything in a contained environment. What's the best way to do it for R these days? Renv or just stick with conda?
Please keep in mind that Codeberg is not the only viable solution. There are more venues. As codeberg they are based on #Forgejo
https://codeberg.org/forgejo/forgejo
They are working on federation of #git platforms.. The current milestone they achieved is that people can ⭐ projects.
https://fosdem.sojourner.rocks/2025/event/42340661-6f0a-5763-af54-35ec2294b9c5
What does #rlang need to help folks easily migrate to #codeberg ?
Some ideas:
💡codeberg equivalent to r-lib/actions
💡migration guide
💡usethis::use_codeberg() - create new repo or provide instructions for migrating if already on GitHub, similar to use_github
💡usethis::use_codeberg_ci() - equivalent to use_github_action
anything else that would help people make the jump?
🆕 post: Geocaching meets R language
This post is about solving a task with R language for one letterbox hybrid cache, which happen to be my favorite.
https://www.sarahgebauer.com/post/geocaching-meets-r-language
