Source: Box10.1 du Chapitre 10 #AR6
www.ipcc.ch/report/ar6/w...
ipcc.ch/report/ar6/wg1...
#AR6

#ClimateKG will be used for the #IPCC #AR6 corpus of 7 main reports of 10,000 pages. For corpus browsing, republishing, community enrichment. The constructed knowledge graph in Wikibase/MediaWiki allows browsing using the familiar #MediaWiki interface with #Wikidata enhancements like infoboxes, and #scholia like interfaces https://scholia.toolforge.org/ | Republishing is intended for sharing or reviewing search results on climate topics | Enrichment is for data scientists to make use of reports >>>
#ClimateKG - the #IPCC #AR6 reports are a pretty big beast. Authored over 7 years they are the ultimate #statusupdate of planet earth. Quant data: https://doi.org/10.5281/zenodo.17521936 - Reports 7, Pages 10,047, Words 8,047,000, Citations 48,400, Data 66,834, Figures 1,672, Authors 1,106, Glossary 925, Acronyms 3,041, Lang 5+. The entity relationship model is need to map the parts of the reports, relations, then to allow markup of entities, concepts, etc
#ClimateKG project is developing an Entity Relation Model to represent the syntactic structure of a scientific document in a knowledge graph.
We are reaching out to ask for recommendations of projects, literature, methods, etc.
The ClimateKG will hold #IPCC #AR6 corpus of 7 reports for browsing, republishing, enrichment.
Knowledge graph uses #Wikibase / #MediaWiki
Write up: https://github.com/TIBHannover/climate-knowledge-graph/issues/51
IPCC AR6 corpus: https://doi.org/10.5281/zenodo.17516065
ClimateKG project: https://tibhannover.github.io/climate-knowledge-graph
@tibosl @LIBEReurope @tibhannover The project to make a #knowledgegraph of #IPCC #AR6 and so make it acessible, allow data scientist to explore the reports is finishing its scoping phase. We'll be publishing a series of reports and RfCs. To start with here is a #AR6 quantification report (aka - the how big is the beast we have to ingest) - https://doi.org/10.5281/zenodo.17516065

Will ich ein Klimakonzept besser verstehen, schlage ichs in PDF von AR6-WG1 nach.
Wenn ich Klimafolgen einschätzen lernen will, lese ich quer oder suche nach Stichworten in AR6-WG2. https://www.ipcc.ch/report/ar6/wg2/
WG1 und WG2 mach ich ca. alle 2 Monate mal auf.
WG3 umfahre ich weitläufig, weil ÖkonObszön.
Benutzt Ihr manchmal AR6?

Vor 4 Jahren haben @fuzzyleapfrog & @astrodicticum begonnen, im 🎙️ Podcast "Das Klima" den ganzen IPCC-Bericht #AR6 zu lesen, damit ihr das nicht selbst machen müsst - und jetzt machen sie mit dem Zweiten Österreichischen Sachstandsbericht #AAR2 zum Klimawandel weiter...
https://dasklima.podigee.io/141-dk141-der-zweite-osterreichische-sachstandsbericht-zum-klimawandel

The rate at which atmospheric CO2 is increasing is now outpacing the pathways set out by the Intergovernmental Panel on Climate Change (IPCC) that limit global warming to 1.5C.
The third working group report of the #IPCC’s sixth assessment report (#AR6), published in 2022, presented a set of seven “illustrative pathways” that highlight how different mitigation choices across major economic sectors translate into future #GreenhouseGas #emissions and global temperatures.
In the three most-ambitious pathways, #GlobalWarming has a 50% chance of either staying below 1.5C, or overshooting it by only 0.1C (for up to several decades) before then returning to below 1.5C.
Yet, not only are atmospheric #CO2 concentrations still rising, the rate of rise is #accelerating.
The build-up of CO2 in the #atmosphere has been monitored at the #MaunaLoa observatory in #Hawaii since 1958.
As illustrated by the iconic #KeelingCurve below, the increase has been accelerating over the decades (blue line) due to ongoing emissions of CO2 from burning #FossilFuels and changing land use.
So while the curve needs to rapidly bend in the other direction to hold warming to 1.5C (light red line), the rate of rising CO2 marches onwards and upwards.
https://www.carbonbrief.org/met-office-atmospheric-co2-rise-now-exceeding-ipcc-1-5c-pathways/


@pahi Mit dem sechsten Sachstandsbericht des #IPCC (#AR6) 2023 hat sich für mich das Thema Klimawissen erledigt: Es liegt alles auf dem Tisch.
Eltern fliegen - auch wider besseren Wissens - lieber weiter jährlich mit ihren kleinen Kindern in den Urlaub.
Die Menschen wollen es leugnen.
Die Menschheit ignoriert hunderte Millionen bis Milliarden Klimaflüchtlinge.🤷♂️


@stefanmuelller @einfachnurRoland
2/2
https://webtv.un.org/en/asset/k1c/k1ce3oitwq
The last speaker, German legal representative Zimmermann was particularly evil.
In addition to stuff listed above, he also said things like:
A person outside a country's jurisdiction can not hold the country responsible for violating their human rights. Only persons can who're being harmed in the country. And only LIVING citizens can – an extension of human rights to future generations can't be derived from any legal text. Cultural identification with land and ancestors and future generations is immaterial to climate-related international law, such an identity or entity has no protection whatsoever.
The guy is head of the German research institute for Human Rights!!
Here's his CV https://legal.un.org/avl/pdf/ls/Zimmermann_bio.pdf
edit: Just now found the Verbatim Record from the court procedings.
The english version of the German legal representatives starts on page 141 and begins with Mrs Rückert. Mr. Zimmermann starts page 147.
https://www.icj-cij.org/sites/default/files/case-related/187/187-20241202-ora-01-00-bi.pdf
edit2:
I think, some important sentences from the first hearing are missing in the Verbatim Record. I distinctly recall one of the Pacific / Melanesian speakers proposing something like wartime command economy for large polluters to fulfil obligations from the Human Rights charta, and to meet recommendations in #IPCC #AR6 "immediate and deep emission cuts this decade".
Sadly, at the moment, video access to all of UN WebTV is forbidden or I could verify and quote the passage.
#ICJ #InternationalCourtOfJustice #ClimateChange #ClimateJustice
Und? Was denkt Ihr so?
Über 6% der Grün-Wählenden haben AfD-Verhinderungsstrageie angewendet und Woidkes SPD gewählt, nehme ich an.
War aber bei der Ltw 2019 auch schon so . In Umfragen der Forschungsgruppe Wahlen standen 2 Tage vor der Wahl
Grüne bei 14.5%
und SPD bei 22%.
Gewählt haben damals
Grüne 10.8%
und SPD 26.2%. https://www.wahlrecht.de/umfragen/landtage/brandenburg.htm
Bei der jetzigen Ltw hat die Forschungsgruppe Wahlen das Ergebnis der Grünen korrekt gepollt: 4.5%.
Ich mein, nich, dass Grüne die Biodiversitäts- und Klimaretter wären. Aber die % sind doch ein Indikator für Klimabewusstsein.
Gibts nich in Brandenburg.
Tja.
Dann versteppt es eben, wie es vor zig Jahren mal in einer PIK-Projektion für Brandenburg hieß. Damals haben sich die BB-Politiker gegen den Begriff Versteppung gewehrt, weil er zu beunruhigend klänge (steht im Buch "Deutschland 2050")
Je nun.
Im Europa-Kapitel 13 vom #AR6 WG2 steht:
"an expansion of desert biomes in East Europe."
Desert biomes versus Versteppung, was klingt beunruhigender?🤔
The Paris Limit of 1.5°C is defined as "by the end of the century".
The dream goes: we splurge now and later, Greta goes on a diet/gets a tummy tuck.
It's called "overshoot scenario" and all 1.5-scenarios and even most of the below-2C-scenarios have the magicc of carbon removal built in. (By which the excess CO2 to a to-be-determined warming level is removed.)
Joeri Rogelj explains 3 factors (there are more!) why the ease in which society looks at 1.5C_overshoot scenarios is overconfident:
* 1 out of 6 of such model runs do an overshoot by a whopping 0.5C !
* societies face more stress in overshoot from temperature the increase, and as a result, maybe stop CO2 removal altogether !
* exact warming per t CO2 is uncertain !
#Rogelj is the God Of #CarbonBudget and #IPCC lead author in #AR6-WG1.
https://granthaminstitute.com/2023/11/29/overconfidence-in-overshoot/

What's change since AR6?
https://essd.copernicus.org/articles/16/2625/2024/essd-16-2625-2024.html
#ClimateChange #AR6 #2023

How much warming in the middle #Miocene 15million years ago came from methane?
Methane is not constrained at all for the Miocene.
But I did the maths –yet I also warn you: I am maths dyslexic. 😁
tldr: with assumed 10 times more wetlands than today and all of the remaining landmass assumed to be like today's tiny "wild rest",
CH4 emissions were 2124 Mt per year.
Which amounted to 6608 ppb CH4 in the atmosphere which in itself caused +2.1°C .
CO2 in 15Ma is not well constrained either. (see below)
I calculate 560ppm to have contributed 3°C (current science working theory for ECS ±1).
So methane 2.1°C and CO2 3°C on their own, omitting all other climate factors, caused +5.1°C in the Miocene.
The breakdown of the numbers follows. With links.
# CO2:
Hoenisch et al 2023 published meticulously revised CO2 values from global #d13C proxies https://paleo-co2.org , their considered-best proxies are all oceanic in origin.
The chart #1 of 1milion years 15 million years ago, shows #Hoenisch ' s CO2 proxies as the horizontal lines. I chose to fill the gaps with repeated values between the rare data points. So each line segment really is only 1 data point at its right-most end.
560 ppm CO2 seems an okay guess, no?
@Peters_Glen did a cool chart, more intuitive than the one in #AR6, I think. See pic 2 or his tweet where he plots the various greenhouse gases with their warming contribution 2010-2019: https://x.com/Peters_Glen/status/1431873249449680901
The average CH4 concentration in the decade 2010-2019 was 1840ppb (NOAA) and caused +0.51°C as per Glen's chart.
From Glen's chart follows my secret methane formula 😁
1 Mt methane <=> 3.111 ppb <=> 0.001 ºC
If emissions in 15Ma were 2124 Mt CH4 (see #landmass below), it resulted in 2.12°C at a concentration of 6608 ppb.
According to the Global Methane Budget by #GlobalCarbonProject : https://essd.copernicus.org/articles/12/1561/2020/
emissions from the "wild rest" 2008-2017 were 222 Mt CH4 annually . See picture 3.
The wild rest today is 54mio km2, according to #OurWorldInData https://ourworldindata.org/global-land-for-agriculture
Wild rest: 222 Mt CH4 from 54mio km2 = 4.1 t CH4 / km2.
Emissions from wetlands 2008-2017 were 180Mt CH4 (Tg=Mt) .
They cover 4.37% of the total land mass: https://ourworldindata.org/grapher/coverage-of-wetlands?tab=chart&country=~OWID_WRL
4.37% of 141mio km2 total is:
Wetlands 6.2mio km2.
Wetlands: 180 Mt from 6.2 km2 = 30 t CH4 / km2.
In 15Ma Miocene, 10 times more wetlands would have been
62 mio km2.
And
wild rest 79 mio km2.
wetlands 62mio km2 times 30t CH4 = 1800 Mt CH4
wild rest 79 mio km2 times 4.1t CH4 = 324 Mt CH4.
Wetlands plus wild rest:
1800 Mt + 324 Mt = 2124 Mt CH4
secret methane formula:
1 Mt methane <=> 3.111 ppb <=> 0.001 ºC
2124 Mt <=> 6608 ppb <=> 2.12°C
Why do I assume that wetlands were 10x more than today, tho? Why not 15, 20 or 5 times more?
Dunno. Well, humans have unwetted lotsa wetlands since the invention of agriculture in the #Holocene. (Btw, the area of today's dried peatland alone emits 2Gt CO2 per year. See table on dried wetland areas and their emissions GHG:
https://www.nature.com/articles/s41467-020-15499-z/tables/2 #Günther et al 2020, based on IPCC guidelines for wetlands https://www.ipcc.ch/publication/2013-supplement-to-the-2006-ipcc-guidelines-for-national-greenhouse-gas-inventories-wetlands/ )
Hard to tell what area was covered by wetlands in the previous interglacial 126thsd years ago.
And in the middle Miocene, 15Ma?
My thinking goes like this:
The #Sahara was still forested 15Ma. As was the Gobi Desert probably. The prairies in the US were still forested, even #Greenland and #Antarctica. Northern #Russia had much more land mass back then, too.
Some of the different vegetation compared to pre-Holocene was due to different topography: the Rockies and Alpes were much, much lower, the high mountain ranges in East Asia didn't exist. #Australia was 15° further South. See also #Steinthordottir et al 2021 in "Miocene The Future Of The Past https://agupubs.onlinelibrary.wiley.com/doi/full/10.1029/2020PA004037
And the whole special Miocene issue:
https://agupubs.onlinelibrary.wiley.com/doi/toc/10.1002/(ISSN)2572-4525.Miocene1
All land area had gap-less biomes growing. Mostly forests. What do forests do? Away from the coast, within the continents, forests control the hydrological cycle, how much evaporates and how much it rains. All biomes do, but forests most.
The more forests there are, the more it rains. Uninterrupted plant cover with its propagating rain cycle hinders deserts from forming in the heart of the continents, too.
Also, air holds 7% more water per 1°C warming, raising the potential rain amount.
Now, if it rains a lot, and depending on the topography, land is inundated temporary, seasonally or permanently, methane-producing microbes in the soil get to work presto, eat carbon and fart CH4.
The warmer it is, the more the microbes work.
But why 10x more wetlands?
Why not 7 or 15x?
Dunno. 10 feels right. And 6608ppb is nicely close to a guesstimate of mine that mid Miocene CH4 concentration cd have been 7000 ppb.
Maybe 400ppb came from huge animals, happily roaming among giant trees.
Brazil's Giant Sloth? The "wild rest" in the Miocene was HUGE! And cute.
#FridaysForFuture
#anloCH4


Da bald wieder Waldbrandsaison ist und Kachelmann dann jedes Jahr komische Ausraster kriegt, dass Hitze nix mit Waldbränden zu tun habe: das ist seine eigene Meinung, hat aber nix mit dem Stand der Wissenschaft zu tun. Er verteidigt die Meinung unter bewusster Auslassung von Fakten, die ihm sehr wohl bekannt sind.
Hier haben sich mal echte Wissenschaftler Reto Knutti und Sonia Seneviratne (WG1 Vice-chair. #Climate #Extremes #Land #AR6 #SR15. ) mit ihm hingesetzt und in Engelsgeduld versucht es ihm zu erklären. https://twitter.com/Knutti_ETH/status/1272913423911858182
Aber er besteht auf seiner falschen Meinung. Und benutzt diese eben auch regelmäßig um Leute zu beleidigen.
Die Screenshots sind alle aus der Konver ab da, wo Reto ihm erklärt, was die 4 Definitionen von Dürre mit Regen zu tun haben: nur die 1 sei 100% regenabhängig, die anderen seien abhängig von Verdunstung aus Boden und Pflanzen.
Kachelmanns Antwort: "Ich rede immer von 1."
Genau darum argumentiert er eben immer falsch und wissenschaftsleugnend.


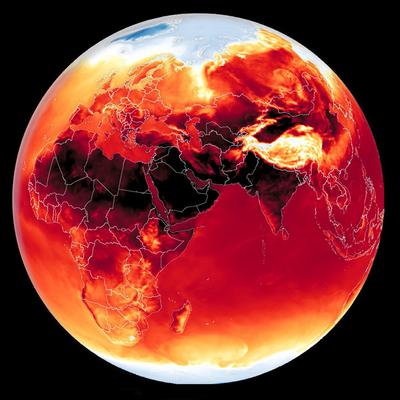
Factcheck: Why the recent ‘acceleration’ in #GlobalWarming is what scientists expect
However, this acceleration is broadly in line with projections from the latest generation of #ClimateModels and the recent sixth assessment report (#AR6) from the Intergovernmental Panel on Climate Change (#IPCC). They all expect the world to warm notably faster in both current and future decades than the rate the world has experienced since 1970.
Carbon Brief’s analysis also reveals that the speed up in
1/

A year ago today IPCC
published its #AR6 Synthesis Report: Climate Change 2023. Based on John Lang
's 4th & final amazing #infographic (https://eciu.net/analysis/infographics/ipcc-explainer-infographic-synthesis-report-climate-2023) what's happening and what should we do? - Stop future fossil fuel projects! #JoinUs

Quantitative scenarios are an important component for understanding #ClimateChange, including risks, #adaptation options and #mitigation pathways...


5/
More details:
Chapter 6 of the #IPCC #AR6 report: e.g. 6.7.4
https://www.ipcc.ch/report/ar6/wg3/chapter/chapter-6/#6.7.4
"Global #FossilFuel use
will need to decline substantially by 2050 to limit #warming to 2°C (>67%), and it
must decline substantially by 2030 to limit warming to 1.5°C (>50%) with no or limited overshoot (high confidence).
Failing to reduce global fossil fuel use below today’s levels by 2030 will make it more challenging to limit warming to below 2°C (>67%)"
See Figure 6.35:
https://www.ipcc.ch/report/ar6/wg3/figures/chapter-6/figure-6-35
4/
The keynote https://www.ipcc.ch/2023/10/09/mena-climateweek-ipcc-chair-jim-skea/
reminds of course the #IPCC #AR6 summary https://www.ipcc.ch/report/ar6/wg3/resources/spm-headline-statements/
"Reducing #GHG emissions across the full energy sector requires major transitions, including
a substantial reduction in overall #FossilFuel use,
the deployment of low-emission energy sources,
switching to alternative energy carriers, and #EnergyEfficiency and conservation.
The continued installation of unabated fossil fuel infrastructure will ‘lock-in’ GHG emissions. (high confidence)"
Client Info
Server: https://mastodon.social
Version: 2025.07
Repository: https://github.com/cyevgeniy/lmst