#warming

Dr. Or M. Bialikombialik@mastodon.world
2025-06-17

We talk a lot about #sea level rise due to #warming and ice melt. That it's not just based on models. We have a robust #geological record of ice melt events to talk about this with relative confidence*.

* Science speak for "we're fairly sure"

Link: science.org/doi/full/10.1126/s

Peak global mean temperature, atmospheric CO2, maximum global mean sea level (GMSL), and source(s) of meltwater.
Light blue shading indicates uncertainty of GMSL maximum. Red pie charts over Greenland and Antarctica denote fraction (not location) of ice retreat.
2025-06-11

#Climate #warming is not a recent phenomenon (of a few years or decades); it has had detectable impacts on plants (and animals) for at least 134 years!

The onset of phenological plant response to climate warming
nph.onlinelibrary.wiley.com/do
jgpausas.blogs.uv.es/2025/06/1

#Phenology #Changes for the Japanese cherry tree (#Prunus jamasakura) in Kyoto & the shifting baseline syndrome in global change research
@ecology @plants @botany @plantscience @nature @biodiversity @conservation @climate

Graphic showing phenology changes for the Japanese cherry tree (Prunus jamasakura) in Kyoto. Left: Day of the year of the flowering peak for the period between 812 and 2024. Right: Relation between March mean air temperature (°C) in Kyoto and the day of the year of the Japanese cherry tree peak flowering for the period between 1890 and 2024.
2025-06-10

The role of aerosol declines in recent warming

SO2 declines have contributed ~25% of recent #warming and driven recent acceleration - Zeke Hausfather

theclimatebrink.com/p/the-role

#climate #ClimateChange #GlobalWarming #aerosols #sulphur

panda ♥️ 🇪🇺panda@pandas.social
2025-06-09

"Replanting #forests can help cool the planet even more than some scientists once believed, especially in the #tropics. But even if every #tree lost since the mid-19th century is replanted, the total effect won’t cancel out human-generated #warming. Cutting #emissions remains essential."

news.ucr.edu/articles/2025/05/

#globalwarming #news

Dendrobatus AzureusDendrobatus_Azureus@bsd.cafe
2025-06-08

This is a very nice Mandir in my country

De photograph was composed in absolute full Solar light without any filters since I only have the filter housings / step up / step down rings for my {A{D}}SLRs

#Photography #Warming #noFilter #Mandir #Architecture #Android

The photograph depicts a vibrant scene with a prominent building featuring bright orange domes and blue accents, suggesting a Mandir Mosque or a similar structure. The building is adorned with intricate patterns and has multiple arched windows. In the foreground, there are several parked cars, including a purple van and a red car, along with a red-roofed building labeled "FUHUANG Supermarket." The street is lined with a mix of residential and commercial buildings, some with red roofs, and a decorative fence with blue and red elements. The sky is clear with a few scattered clouds, and the surrounding area is lush with greenery, including palm trees. The overall atmosphere is lively and colorful, with a blend of architectural styles.

 Ovis2-8B

🌱 Energy used: 0.185 Wh
Dr. Or M. Bialikombialik@mastodon.world
2025-06-07

There was this notion, that as things get warmer, corals will expand to higher latitudes. But that seems not to be the case. Corals are too slow, and #warming is too fast. Not great news for the future of corals #reefs.
Something also to remember when we look at past extinction events.

Link: science.org/doi/10.1126/sciadv

Marker colors represent the mean relative change in coral cover from 2010-2019 to 2090-2099 under SSP2-4.5 across all ensemble members in CERES for (A) all, (B) reef, and (C) nonreef coral. Sites are scaled by the absolute coral cover between 2090 and 2099.
Dr. Or M. Bialikombialik@mastodon.world
2025-06-05

Title summarizes it all: #Warming accelerates global #drought severity.
Dry regions are becoming drier, while wet areas are also experiencing drying. Just over the last 5 years, drought areas expanded 74% compared to the prior 36.

Link: nature.com/articles/s41586-025

a,b, The quasi-global (50° S to 50° N) average HRSPEI (a) and global percentage of area in droughts (b). c, The trend in 6-month HRSPEI for 1981–2022 (z-units yr−1), with non-significant trends (P > 0.05) marked in grey for visualization. d, The 6-month HRSPEI values for the record-breaking drought in August 2022 (z-units). The time series uses HRSPEI (0.05°), CRU-TS (0.5°) and ERA5 (0.25°), with HRSPEI being the ensemble mean of MSWEP_hPET, MSWEP_GLEAM, CHIRPS_hPET and CHIRPS_GLEAM (1981–2022). CRU-TS covers 1901–2022 and ERA5 spans 1950–2022. The time series are averaged over tropical and subtropical land areas (50° S to 50° N), excluding regions with average annual rainfall below 180 mm. For regions above 50° N, the spatial trend is based on the mean of MSWEP_hPET and MSWEP_GLEAM, as CHIRPS is available up to 50° N. The vertical lines indicate the period from 1950 to 1980, showing higher positive SPEI values based on ERA5 and CRU-TS compared with 1981–2022.
Timothy Schwinghamer (he/him)schwinghamer@mstdn.social
2025-06-02

What is the United Nations’ 1.5°C global mean #warming target? In the first of an occasional series of explainers on the statistics and data underpinning our understanding of #ClimateChange, David B. Stephenson and Andrew Garrett answer some frequently asked questions. This first set of explainers focuses on the famous 1.5°C benchmark that is considered key to avoiding #climate #catastrophe.

doi.org/10.1093/jrssig/qmaf010

Effective emergency management prevented larger catastrophe after climate change fueled heavy rains in Central Mississippi river valley

The #floods inundated large rural areas including agricultural fields, especially in #Arkansas which has resulted in an estimated 78 Million USD of damage due to losses in fields that were already planted. Larger losses were avoided due to the timing of the floods before other #crops like #peanuts and #cotton were planted, and since there is still a window to replant crops like #corn and #soybeans.

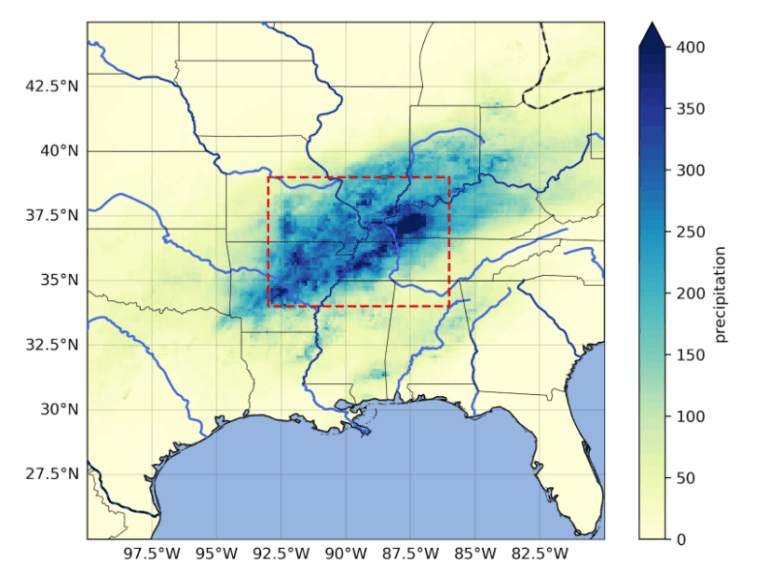
Based on gridded data products, we find that the extreme #rainfall event over the study region is relatively rare, expected to occur in today’s #climate only once every 90-240 years across different observational and reanalysis datasets. However, in a 1.3°C cooler climate, extreme rainfall such as observed would be even rarer. The best estimates for the increase in likelihood for the 2025 event associated with this warming is between a factor 2 to 5, and the increase in intensity for an event of equivalent rarity as observed is 13-26%.

To quantify the role of human-induced #ClimateChange in this increased likelihood and intensity we also analyse climate model data over the study region for the historical period. The best estimate of the synthesised result, combining observations with climate models, is about a 40% increase in likelihood and about a 9% increase in intensity. These estimates are smaller than the observed trends due to large discrepancies between the climate model results. While some models show increases similar to or larger than the observed trends, others show weaker or even decreasing trends.

In contrast, #ClimateModels consistently project that extreme precipitation events such as the one observed in April 2025 will become more frequent and intense in the future as global temperatures rise. Under current climate policies – which will lead to warming of approximately 2.6°C by 2100 – such extremes are expected to approximately double in likelihood again, and increase in intensity by about a further 7%.

As the moisture that fuelled the rainfall event was partly coming from the #GulfOfMexico we also assessed the role of climate change in the sea surface temperatures. We found that these waters were heated by approximately 1.2 °C (2.2 °F) due to human-caused climate change, and such #ocean conditions are now about 14 times more likely than in a cooler pre-industrial world. This contributed to higher #evaporation rates, increasing the availability of moisture in the rainfall event.

The strong observed trends in precipitation extremes in this region are also found in other studies using different methods, across different regions, including the Central #Mississippi river valley and are assessed as being attributable to climate change by the #IPCC AR6 report.

In conclusion, due to (1) the observed trends that are (2) in line with IPCC assessments and other literature in the region, and (3) the clear emergence of a climate change signal with further #warming in all climate models as well as (4) the availability of more moisture due to higher SSTs, we state that climate change amplified the heavy rainfall leading to the floods and that the estimate from observations and models combined of a 9% increase in intensity and 40% increase in likelihood is conservative and the role of climate change could be as large as the observations alone suggest

Despite being an extremely complex event, with tornadoes, flash floods, riverine floods and landslides overlapping, the US National Weather Service made a tremendous effort to provide early warnings for the floods, in some cases up to a week in advance of river crests. These early warnings allowed state and local emergency departments to prepare, inform the public, and evacuate those at highest risk. While any loss of life is devastating, the outcomes of this event point to the effectiveness of decades-long investments made in forecasting, #EarlyWarningSystems, and #forecast-based action.

Nearly half of NWS field offices are facing vacancy rates of 20% or more, double the short-staffing levels of a decade ago. Former NWS leaders have recently warned that layoffs could impact the ability of NWS offices to respond to extreme weather events and keep people safe.

worldweatherattribution.org/ef

#ExtremeWeather
#WeatherAttribution

4-day accumulated precipitation over the Central Mississippi river valley from 03/04/2025-06/04/2025. Major rivers are marked in blue and the study region for rainfall is highlighted with the red dashed line. Data from MSWEP.
Journal of Plant Ecologyjpecol
2025-05-25

🔎 & ➡️ (CO2 gradients)
Results:
1️⃣ Populations adapted to different environmental regimes exhibit multi-trait variation across CO2 gradients.
2️⃣ The variability driven by long-term adaptation > by short-term CO2 changes.
doi.org/10.1093/jpe/rtae116

Multi-trait variations of Phaeodactylum tricornutum Bohlin populations in ambient, warming, elevated CO2 and elevated CO2 + warming regimes across CO2 gradients.The PCAs of multiple traits of Phaeodactylum tricornutum Bohlin populations among different regimes (a), individual CO2 levels (b) or CO2 clusters (c).
2025-05-25

#idw #Climate Marine heatwaves pose problems for coastal #plankton

Temperatures around the world continue to rise – and the #NorthSea is no exception. Yet, in addition to this gradual #warming, increasingly frequent and intense heat events also have consequences for marine organisms. When heatwaves are added, however, these alterations are amplified. The results have been published in three publications, most recently in #Limnology and #Oceanography.
Link: idw-online.de/en/news852704

Journal of Plant Ecologyjpecol
2025-05-23

➡️ & (SOC)❓
Observation indicators:
1️⃣amino sugar C;
2️⃣particulate organic matter;
3️⃣mineral-associated organic matter
Results:
1️⃣reduced the formation of new SOC;
2️⃣decreased the new microbial necromass in both soil fractions.
doi.org/10.1093/jpe/rtaf005

Location of study area and vegetation type of sampling site.Mass and new C formation allocation of POM and MAOM fractions under the G and O treatments in the topsoil (0–10 cm) at 15 °C and 25 °C.
Journal of Plant Ecologyjpecol
2025-05-22

‼️ 🌡️ ➡️ and substrate mediated ecosystem functions in - and
Results: The 💨 emission from shrub-dominated peatlands was significantly lower than that from Sphagnum-dominated peatlands.
doi.org/10.1093/jpe/rtae102

The key genera in Sphagnum- and shrub-dominated peatlands.The 35-day incubation experiment.

seasonal ratchet.
once more Climate ups its torque,
daring Spring to break

#haiku #poem #SmallPoem #SmallPoems #ShortPoem #climate #ClimateDenial #ClimateCrisis #heat #warming #metaphor

2025-05-15

Global risk of wildfire across timber production systems, by Bousfield et al. nature.com/articles/s41467-025

High-intensity #wildfires increase with timber #plantations in many temperate countries (orange), and will only continue to grow if the #climate keeps #warming

@ecology @nature @biodiversity @conservation @climate

Fig. 3: National-level plantation wildfire risk effect size and percentage of timber-producing forest under plantation systems.

Client Info

Server: https://mastodon.social
Version: 2025.04
Repository: https://github.com/cyevgeniy/lmst