Mercredi 4 Juiln, nous aurons le plaisir de recevoir VictorGallet de @bpifrance@x.com pour nous parler Async Profiler: optimiser vos applications #flamegraph #optimization https://www.alpesjug.fr/?p=3566
#Flamegraph
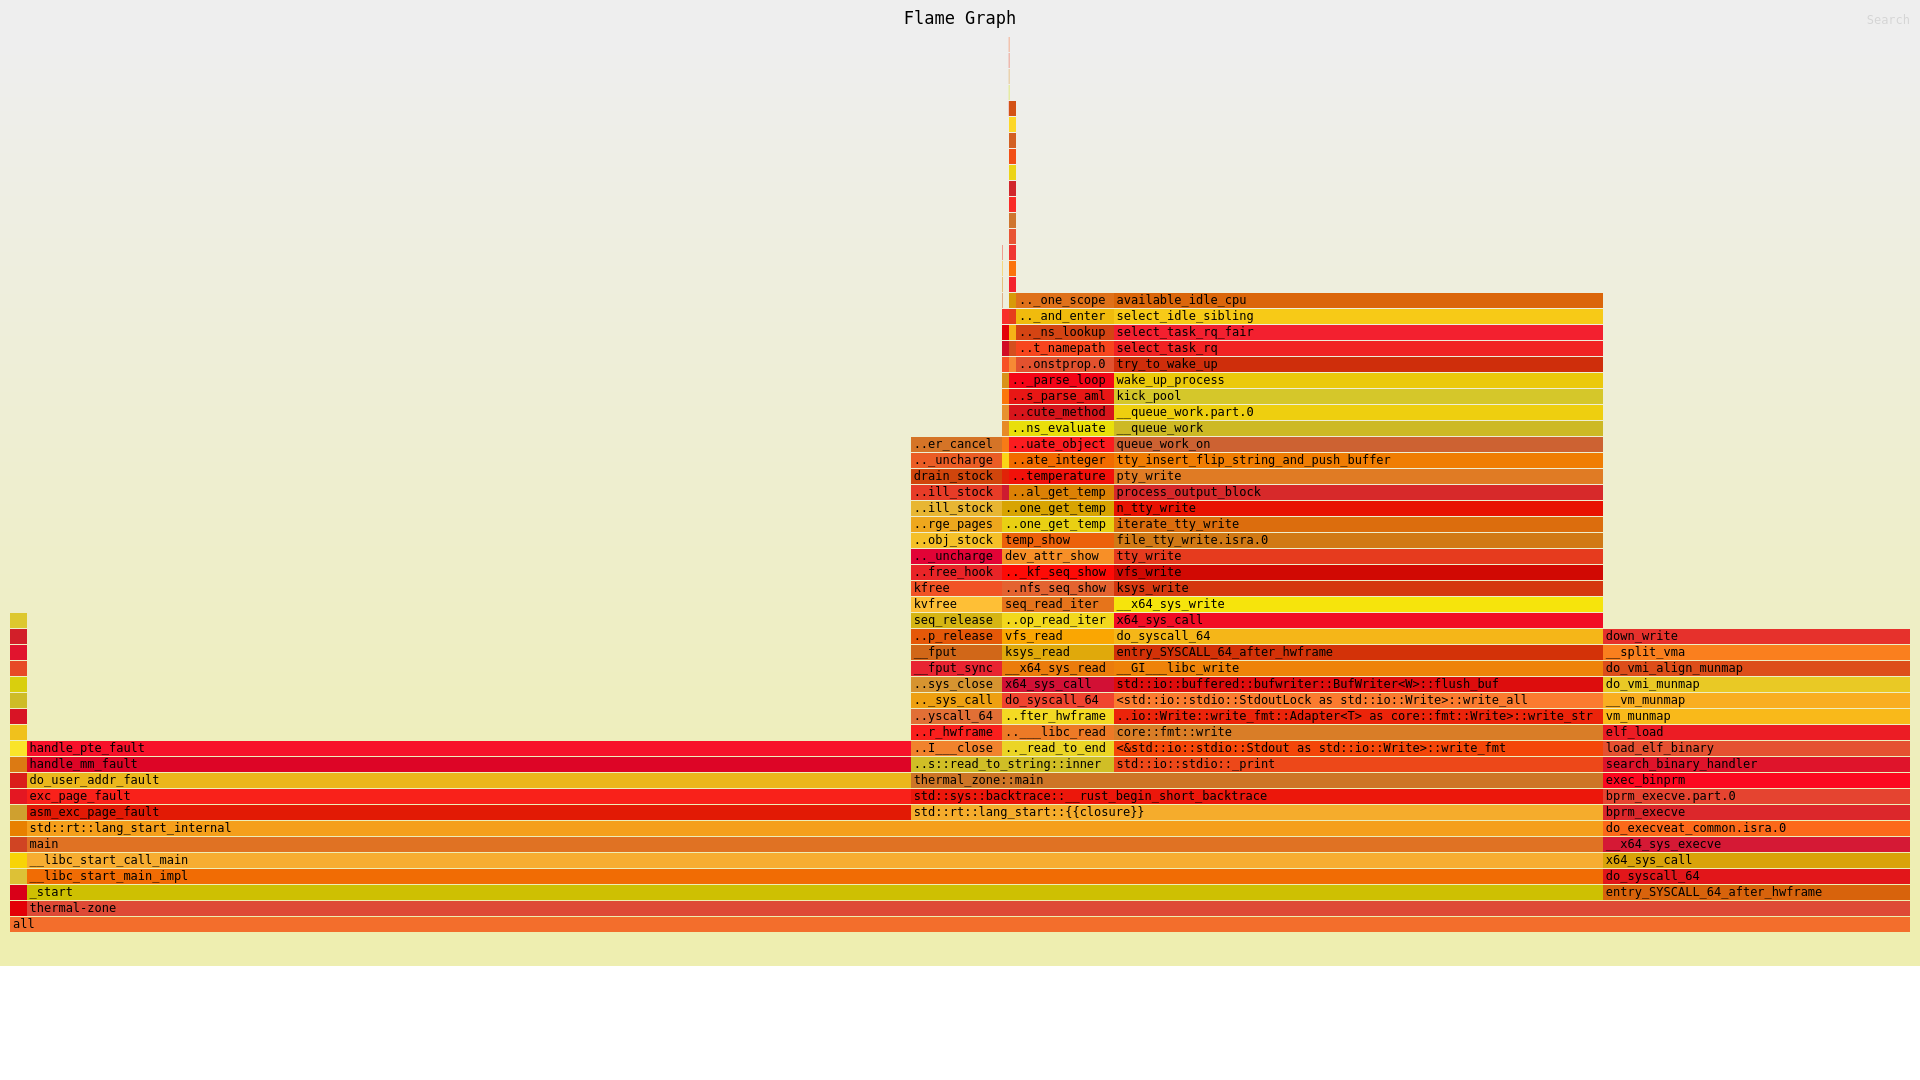
:terminal: I wanted to try 🔥 📈 flamegraph (perf) today, so I wrote a quick program to iterate over some "stuff" ™️ .
Then I wanted to see some function calls so I added more functionality.
Then I duplicated it to iterate over some other "stuff" ™️ .
Then I added some nice things to alter the output.
Then i thought, "ah I'll snap it".
⏲️ A 5 minute test turned into a few hours and now I have two nice programs which I've wanted for a while, and a Snap.
I do it to myself 🙄
🌐 Perf: https://github.com/torvalds/linux/blob/master/tools/perf
🌐 https://perfwiki.github.io/main/
🌐Flamegraph: https://github.com/flamegraph-rs/flamegraph?tab=readme-ov-file#flamegraphs-are-the-beginning-not-the-end
#Flamegraph #Perf #Linux #Snapcraft #Snap #Experiment #Programming #Rust #RabbitHoles #Ubuntu

Inspecting flamegraphs is a pain - dealing with SVG files, opening a browser… ugh.
Not anymore!
🔎 **flamelens** — An interactive flamegraph viewer for the terminal.
🔥 Works with perf, py-spy and cargo-flamegraph.
🦀 Written in Rust & built with @ratatui_rs
⭐ GitHub: https://github.com/YS-L/flamelens
#rustlang #ratatui #tui #flamegraph #profiling #development #terminal #commandline
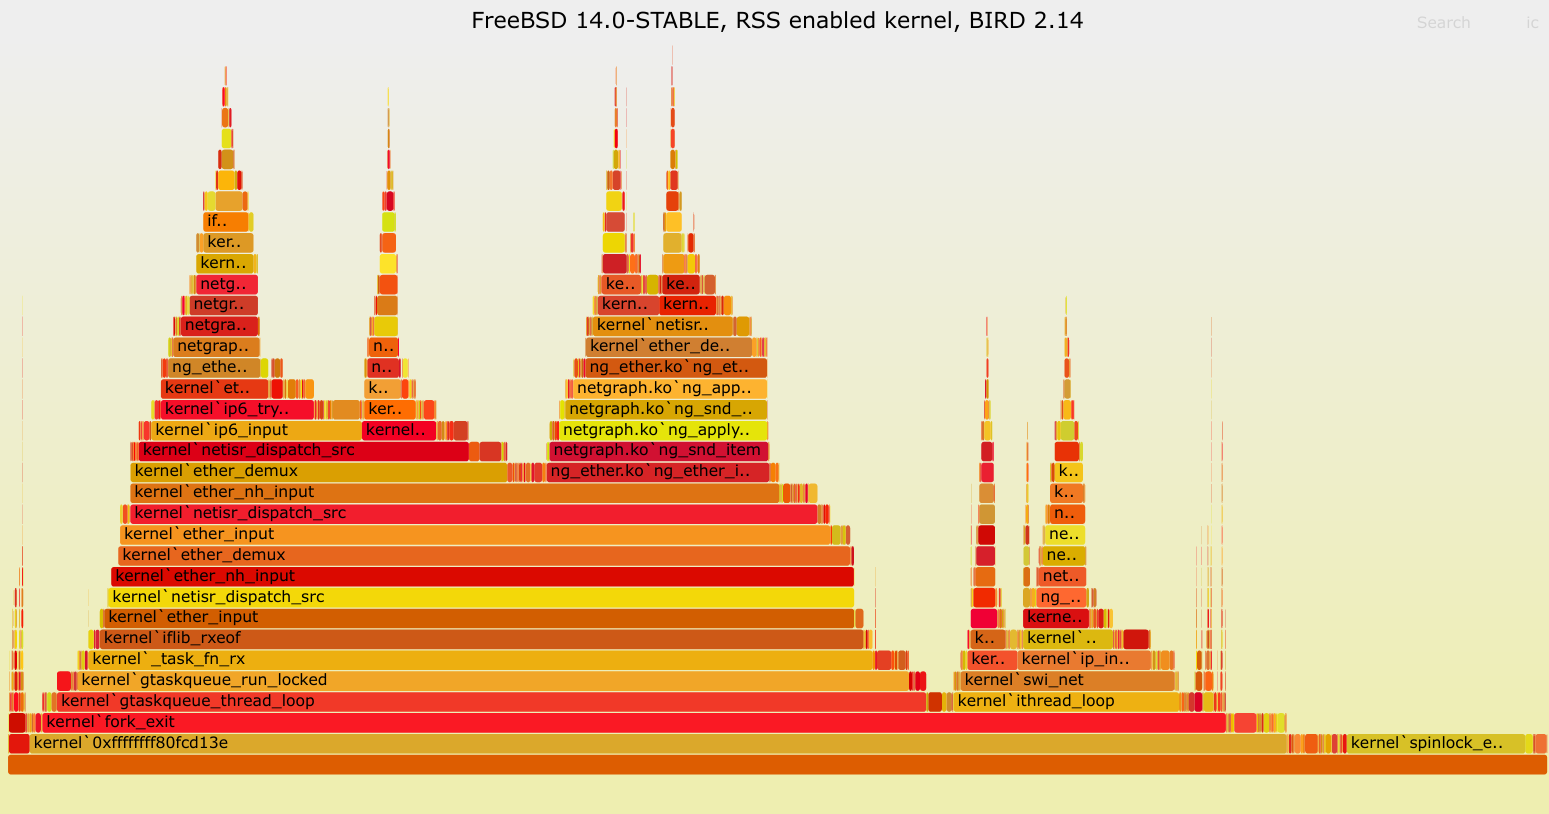
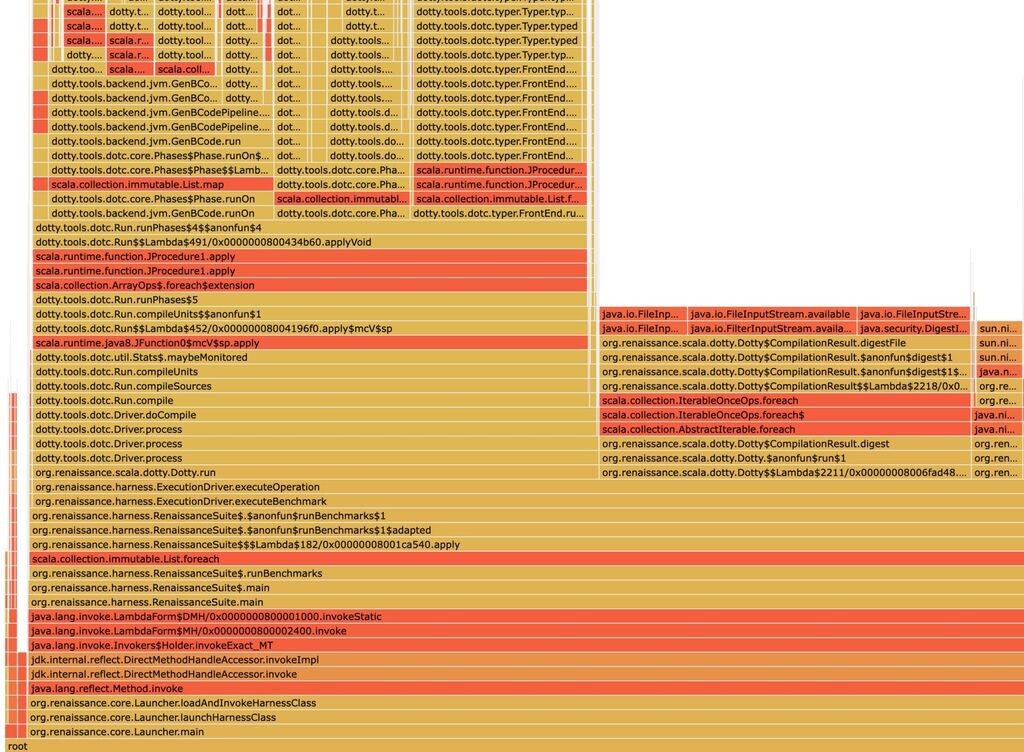
Deep dive into YugabyteDB's PostgreSQL compatibility and its design, my FOSDEM talk recording is online:
Reusing the PostgreSQL codebase in a Distributed SQL Architecture
#executionplan #callstack #flamegraph #opensourcecode #internaltracing
Perforator: новая система непрерывного профилирования теперь в опенсорсе
Привет! Сегодня мы выложили в опенсорс Perforator — систему непрерывного профилирования (continuous profiling), которую используем внутри Яндекса для анализа производительности большинства сервисов. В Github-репозитории доступен исходный код системы и инфраструктура для развёртывания своей инсталляции Perforator на кластере Kubernetes. Кроме того, Perforator можно использовать на своём компьютере как более простую замену perf record: профили получаются точнее, а оверхед меньше. Исходный код доступен под лицензией MIT (и GPL для eBPF-программ) и запускается под x86-64 Linux. При помощи Perforator и прошлых подходов к задаче профилирования мы регулярно оптимизируем самые крупные сервисы в Яндексе, например Баннерную крутилку или Поиск, на десятки процентов. Кроме того, Perforator реализует недостающий в опенсорсе компонент профилирования для простой автоматической оптимизации программ с использованием profile-guided optimization. Наши тесты показывают, что использование PGO даёт ускорение около 10% в разных сценариях. Под катом поговорим про профилирование под Linux, опишем вызовы и сложности, возникающие при профилировании, изучим, как устроен Perforator внутри, и обсудим, как можно использовать полученную систему.
https://habr.com/ru/companies/yandex/articles/875070/
#профилирование #profiling #continuous_profiling #оптимизация #flamegraph #opensourse #опенсорс #опенсорс_яндекса
PyCharm 2024.3.2: uv Package Management Support and More!
#Python #Pycharm #Releases #Flamegraph #Pypi #Uv
https://blog.jetbrains.com/pycharm/2025/01/pycharm-2024-3-2/
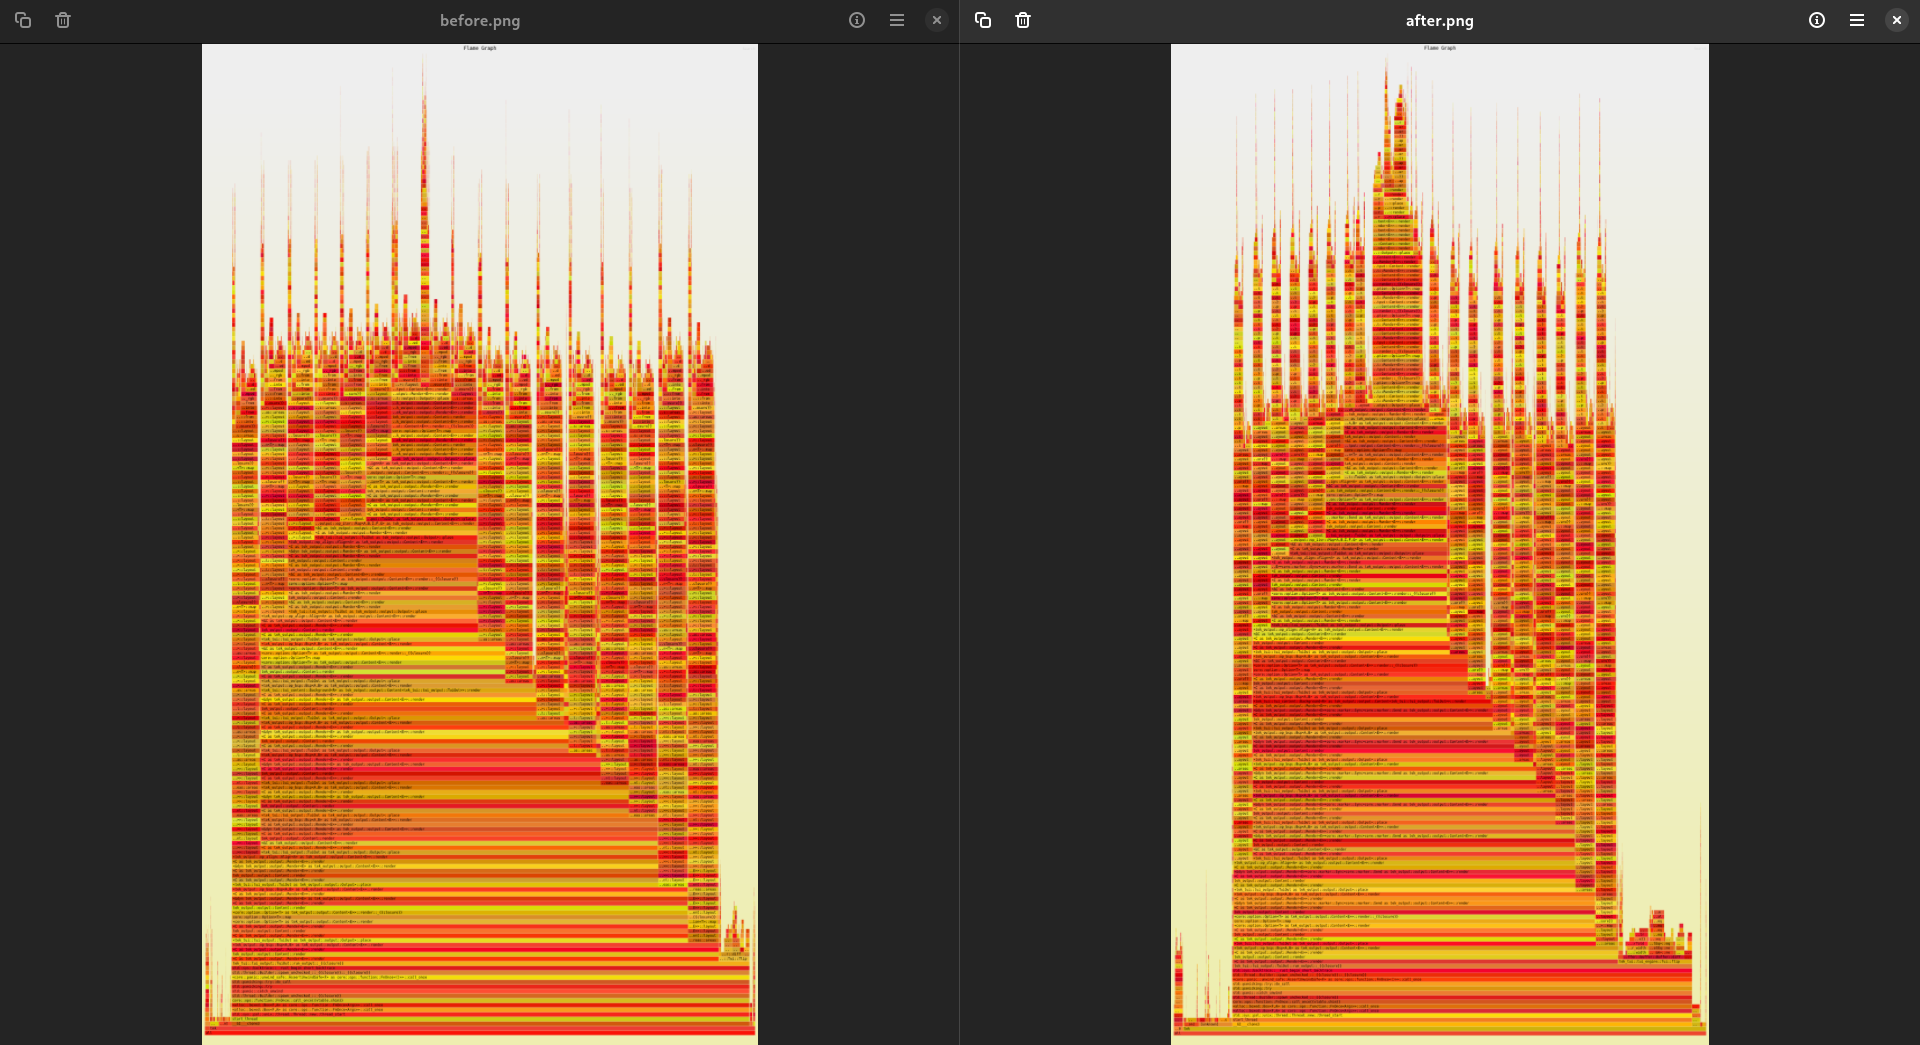
@slembcke hahaha dw. here's some more profiling screenshots. the biggest spike at the top, the one that looks thin in beforepic and quite thick in afterpic, well that's the one that didnt change at all, lol. everything around it was trimmed down imagine how much
the whole render loop was peppered with memory allocations, mainly from String cloning and `format!` invocations. moved all that to a tiny handful of preallocated buffers
anyway, a thing that this #dsl is: slow! on every frame it recompiles the layout. granted, the layout is simple. still it should be possible to compile it all to a thunk, and only recompile on edit...
that's the "editable ui" saga, anyway. and i'm not sure at all whether the dsl is the bottleneck, but once i add like 40 tracks and 40 scenes the rendering drops to <10FPS
so, #cargoflamegraph it is... #perf #profiler #flamegraph
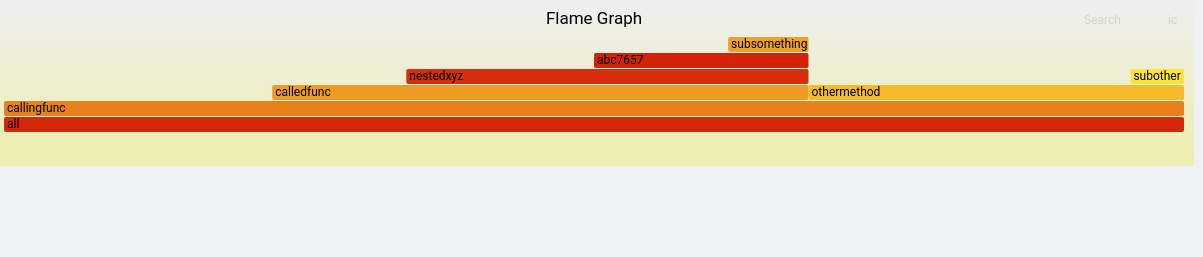
Experimenting with some flamegraph stuff!
Goal was to understand the format for the input files for future ports to other environments...
Что не так с cProfile в Python
Некоторое время назад с коллегой обсуждали вопрос профилирования программ на Python. Он сказал, что использует gprof2dot для пост‑обработки данных cProfile , в ответ я высказал мысль, о том, что было бы хорошо использовать более современные средства профилирования. И задумался, а можно ли какие‑то из существующих инструментов приспособить для работы с данными в формате pstat , но которые более удобные и дают больше возможностей для анализа.
https://habr.com/ru/articles/871318/
#python #cProfile #performance #flamegraph #treemap #профайлер
Профилирование: сравниваем инструменты pt-pmp и perf на реальных примерах
Привет, Хабр! В предыдущей статье был разобран первичный анализ работы приложения, какие инструменты стоит использовать для сбора информации и как с этими инструментами работать. Напомню, что речь шла о двух утилитах: poor man's profile (pt‑pmp), которая позволяет комплексно оценивать работу приложения, отображая off-cpu и on-cpu части; и perf , которая обладает высокой точностью и мощной функциональностью в целом. Оба этих инструмента применяются для анализа производительности, так как их комбинация позволяет целиком и со всех сторон осмотреть «пациента». Однако есть один пункт, который не был раскрыт в прошлой части: использование этих инструментов на настоящих продуктах. Синтетический пример на базе open‑source‑проекта — это хорошо, но будет не лишним показать, какие реальные проблемы были найдены, исправлены и какой прирост производительности удалось в итоге получить. В этой статье мы поговорим о практическом применении pt-pmp и perf , с помощью которых удалось обнаружить места для оптимизации работы программы. Меня по‑прежнему зовут Александр Слепнев, устраивайтесь поудобнее, начинаем!
https://habr.com/ru/companies/pt/articles/851394/
#perf #ptpmp #профилирование #производительность #flamegraph #cybersecurity #max_patrol #siem #оптимизация_программ
Working with a lot of analytical data on ClickHouse?
I've found the perfect tool for you! 💯
🔍 **chdig**: Dig into @clickhousedb with a TUI interface.
🔥 Supports flamegraphs and clusters with a top-like interface.
🦀 Written in Rust & built with @ratatui_rs
⭐ GitHub: https://github.com/azat/chdig
#rustlang #ratatui #tui #clickhouse #analytics #flamegraph #terminal #commandline
Here is how you can add CPU profiling to your Rust project! 🦀
⏱️ **pprof**: A Rust CPU profiler — supports generating flame graphs! 🔥
📚 Docs: https://docs.rs/pprof
⛰️ Example implementation from @git_cliff → https://github.com/orhun/git-cliff/pull/768
⭐ GitHub: https://github.com/tikv/pprof-rs
#rustlang #profiler #flamegraph #stats #cpu #library #performance
To generate Instruments traces for Rust programs, I highly recommend the excellent cargo-instruments tool https://github.com/cmyr/cargo-instruments
Next up: A Tale of Two Flamegraphs by Ryan Perry, Grafana Labs.
Our goal is to lower the barrier to performance profiling. The WikimediaDebug browser extension for Firefox and Chromium, can now profile the backend MediaWiki PHP process, and turn it into an interactive flamegraph, powered by Excimer and Speedscope.
What are flamegraphs, when do you need it, and how does it work?
https://techblog.wikimedia.org/2023/06/08/flame-graphs-arrive-in-wikimediadebug/
#WebPerf #profiling #flamegraph #PerfMatters #PHP #MediaWiki #Excimer #Speedscope
Writing a Profiler in 240 lines of pure Java | Johannes Bechberger https://mostlynerdless.de/blog/2023/03/27/writing-a-profiler-in-240-lines-of-pure-java/
#Java #profiling #flamegraph
Perf engineering with Python 3.12
https://www.petermcconnell.com/posts/perf_eng_with_py12/
more #flamegraph and less #blamegraph
Client Info
Server: https://mastodon.social
Version: 2025.04
Repository: https://github.com/cyevgeniy/lmst