#copernicuseu

@theurgia_goetia Via Copernicus EU

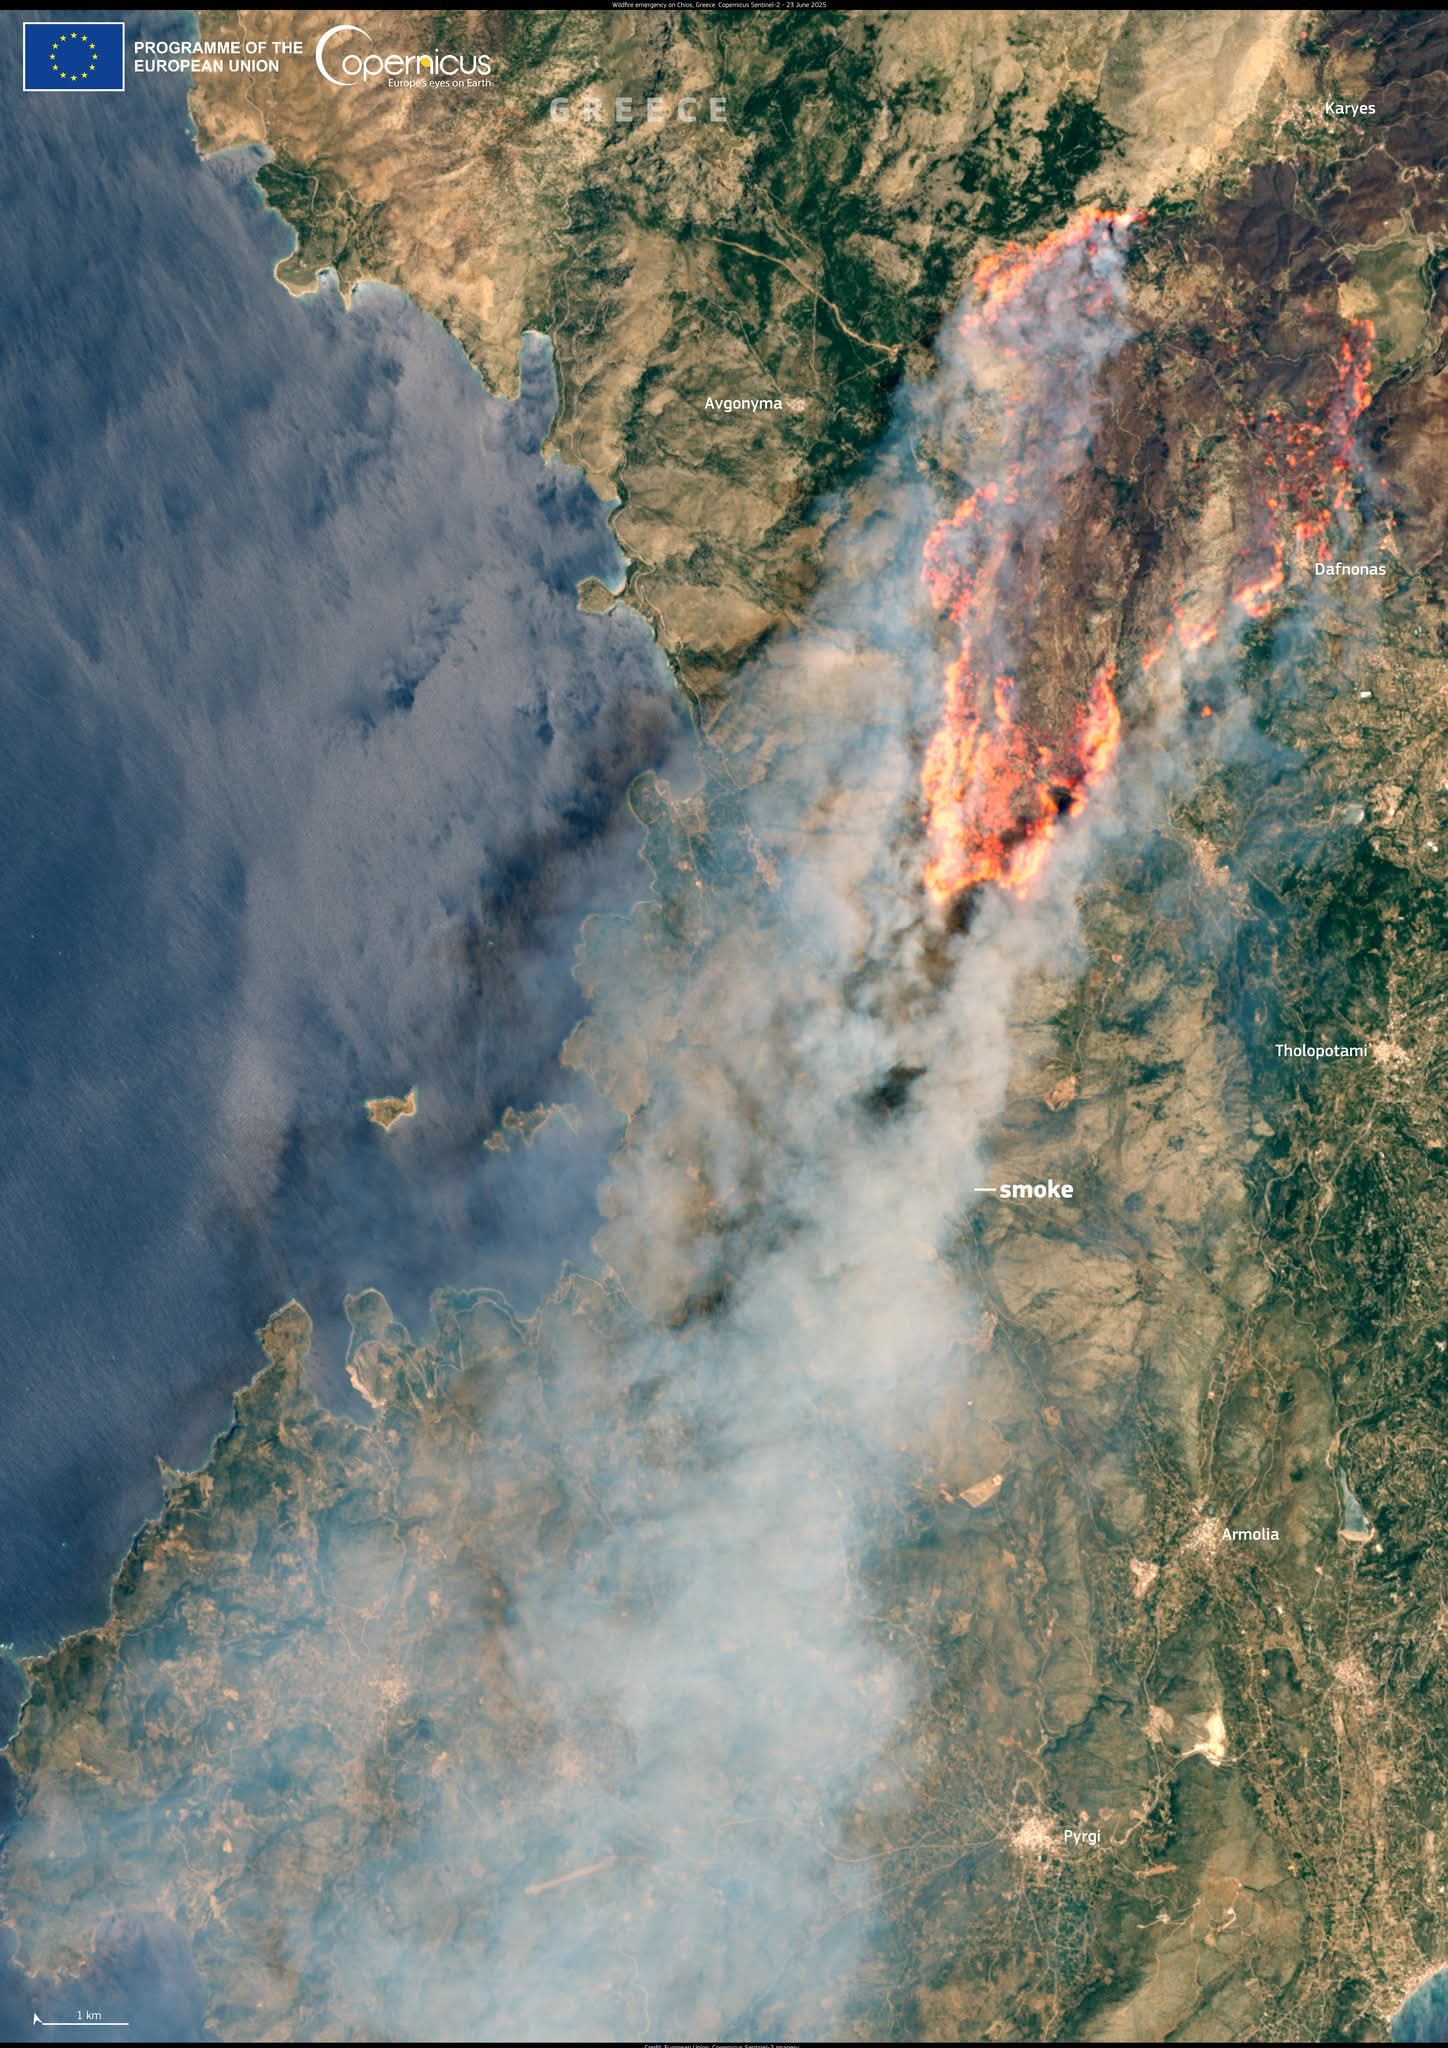
🔥 Le 22 juin, des incendies intensifs ont éclaté sur l'île grecque de Chios, incitant le gouvernement à déclarer l'état d'urgence.

Plusieurs villages ont été ordonnés d'évacuer alors que des centaines de pompiers travaillaient à contenir la flamme. Les incendies ont causé des perturbations importantes, notamment des pannes de courant, des pénuries d'eau et des dommages aux biens.

🛰 Copernic #Sentinel2 l'image, acquise le 23 juin, montre un panache de fumée dense qui monte de l'île et dérive vers le sud-ouest à travers la mer Égée.

Les données ouvertes fournies par #CopernicusEU Les satellites sentinelles sont essentiels à la surveillance et à la cartographie de l ' étendue et des effets des feux de forêt dans le monde, à l ' information des évaluations des dommages et à l ' appui des opérations de gestion des urgences.

#ImageOfTheDay

Via Copernicus EU

🔥 Intense wildfires broke out on the Greek island of Chios on 22 June, prompting the government to declare a state of emergency.

Several villages were ordered to evacuate as hundreds of firefighters worked to contain the blaze. The fires have caused significant disruption, including power outages, water shortages, and damage to property.

🛰 This Copernicus #Sentinel2 image, acquired on 23 June, shows a dense smoke plume rising from the island and drifting south-west across the Aegean Sea.

The open data provided by the #CopernicusEU Sentinel satellites is key to monitoring and mapping the extent and effects of wildfires around the world, informing damage assessments and supporting emergency management operations.

#ImageOfTheDay

2025-05-27
HR; Kvarner Bucht, Insel Krk
2025-05-05

🔁 Copernicus EU (@CopernicusEU)

Warmer 🌡️ and low 🌧️ since early 2025 are worsening drought conditions across Europe.
New @CopernicusEMS report highlights decreased river flows and rising drought impacts on agriculture, energy, transport & ecosystems.
🔗 copernicus.eu/en/media/image-d
#ImageOfTheDay #CopernicusEU

🐦🔗 twitter.com/CopernicusEU/statu
🕐 05/05 12:30

2025-04-28

Discover more about the contrasts in climate conditions revealed by #ESOTC2024 in the latest Copernicus OBSERVER article published by #copernicuseu Get insight into warmest year on record, including data on heatwaves, flooding, glacier melt and more. #C3S
copernicus.eu/it/node/84926

Nadvorienadvorie
2025-04-09

Карта от C3S показывает аномалию общего количества осадков в Европе за март месяц 2025.

Жуткое дело (300%): большая часть юго-западной Европы пострадала от осадков выше нормы, особенно Иберийский полуостров. В этом регионе произошли широкомасштабные наводнения.

С другой стороны, в Великобритании, Ирландии и части Центральной Европы, расширяющейся на юг к Чёрному морю, Греции и Турции, месяц был суше среднего.

.

2025-02-27

🔥 In 2024, parts of South America experienced historic wildfire emissions. An OBSERVER article by #CopernicusEU details #CopernicusAtmosphere monitoring of fire intensity, smoke plumes and #airquality impacts.

copernicus.eu/en/news/news/obs

2025-02-11

#FYI #Copernicus #CopernicusEU #ECMWF Update

Monthly global temperature anomalies 1.2023-1.2025
"January 2025 was the 18th month in a 19-month period in which the global-average temperature was more than 1.5°C above pre-industrial level."

climate.copernicus.eu/surface-

/edit: correction table values in AltText

#climate #ClimateScience #climatechange #ClimateEmergency #ClimateCrisis #ClimateBreakdown #climatecatastrophe #globalWarming #globalHeating #ExtremeWeather

Graph visualization
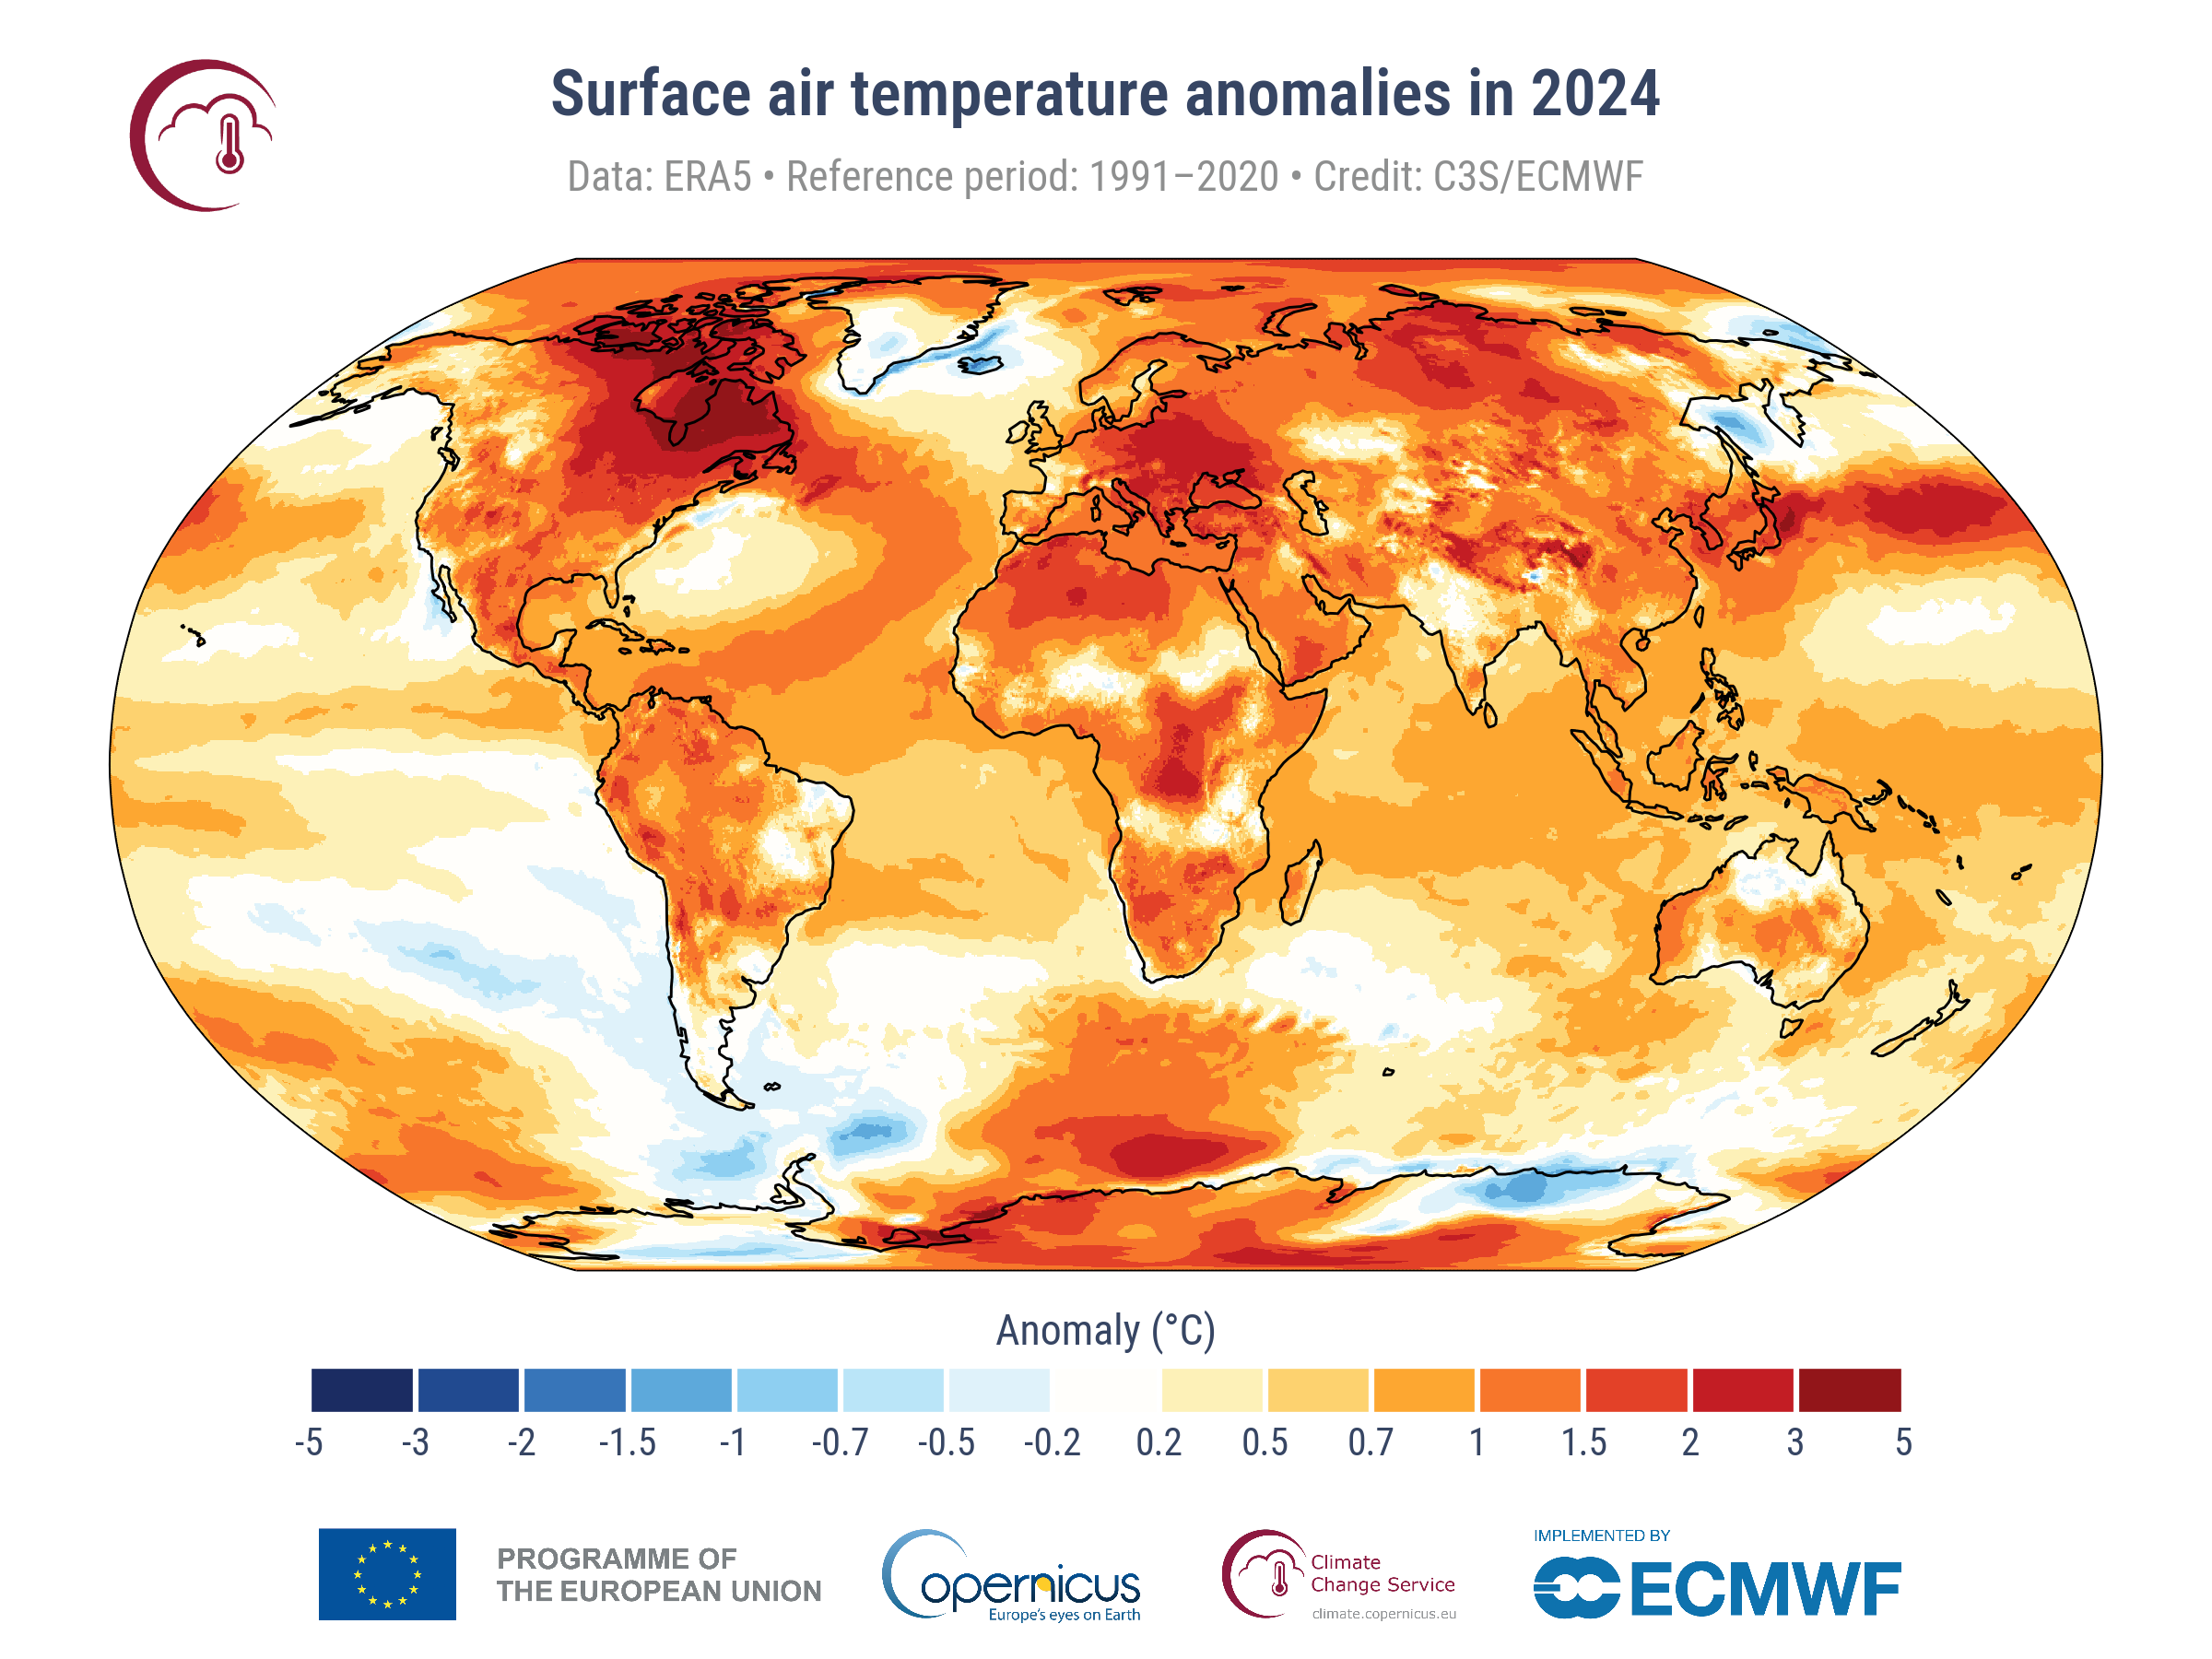
Headline: Monthly global temperature anomalies relative to pre-industrial (1850-1900) 
[remark by IviChoc: no, that's not really pre-industrial. Pre-industrial era ends at 1750 but well... Just keep in mind the anomalies are in reality higher]

x axis temperature from +1°C on the left towards 2°C on the right
y axis on the left side: time, beginning with Jan. 2023 on top, descending to Jan. 2025
Temperature anomaly in depicted as red line starting at the y axis, ending in a red dot at actual value. Values above 1.5°C are printed bold

2023
Jan 1.21°C
Feb 1.25°C
Mar 1.46°C
Apr 1.23°C
May 1.27°C
Jun 1.36°C
Jul 1.52°C
Aug 1.51°C
Sep 1.74°C
Oct 1.70°C
Nov 1.74°C
Dec 1.78°C

2024
Jan 1.66°C
Feb 1.77°C
Mar 1.68°C
Apr 158°C
May 1.52°C
Jun 1.50°C
Jul 1.48°C
Aug 1.51°C
Sep 1.54°C
Oct 1.65°C
Nov 1.62°C
Dec 1.69°C

2025
Jan 1.75°C


Data: ERA5 Credit C3S/ECMWF
Logos of EU, Copernicus, Climate Change Service and ECMWF
Why We Went Extinctwhy_we_went_extinct
2025-02-09

2024 is the first year to exceed 1.5°C above pre-industrial level.

climate.copernicus.eu/copernic

And we don't yet understand why. An active solar year, lower reflective particle emissions, volcanoes all don't explain the full rise in temperature.

(Dutch)
nos.nl/artikel/2551139-wereld-

Also we've emitted record levels of CO2 last year. Good that we are taking "swift and decisive action".

2025-02-09

#FYI #ImageOfTheDay #CopernicusEU

"The Copernicus Climate Change Service (C3S) has published its latest monthly Climate Bulletin, focused on key climate trends in January 2025.
..." continued in AltText

copernicus.eu/en/media/image-d

#climate #ClimateScience #climatechange #ClimateEmergency #ClimateCrisis #ClimateBreakdown #climatecatastrophe #globalWarming #globalHeating #ExtremeWeather

Graphic illustration of a globe showing Europe in the middle. Mid to eastern Europe is red (high temp) the rest of Europe orange to light orange. GB shifts to very light blue indicating colder temp. Contd. text from the original Copernicus post:
"The bulletin reports that January 2025 was the warmest January on record globally, with an average surface air temperature of 13.23°C, which is 0.79°C higher than the average for the month between 1991 and 2020.
Furthermore, January 2025 reached 1.75°C above the pre-industrial level.
This data visualisation, based on C3S data, shows Europe, where the average temperature over land in January 2025 was 1.80°C, 2.51°C above the 1991 - 2020 average for the month.
Data from C3S is essential for monitoring trends in the global climate. These insights support decision - makers in creating and implementing climate strategies for the future."
2025-02-04
On 2 February 2025, residents in southern Italy were affected by a cloud of Saharan dust transported there by a cyclone originating in North Africa.
The dust was carried by strong gusts of wind to Sicily and Calabria, where the sky turned a yellowish hue.
The suspension of dust in the atmosphere can affect air quality, visibility, and respiratory health.
The following day, the dust was transported eastward into Greece.
Eugene Alvin Villar 🇵🇭seav@en.osm.town
2025-01-10

@CopernicusECMWF has released their Global Climate Highlights 2024 report which formally states that 2024 was indeed the hottest year on record and that the global average temperature was 1.6℃ above the pre-industrial level, the first time a single year breached the 1.5℃ threshold since records began.

climate.copernicus.eu/global-c

#CopernicusClimate #CopernicusEU #ClimateChange #ClimateCrisis

World map showing the surface air temperature anomalies in 2024 based on ERA5 data and with 1991–2020 as the reference period. Most land areas have seen between +1 to +5℃ temperature anomaly. Very few areas have negative anomalies, notably the Denmark Strait between Greenland and Iceland, the Sea of Okhotsk, sea areas between South America and Antarctica, and a coastal portion of East Antarctica.
2024-11-19

Do you know about respublicae.eu/@CopernicusEU ? It describes itself as a unofficial mirror of the official EU site and shows 2.78K followers yet I've tried in vain to follow it over several days from climatejustice.social, trying to make the connection from both my home page here and the "follow" link on the target site. Always an error. Is this likely to be cookie-related? I'm minimalist about what I allow. Or is it a scam site? Never seen a boosted post from them on my timeline and links there always open in a new tab, not in the mastodon deck page I'm using.

Alternatively anyone following actual
#Copernicus
#CopernicusEU
#follow
#FediHelp

2024-10-10

アリアンスペースが欧州委員会とESAのためにSentinel1C衛星を打ち上げ、環境データ提供と欧州の宇宙へのアクセスを保証。Vega Cの復帰打ち上げを記念。打ち上げ日時は12月3日。
https://x.com/Arianespace/status/1844332967897989156

#VV25 #Arianespace #Sentinel1C #CopernicusEU #Europe #space

2024-09-12

先週のVega打ち上げ(VV24)の素晴らしい景色。CopernicusEUのSentinel2Cを搭載。打ち上げの音やスローモーション、複数のアングルで再生。1段目の分離も見れる。 #ESA #CopernicusEU #Sentinel2C
https://x.com/esa/status/1834151118143979710

2024-09-06

昨日のCopernicusEU Sentinel2Cロケットの打ち上げの写真が公開されました。ESAのロゴが写っている。 #ESA #CopernicusEU #Sentinel2C
https://x.com/esa/status/1831976030317531332

2024-09-05

CopernicusEUのSentinel2 C衛星がVegaロケットVV24で打ち上げられました。Sentinel2 AとBと共に、高解像度の画像を提供する連携を構築します。写真は美しい夜景で、ロケットの打ち上げ瞬間を捉えています。
https://x.com/esa/status/1831533841405591566

#CopernicusEU #Sentinel2 #Vegaロケット #VV24

2024-09-05

欧州宇宙基地からVV24号打ち上げを生中継。VegaロケットにCopernicusEU衛星-2Cが搭載。Arianespaceが運用。画像は打ち上げ準備の様子。 #EuropeSpacePort #VV24 #CopernicusEU #Vega #Arianespace
https://x.com/Arianespace/status/1831508841822888006

Client Info

Server: https://mastodon.social
Version: 2025.04
Repository: https://github.com/cyevgeniy/lmst