Global Mean Temperature GMT is just a way of keeping track of change, not a metric for actually useful information.
Our tech civilisation can break at GMT 1.5°C, and the reasons for impending collapse of complex fragile supply chains that our order depends on so fundamentally, won't be detected pondering GMT line charts.
Pondering the When & Where of weather extremes as modelled in IFS and ICON, will reveal impending civilisation collapse – if combined with knowledge of:
global supply chains, indispensable workforce, and locally applicable national and international politics wrt social and climate safety nets.
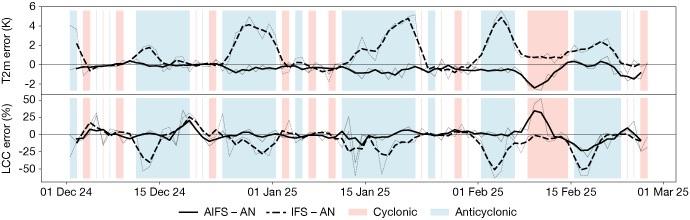
That's also why I find this comparison of model resolutions by Brunner et al so very, very useful. https://iopscience.iop.org/article/10.1088/1748-9326/ade1ef
I discovered similar while trying to find the <physically possible> max rain events in Europe 2020-2024. I crawled through all 50 ECMWF weather forecast members with their 360 hour steps.
But the all-time maxima didn't even come close to the 2020-2024 maxima in NOAA's weather station collection, let alone showing higher rain amounts than what hit the ground.
The TIGGE archive can be used for data download: https://apps.ecmwf.int/datasets/data/tigge/levtype=sfc/type=pf/?date_year_month=202307&origin-time=ecmf;12:00:00&number=1,2,3,4,5,6,7,8,9,10,11,12,13,14,15,16,17,18,19,20,21,22,23,24,25,26,27,28,29,30,31,32,33,34,35,36,37,38,39,40,41,42,43,44,45,46,47,48,49,50&step=294¶m=167
One problem was my 1x1°grid, interpolated during the data download from the original 0.5x0.5° grid = 57 km2.
(Interpolation means averaging neighbour grid cells.)
0.5x0.5° is too coarse, too. The paper uses models with a 9 km2 and 13 km2 grid!
Nah... Won't do it again on a 0.5x0.5° grid.
I might check whether TIGGE's other archived forecast models have a higher resolution than #ECMWF . And if they do, I'll test the member forecasts for Valencia, September 2024.
Or maybe also test against another event that wasn't due to a recurring phenomenon like the one in Spain. The Belgium and Germany flooding on July 14, 2021 for example.
IIRC, the serial TIGGE download & analysis took 5 weeks on 2 laptops, during which my main computer wasn't capable of much else.
I'd also need more SSD drives for higher resolution😵💫
Or, since I really simply want to map the maximum <physically possible> extreme, I could serial-process the highest resolution in smaller data chunks! 💡
I am still keen because I really think such a map of extremes, based on the physically possible would be very valuable information.
One example:
Potsdam's September 4th 2024 was the first September 4th with higher daily max temperature than in 1895. Meaning, the 1895 extreme was physically possible already in a non-angry weather.
That "perfect storm" only occurred once in 130 years before it happened again – and it wasn't a very threatening temperature (°C in September isn't threatening on Potsdam's latitude due to the sun's seasonal position in the sky).
But September 4, 2024 was not a "perfect Sept 4th storm".
What would the extreme have been like in "perfect conditions" – ie, with Exxon's CO2 applied?
Ah. Now that is a question I can find an answer to much quicker than the Tigge project.
I can just pull the all-time maximum from weather stations. Then do its weekly decadal average and subtract this from the newest weekly decadal average under Exxon's CO2 forcing.
Then add the difference to the all-time maximum, et voilà: the maximum physically possible in that location.
Nice. Will do!