#dPCR

Frédéric Rimetrimetfrederic
2025-07-18

Coming soon in @Mol_Ecol
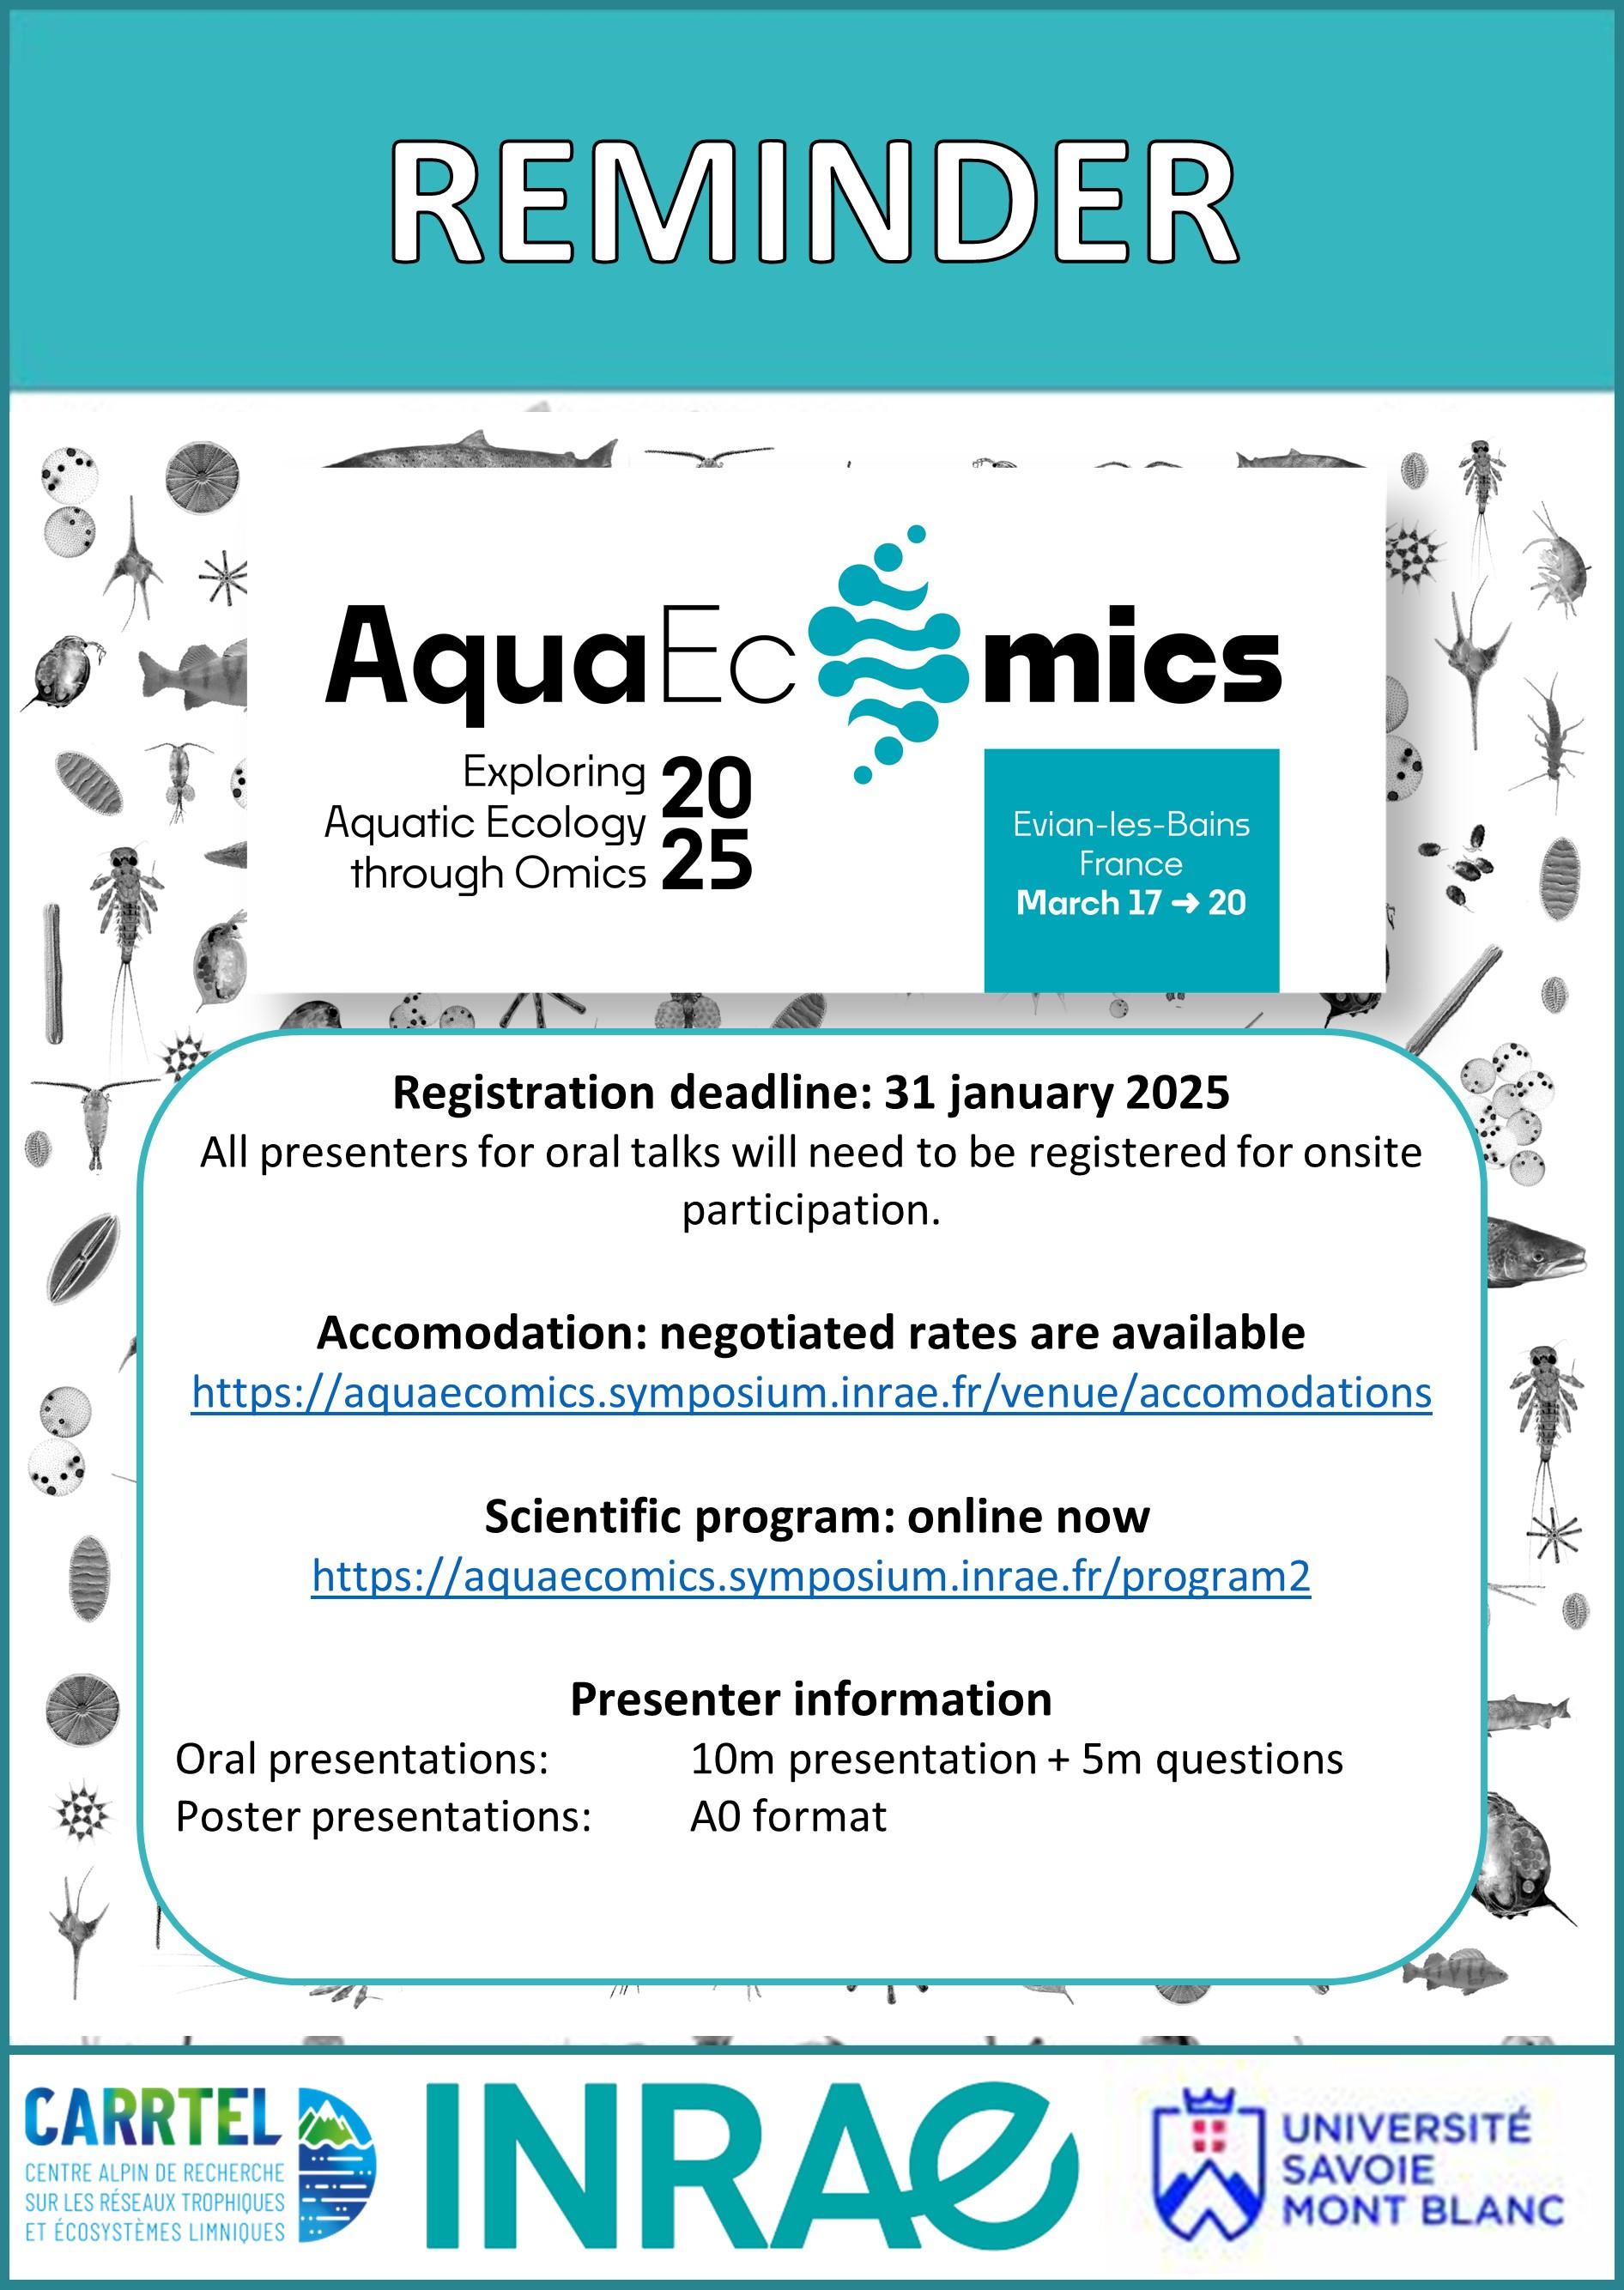
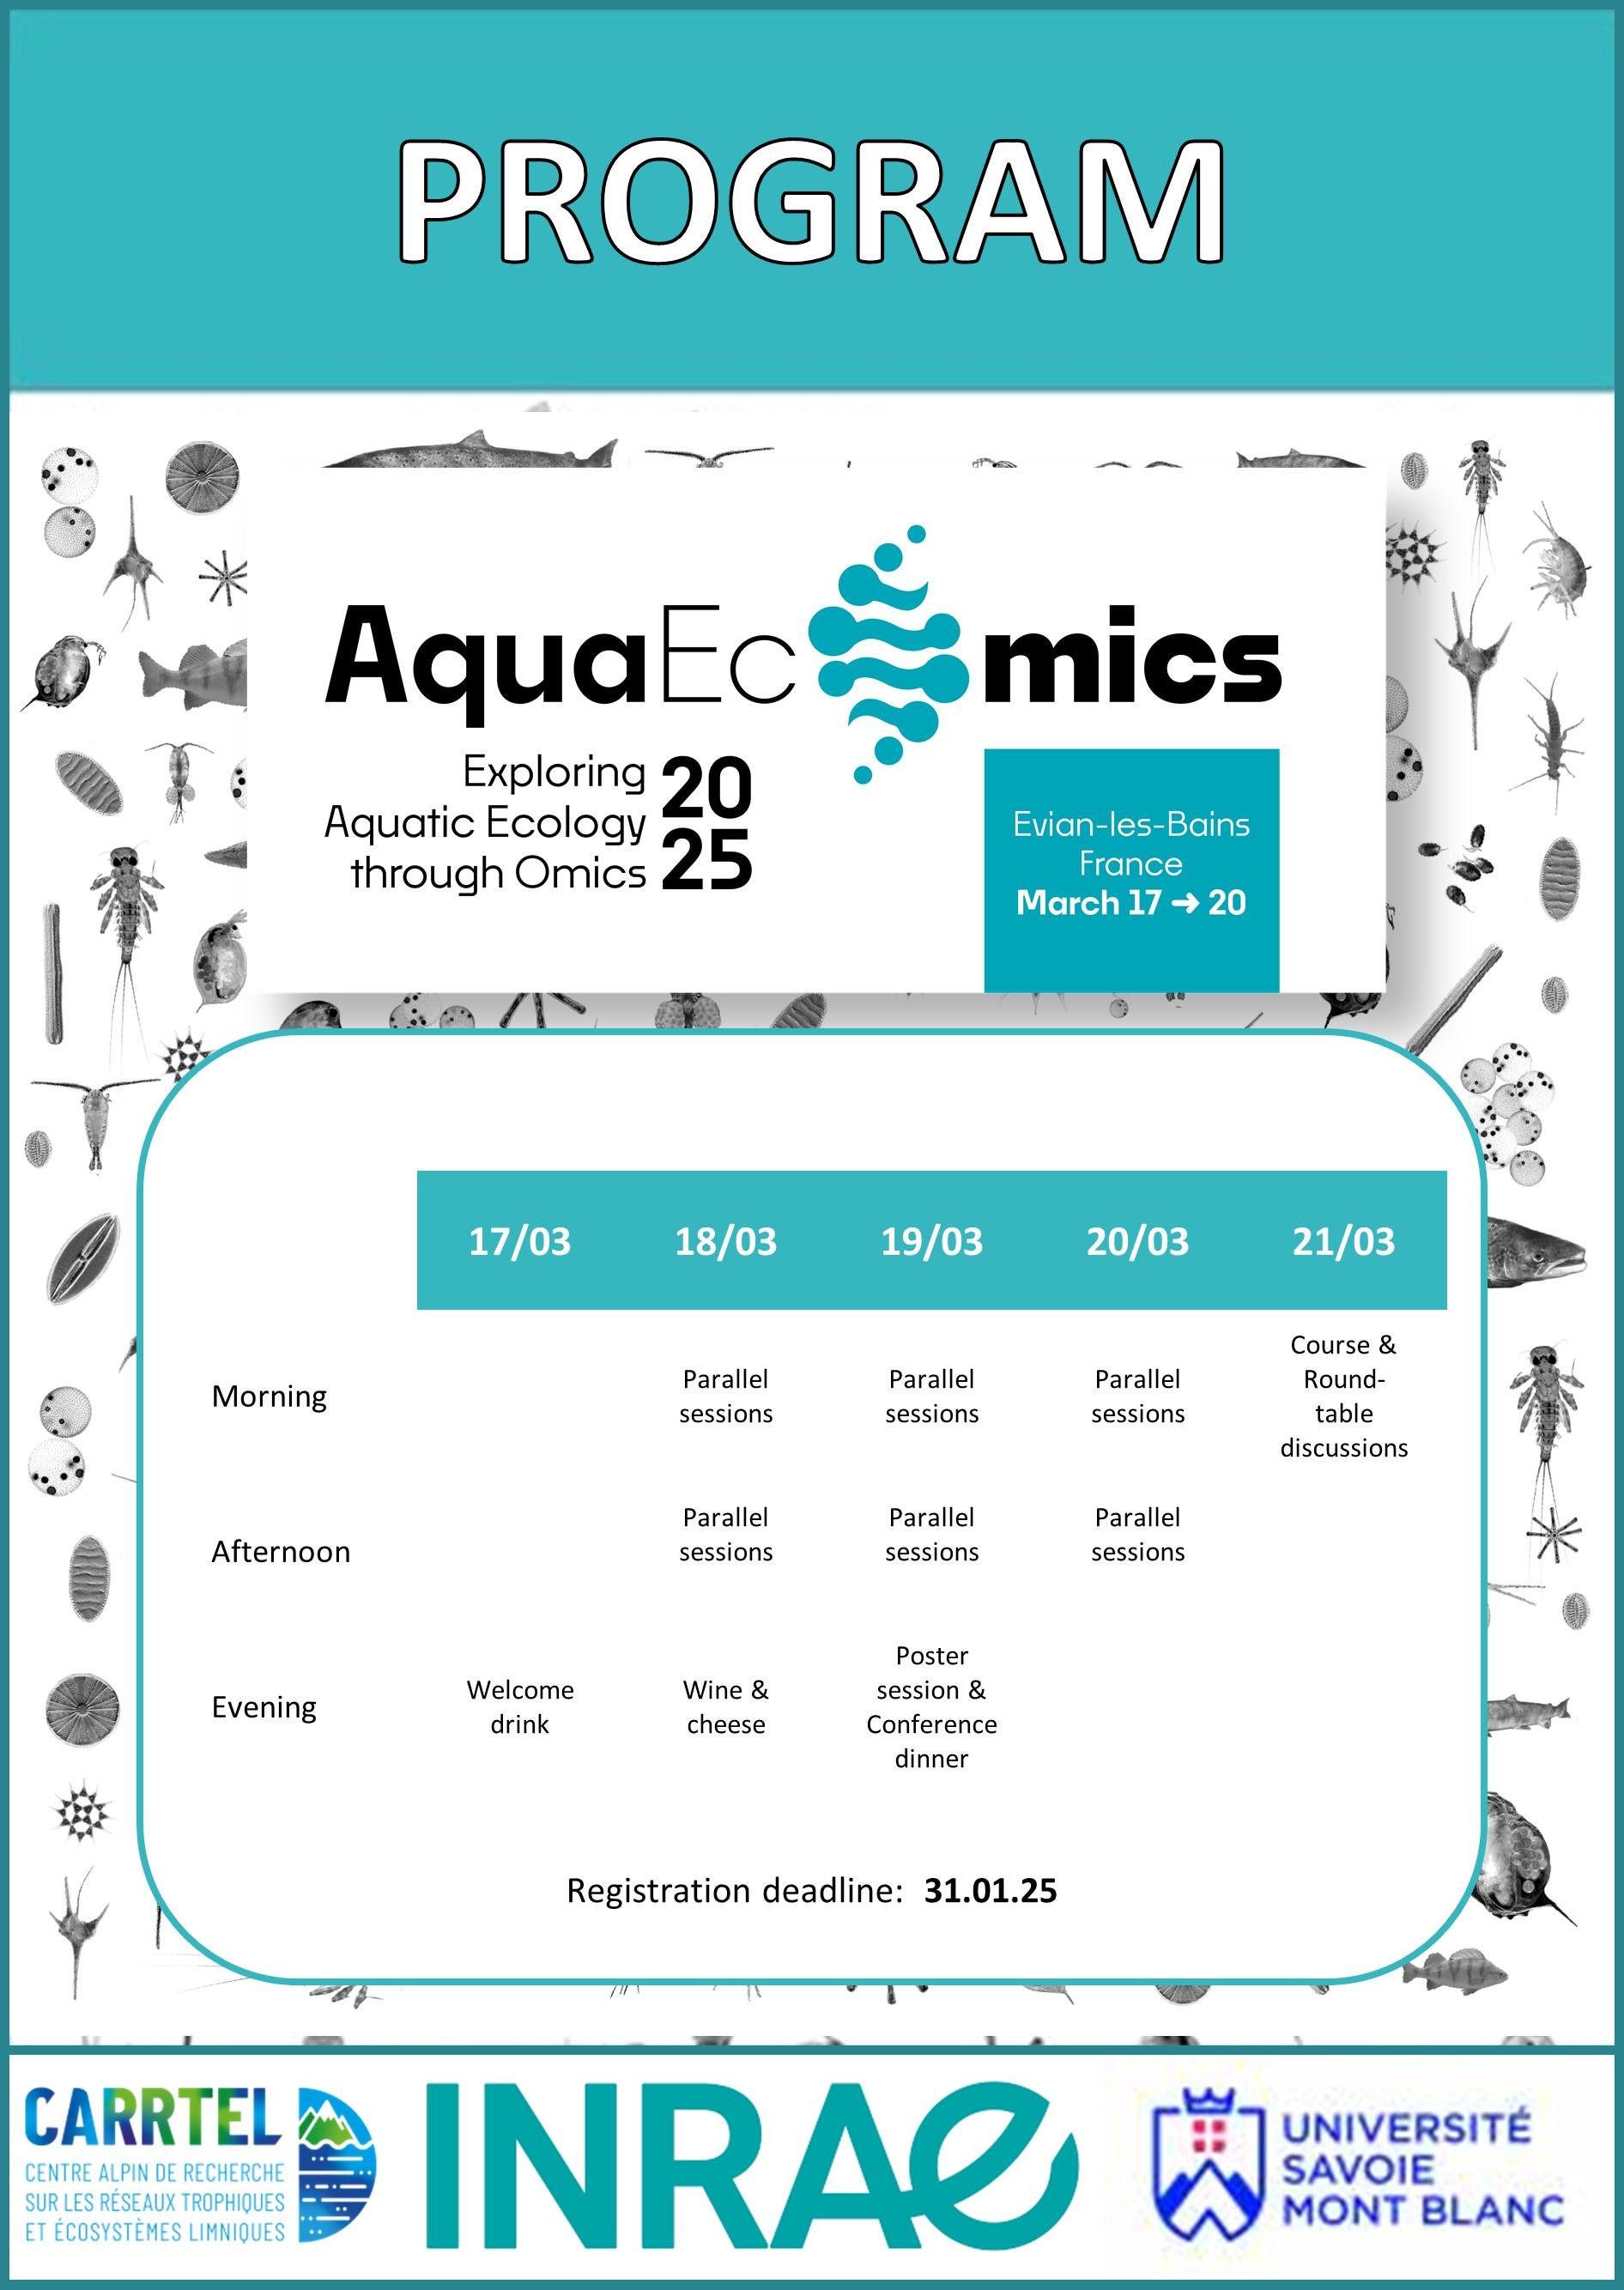
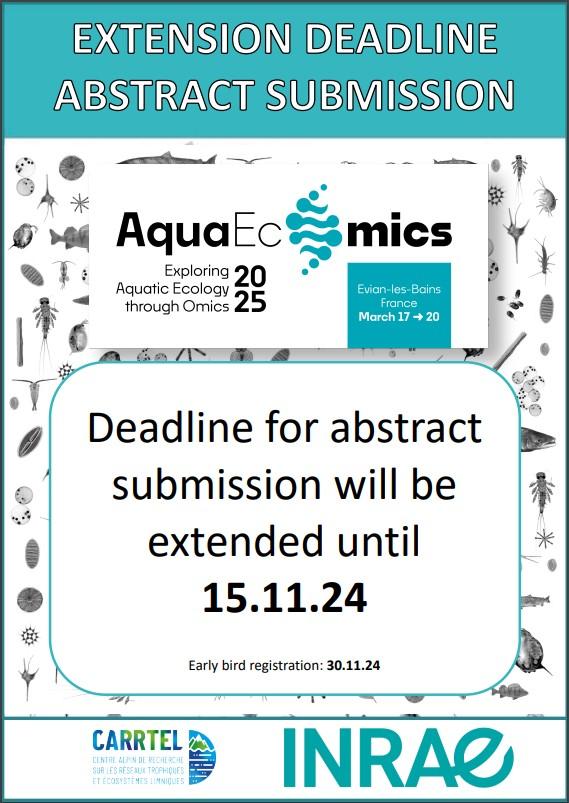
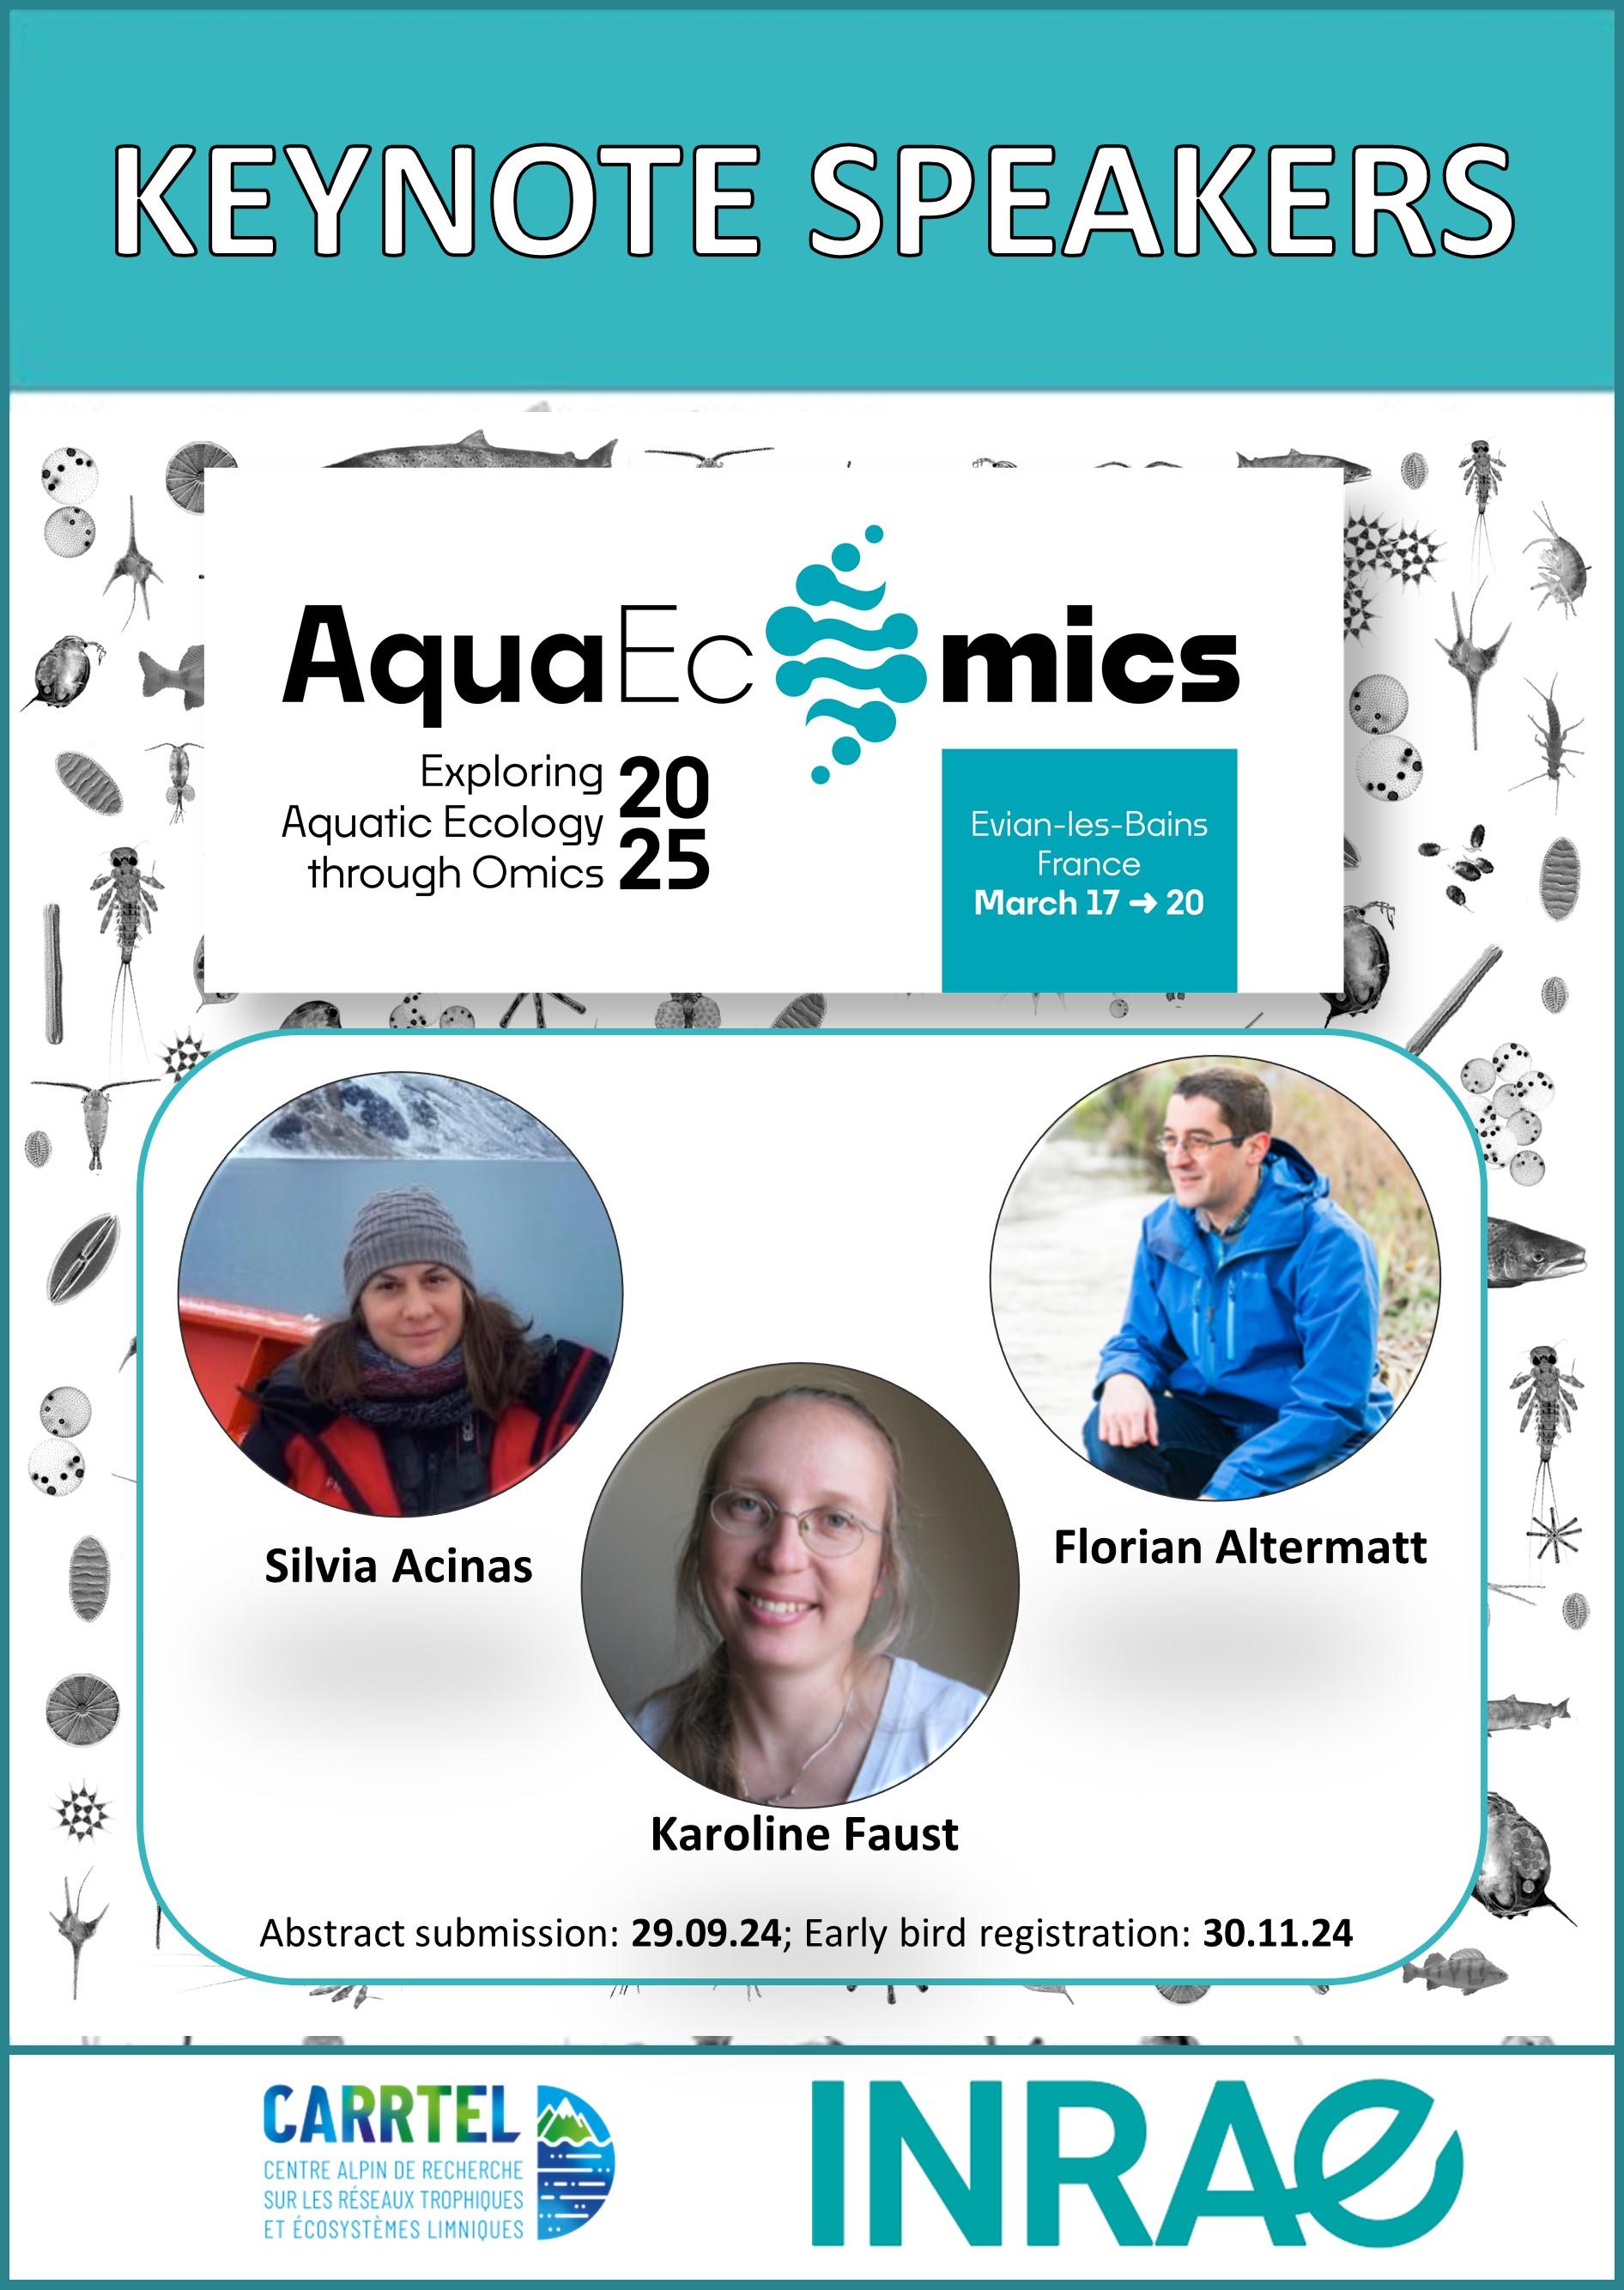
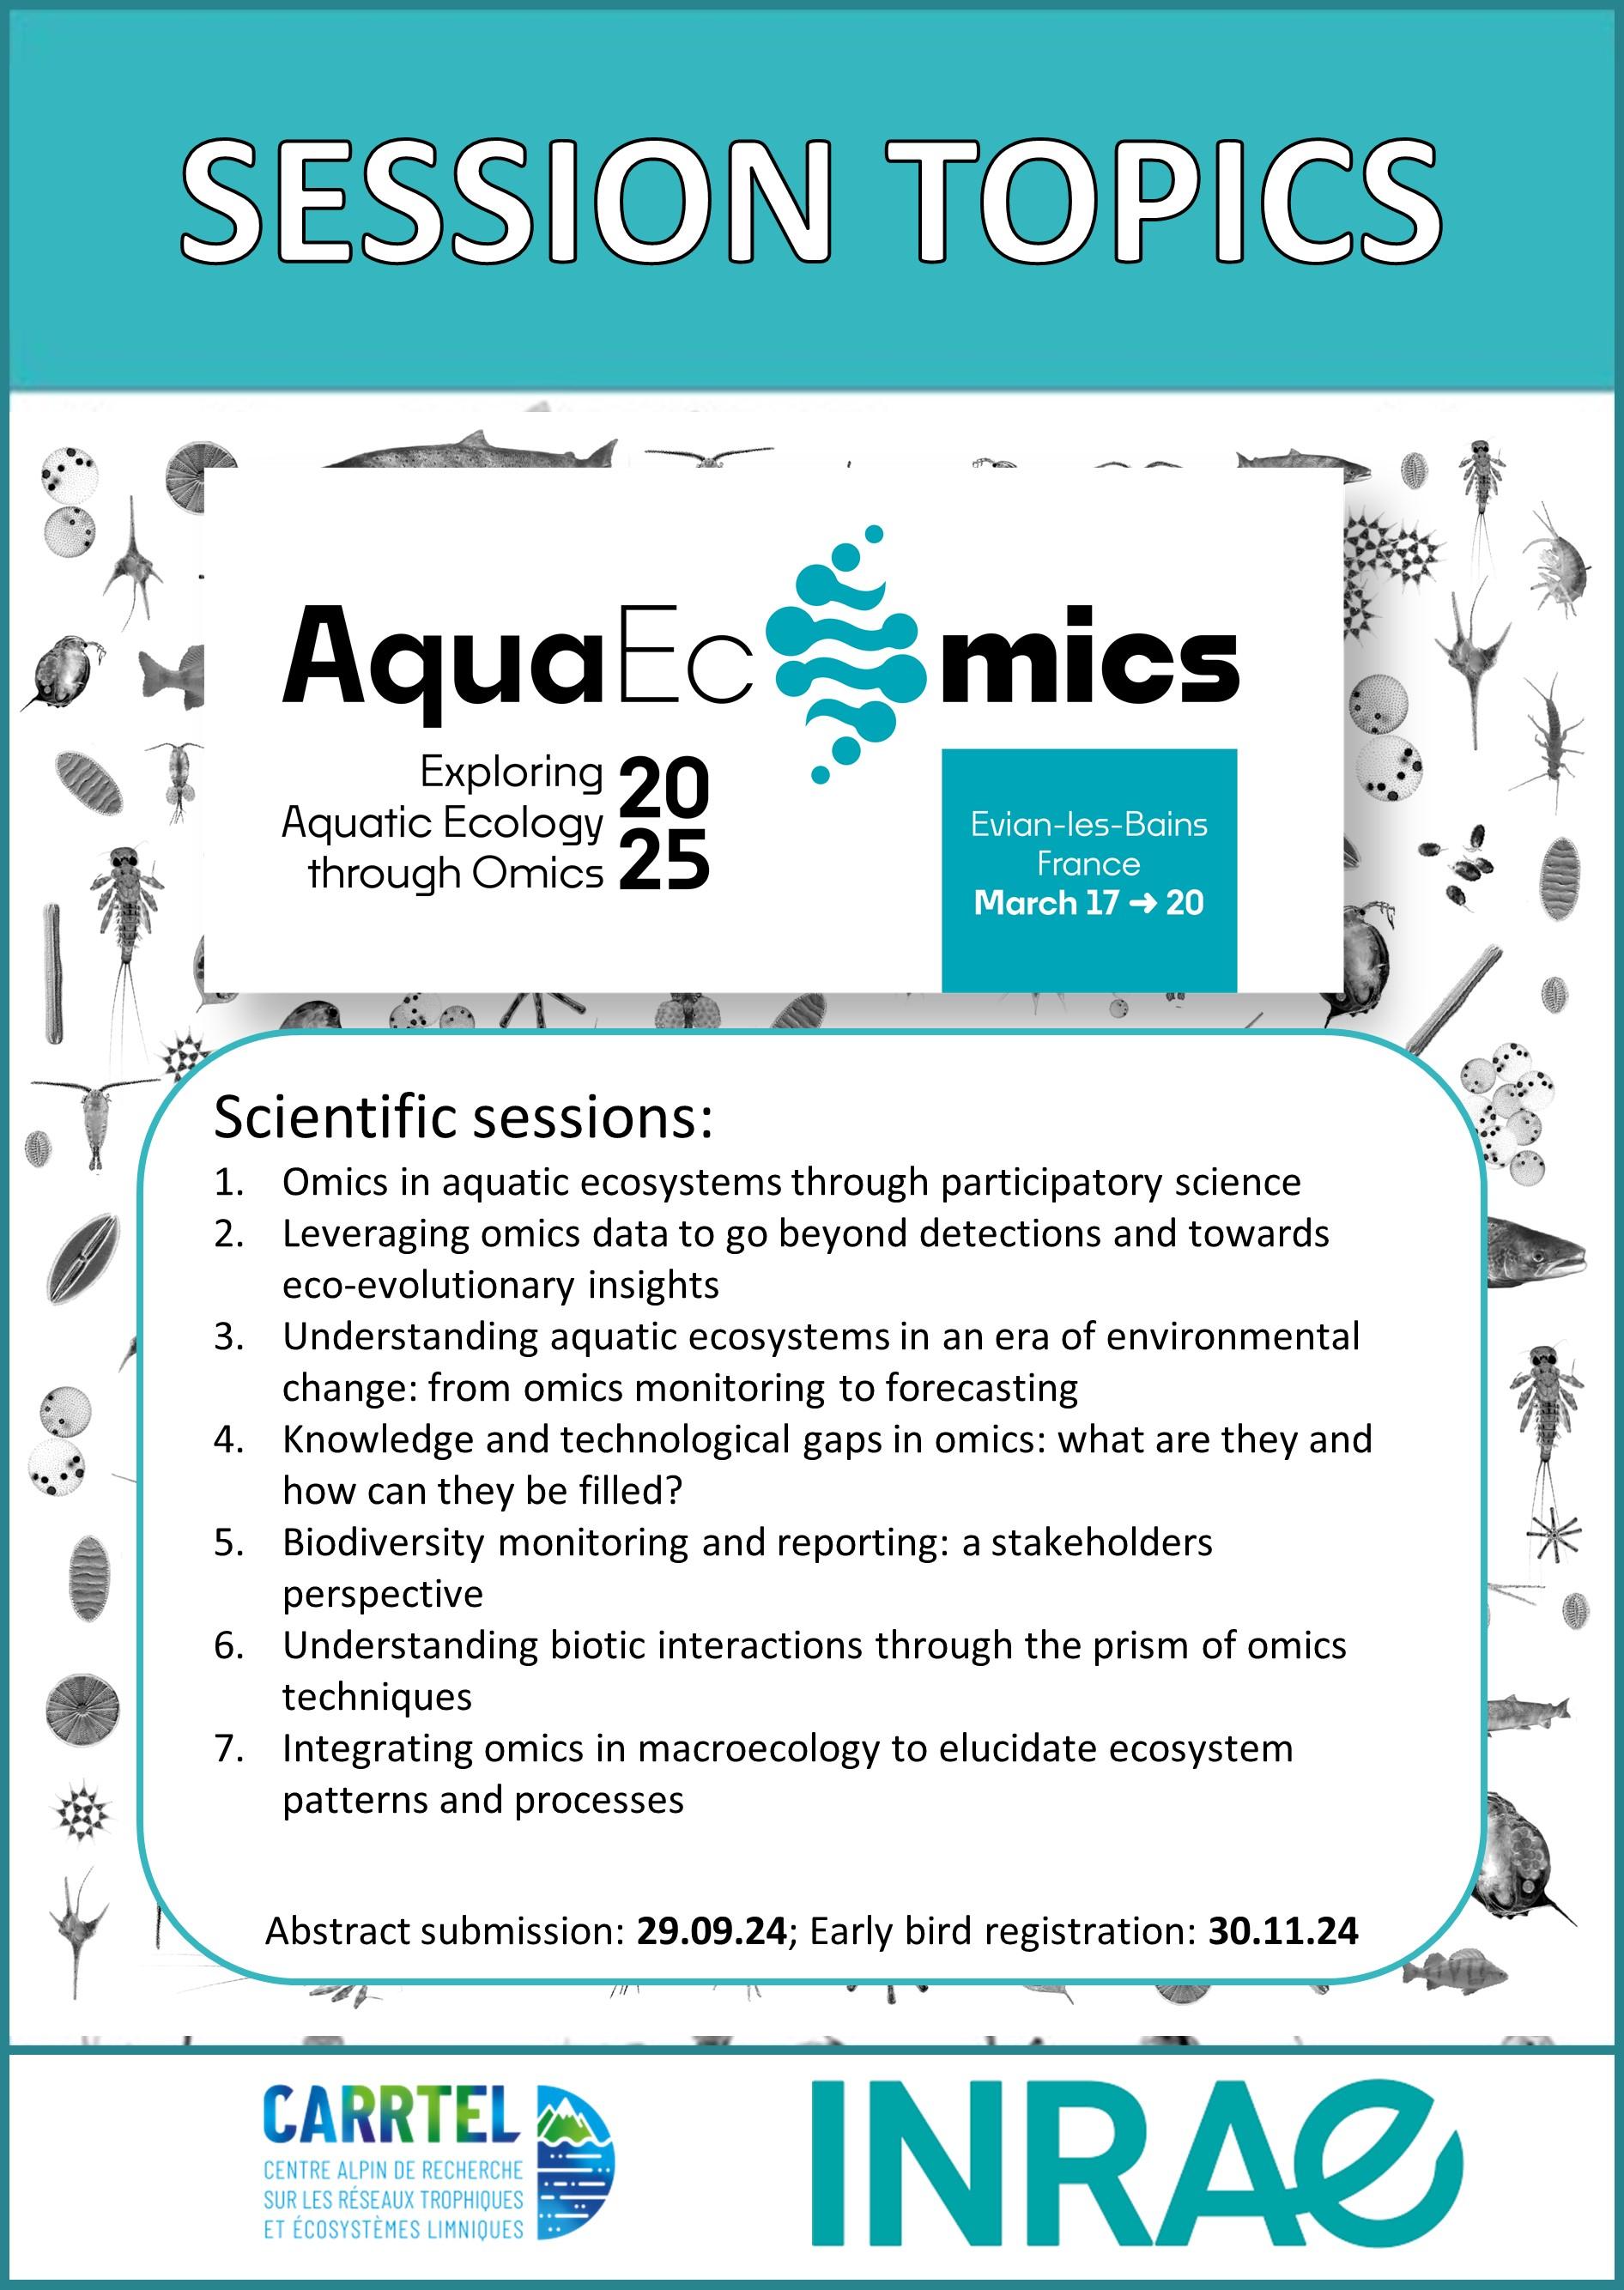
Omics to study and manage aquatic environments: a snapshot from the AquaEcOmics meeting (Evian-les-Bains, 2025)
F Rimet, C Lemonnier, B Alric, P Beja, L Bittner, J Bylemans, F Leese, R Logares, K Meissner, F Not, L Orsini, B Paix, N Rodríguez-Ezpeleta, R Siano, B Thalinger, N Tromas, V Vasselon, I Domaizon

Thanks to all co-authors! Great to work with you and to summarize this great meeting

devSJR :python: :rstats:devSJR@fosstodon.org
2025-06-21

Following #rstats packages were maintained and are back on #CRAN now thanks to Andrej Spiess

- #dpcR, 2025-06-18, Digital PCR Analysis <10.32614/CRAN.package.dpcR>
- #MBmca, 2025-06-11, Nucleic Acid Melting Curve Analysis (journal.r-project.org/articles)
- #qpcR, 2025-06-10, Modelling and Analysis of Real-Time PCR Data <doi10.1093/bioinformatics/btn227>
- #PCRedux, 2025-06-13, Quantitative #PCR (#qPCR) Data Mining and Machine Learning Toolkit as Described in <doi:10.21105/Joss.04407>

Description for Figure 1 from the publication "qpcR: an R package for sigmoidal model selection in quantitative real-time polymerase chain reaction analysis" (Figure 1: The qpcR package for sigmoidal model selection.)

Panel A: Console output from the qpcR package. This example shows a three-parameter log-logistic model fitted to qPCR data obtained from the amplification of the S27a transcript using human testicular RNA and a Lightcycler™ (Roche) instrument. The best-fitting model is selected by the 'mselect' function, which chooses the optimal model according to nested F-tests on the residual variance. In this case, the five-parameter model ('l5') is compared to the three- and four-parameter models.

Panel B: A fitted five-parameter log-logistic model ('l5') on single qPCR data. The graph displays various parameters from the model fitting process, including:

Model name
Residual variance
Efficiency curve (blue)
First derivative curve (red) and its maximum (threshold cycle)
Second derivative curve (green) and its maximum (threshold cycle)
The x-axis represents the number of cycles, and the y-axis on the left represents fluorescence intensity. The y-axis on the right represents efficiency.description for Figure 3 from the article "Surface Melting Curve Analysis with R":

Figure 3: Melting curve and melting peaks obtained from a Microarray Chip Analysis (MCA) experiment on microbead surfaces.

Top left inset: Illustration of two DNA detection probes hybridized to a complementary microbead-bound capture probe. The probes are labeled as Poly(dA)20 and Poly(dT)20.

Panel A: Melting curve showing the change in relative fluorescence intensity (relMFI) while applying a temperature gradient from 20°C to 95°C, increasing by 1°C per step. The red line represents the experimental data points, illustrating how the fluorescence changes with temperature.

Panel B: Melting peaks derived from the melting curve in Panel A. This probe system exhibits two distinct melting peaks:

The first (positive) peak occurs at approximately 60°C for Poly(dA)20.
The second (negative) peak occurs at approximately 75°C for Poly(dT)20.
The x-axis represents temperature in degrees Celsius (°C), and the y-axis represents the change in relative fluorescence intensity (dMFI/dT).description for Figure 29 from the study "PCRedux: A Quantitative PCR Machine Learning Toolkit":

Figure 29 (available in the supplement of the study): Clustering and variation analysis of amplification curves.

Panel A: Amplification curves plotted from raw data of the 32HCU samples. Each curve represents a different sample, with colors distinguishing between individual samples (e.g., A1, B1, C1, etc.). The x-axis represents the number of cycles, and the y-axis represents fluorescence intensity.

Panel B: Signal-to-noise ratios of the amplification curves across all cavities. The bar plot shows that the signal-to-noise ratios are generally similar between different samples. Each bar corresponds to a sample, with colors matching those in Panel A. Black horizontal lines indicate median values.

Panel C: Scatter plot of Cq (quantification cycle) values versus amplification efficiency calculated using the efficiency(pcrfit()) function from the qpcR package. The vertical line represents the median Cq value. Data points that are greater or less than 0.1 of the median Cq are labeled with observation labels (e.g., D1, E1, F1).

Panel D: Dendrogram showing the results of cluster analysis based on the Hausdorff distance of the amplification curves. The clustering does not reveal a specific pattern with respect to the amplification curve signals. Observations D1, E1, F1, F3, G3, and H1 are noted as differing most from the other amplification curves.
AquaEcOmicsaquaecomics
2025-01-21

The preliminary program for the AquaEcOmics symposium is now available: aquaecomics.symposium.inrae.fr

Make sure not to miss out and register before the 31th of January: aquaecomics.symposium.inrae.fr/

AquaEcOmicsaquaecomics
2025-01-06

Excited to announce the preliminary program for the upcoming AquaEcOmics symposium. Registration closes on the 31th of January so it is not yet too late to secure your attendance. aquaecomics.symposium.inrae.fr/

AquaEcOmicsaquaecomics
2024-11-14

Final day for abstract submissions for AquaEcOmics meeting. Get your abstract in now to come and discuss the advances of omics tools for monitoring aquatic ecosystems.
aquaecomics.symposium.inrae.fr/

AquaEcOmicsaquaecomics
2024-09-30

Come to AquaEcOmics Symposium to present your work and learn more on the use of omics to study aquatic environments.
> Abstract submission is extended to 15 nov.
> Early bird registration: 31 nov

aquaecomics.symposium.inrae.fr/

AquaEcOmicsaquaecomics
2024-09-16

Register for the upcoming AquaEcOmics Symposium and come listen to great keynote speakers who will discuss the use of environmental omics for microbial network analyses, assessing functional diversity and evolutionary diversification and gaining insights into spatial and temporal community dynamics. aquaecomics.symposium.inrae.fr/

AquaEcOmicsaquaecomics
2024-09-02

Registrations for the 2025 AquaEcOmics Symposium are open!
Have a look and select among the 7 great sessions hereby 🙂
Submission deadline: 29 sept 2024
aquaecomics.symposium.inrae.fr/

aquaecomics sessions
Frédéric Rimetrimetfrederic
2024-07-26

AquaEcOmics - Registrations for the 2025 AquaEcOmics Symposium are now open! Register now to learn and discuss about recent advancements and challenges of omic tools and how they can be used to address pertinent scientific and management questions in aquatic ecosystems.
aquaecomics.symposium.inrae.fr/

AquaEcOmicsaquaecomics
2024-07-19

Registrations for the 2025 AquaEcOmics Symposium are now open! Register now to learn and discuss about recent advancements and challenges of omic tools and how they can be used to address pertinent scientific and management questions in aquatic ecosystems.
aquaecomics.symposium.inrae.fr/

Aquaecomics registration
AquaEcOmicsaquaecomics
2024-07-19

Registrations for the 2025 AquaEcOmics Symposium are now open! Register now to learn and discuss about recent advancements and challenges of omic tools and how they can be used to address pertinent scientific and management questions in aquatic ecosystems. aquaecomics.symposium.inrae.fr/

AquaEcOmicsaquaecomics
2024-04-17

Ready for a meeting to explore aquatic ecosystems biodiversity, functionning and monitoring with eDNA and multi-Omics methods?

Christian Brueffercbrueffer
2023-04-10

At and interested in ?

Check out our SAGAdx/abbvie collaboration on monitoring t(11;14) translocations in PBMCs/plasma using WGS and .

doi.org/10.1158/1538-7445.AM20

2023-03-17

Next week starts the 10th Gene Quantification Event #GQ2023 in Freising. Focus Topics are
Sars-Cov-2, Spatial- #Transcriptomics, #LiquidBiopsy & #CNA, Multi-#Omics #Biomarkers

Looking forward to this. We will present some research about #machinelearning on qPCR data (joss.theoj.org/papers/10.21105).

gene-quantification.de/GQ2023/

#qPCR #dPCR #NGS

2023-02-08

#GQ2023 — 10th Gene Quantification Event in #Freising is great because you can learn for example about #NGS, #qPCR, #dPCR, #biomarkers, Spatial-#Transcriptomics, #LiquidBiopsy & Circulating Nucleic Acids by great scientists like Jim #Huggett (#dMIQE), Stephen #Bustin (en.wikipedia.org/wiki/Stephen_), Michael W. #Pfaffl (scholar.google.de/citations?us) or Jo #Vandesompele (famous for #qBase, #geNorm, ...) gene-quantification-2023.event

#cfdna #LiquidBiopsy #spatialtranscriptomics #cancer

devSJR :python: :rstats:devSJR@fosstodon.org
2022-11-21

Some colleagues and I have been working for a long time on a review of R packages for the analysis of #qPCR experiments, #dPCR experiments and melting curves. What we can find is that there are a lot of packages and we will probably overlook some. I did my last search with rdrr.io/ and discovered a lot more.

#rstats #PCR

devSJR :python: :rstats:devSJR@fosstodon.org
2022-11-04

Recently I used r-pkg.org/ (
#METACRAN: Search and browse all #CRAN/#R packages). This was a good thing to do, since I discovered R packages related to #qPCR that I haven't heard of before. Since several authors and I are writing a review about #dPCR, qPCR and #meltingcurveanalysis this is good not to forget anybody.

#Rstats
@rstats

Client Info

Server: https://mastodon.social
Version: 2025.07
Repository: https://github.com/cyevgeniy/lmst