#qpcR

devSJR :python: :rstats:devSJR@fosstodon.org
2025-06-21

Following #rstats packages were maintained and are back on #CRAN now thanks to Andrej Spiess

- #dpcR, 2025-06-18, Digital PCR Analysis <10.32614/CRAN.package.dpcR>
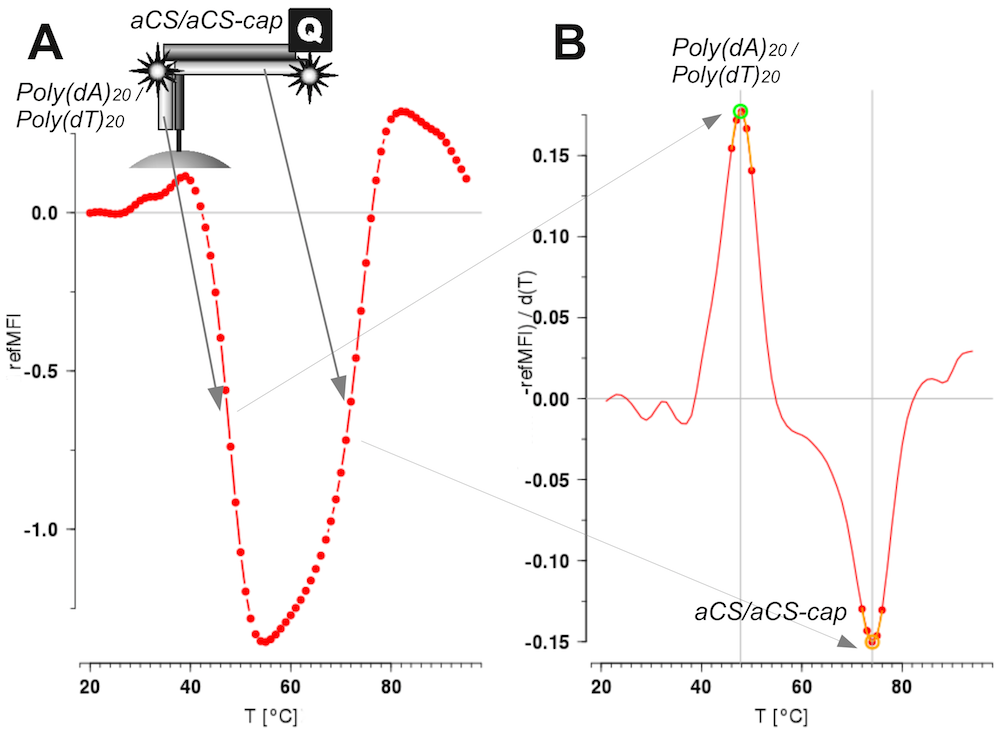
- #MBmca, 2025-06-11, Nucleic Acid Melting Curve Analysis (journal.r-project.org/articles)
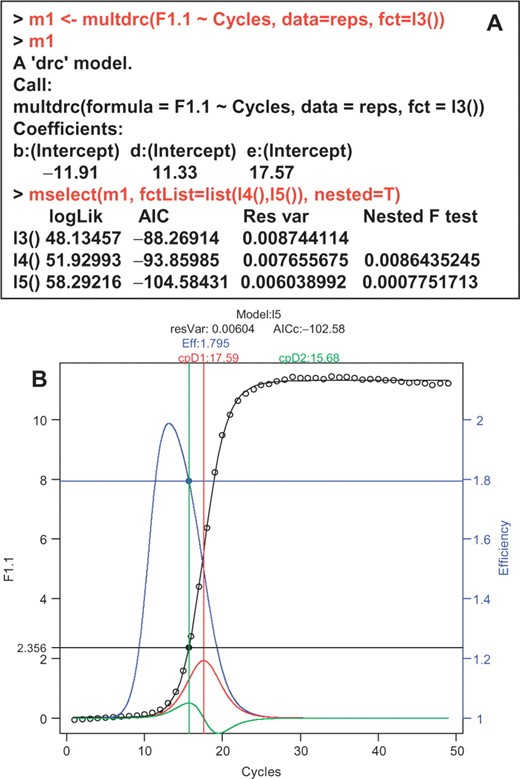
- #qpcR, 2025-06-10, Modelling and Analysis of Real-Time PCR Data <doi10.1093/bioinformatics/btn227>
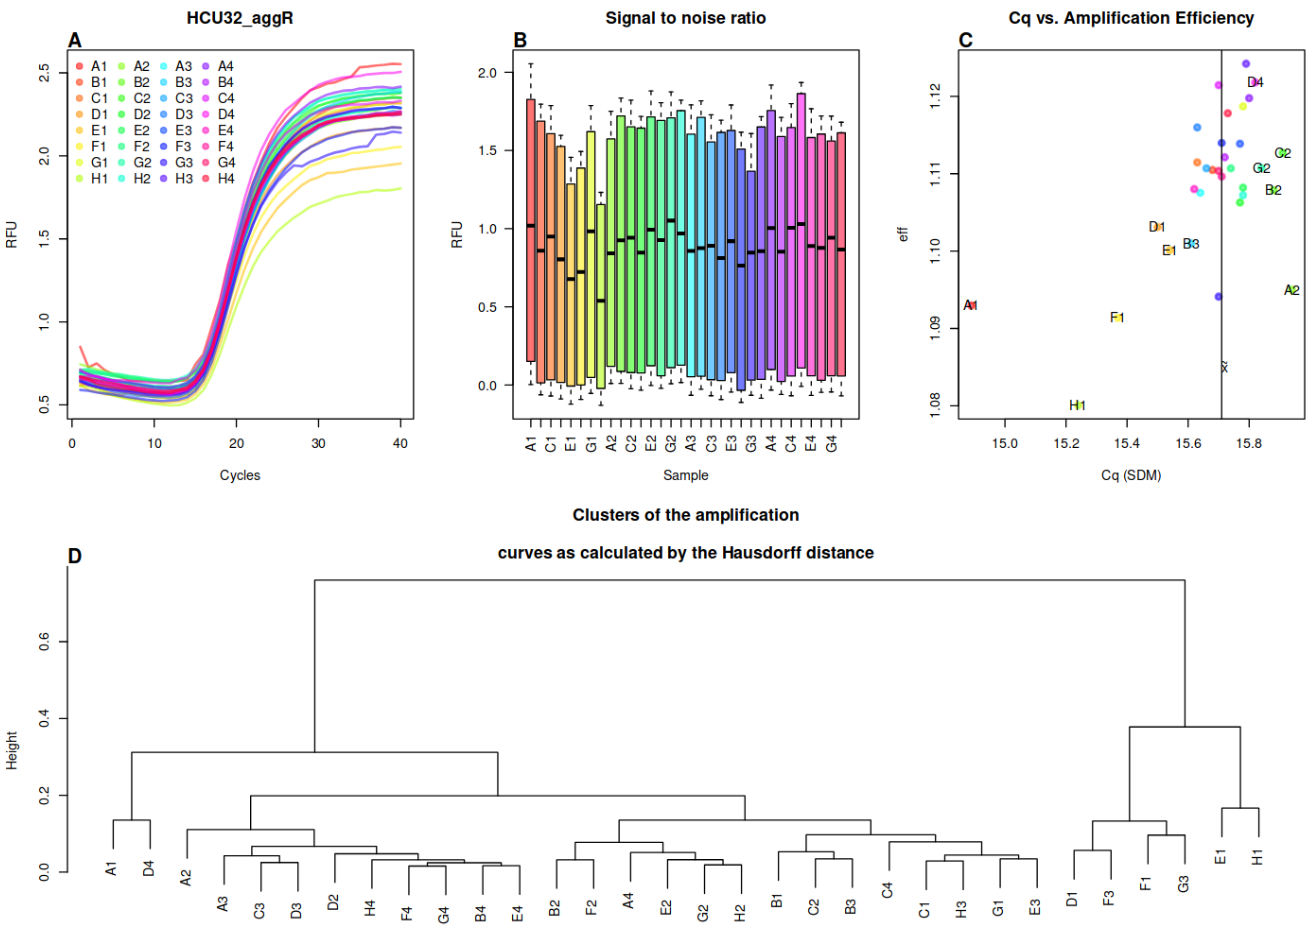
- #PCRedux, 2025-06-13, Quantitative #PCR (#qPCR) Data Mining and Machine Learning Toolkit as Described in <doi:10.21105/Joss.04407>

Description for Figure 1 from the publication "qpcR: an R package for sigmoidal model selection in quantitative real-time polymerase chain reaction analysis" (Figure 1: The qpcR package for sigmoidal model selection.)

Panel A: Console output from the qpcR package. This example shows a three-parameter log-logistic model fitted to qPCR data obtained from the amplification of the S27a transcript using human testicular RNA and a Lightcycler™ (Roche) instrument. The best-fitting model is selected by the 'mselect' function, which chooses the optimal model according to nested F-tests on the residual variance. In this case, the five-parameter model ('l5') is compared to the three- and four-parameter models.

Panel B: A fitted five-parameter log-logistic model ('l5') on single qPCR data. The graph displays various parameters from the model fitting process, including:

Model name
Residual variance
Efficiency curve (blue)
First derivative curve (red) and its maximum (threshold cycle)
Second derivative curve (green) and its maximum (threshold cycle)
The x-axis represents the number of cycles, and the y-axis on the left represents fluorescence intensity. The y-axis on the right represents efficiency.description for Figure 3 from the article "Surface Melting Curve Analysis with R":

Figure 3: Melting curve and melting peaks obtained from a Microarray Chip Analysis (MCA) experiment on microbead surfaces.

Top left inset: Illustration of two DNA detection probes hybridized to a complementary microbead-bound capture probe. The probes are labeled as Poly(dA)20 and Poly(dT)20.

Panel A: Melting curve showing the change in relative fluorescence intensity (relMFI) while applying a temperature gradient from 20°C to 95°C, increasing by 1°C per step. The red line represents the experimental data points, illustrating how the fluorescence changes with temperature.

Panel B: Melting peaks derived from the melting curve in Panel A. This probe system exhibits two distinct melting peaks:

The first (positive) peak occurs at approximately 60°C for Poly(dA)20.
The second (negative) peak occurs at approximately 75°C for Poly(dT)20.
The x-axis represents temperature in degrees Celsius (°C), and the y-axis represents the change in relative fluorescence intensity (dMFI/dT).description for Figure 29 from the study "PCRedux: A Quantitative PCR Machine Learning Toolkit":

Figure 29 (available in the supplement of the study): Clustering and variation analysis of amplification curves.

Panel A: Amplification curves plotted from raw data of the 32HCU samples. Each curve represents a different sample, with colors distinguishing between individual samples (e.g., A1, B1, C1, etc.). The x-axis represents the number of cycles, and the y-axis represents fluorescence intensity.

Panel B: Signal-to-noise ratios of the amplification curves across all cavities. The bar plot shows that the signal-to-noise ratios are generally similar between different samples. Each bar corresponds to a sample, with colors matching those in Panel A. Black horizontal lines indicate median values.

Panel C: Scatter plot of Cq (quantification cycle) values versus amplification efficiency calculated using the efficiency(pcrfit()) function from the qpcR package. The vertical line represents the median Cq value. Data points that are greater or less than 0.1 of the median Cq are labeled with observation labels (e.g., D1, E1, F1).

Panel D: Dendrogram showing the results of cluster analysis based on the Hausdorff distance of the amplification curves. The clustering does not reveal a specific pattern with respect to the amplification curve signals. Observations D1, E1, F1, F3, G3, and H1 are noted as differing most from the other amplification curves.
2025-04-25

Our paper "MIQE 2.0: Revision of the Minimum Information for Publication of Quantitative Real-Time PCR Experiments Guidelines" is now published in Clinical Chemistry! 📚🔬

This update addresses recent advances in qPCR technology, providing clear recommendations on sample handling, assay design, and data analysis. We emphasize transparency and reproducibility to enhance the reliability of qPCR research.

doi.org/10.1093/clinchem/hvaf0 #MIQE2_0 #MIQE #qPCR #ResearchIntegrity #ScientificMethodology 📊🔍

Screenshot of the MIQE 2.0 revision paper front page.
IL PhotonicsILPhotonics
2024-11-14

Quantitative polymerase chain reaction () is a variation of the traditional PCR methodology to not just rapidly amplify and copy a DNA sample but to count how much has been produced. Real-time qPCR is now considered to be the gold standard method in microarray analysis, which allows for the study of the expression levels of many simultaneously. Learn more: ilphotonics.com/what-pcr-filte

2024-10-24

For the next few months, Dr. Andrej-Nikolai Spiess (openalex.org/works?page=1&filt) will be a guest in my working group.

We are working on a paper where we show that 29 % of papers in top journals like Science, Nature & PNAS were skewed by a single influential data point! Time to rethink our reliance on p-values and explore alternative measures like #dfstat. #reproducibilitycrisis #linearregression #rstats

Moreover, we will work on #qPCR related software like PCRedux (joss.theoj.org/papers/10.21105)

#JOSS

Show several plots with the effect of influential data points on linear regression: How do different measures respond to outliers? (A) dfbeta(slope), (B) dffits, (C) covratio, (D) hat value, (E) Cook‘s D, and (F) p-value. Outliers in orange areas exceed cut-off values; green indicates significant p-values.

No permssion to train AI in this post.
2024-09-11

Great to be involved in this lovely Water Research paper led by the brilliant Maggie Knight at Bangor University! The paper compares the pros and cons of #qPCR vs #metagenomic approaches for detecting antibiotic resistance genes in wastewater. The comprehensive dataset used in the study was from the the widespread Wales wastewater monitoring. Personally, I'm team metagenomic!
doi.org/10.1016/j.watres.2024.

devSJR :python: :rstats:devSJR@fosstodon.org
2024-07-28

Most problems have been fixed in the #PCRedux package. There are still issues with the #rgl package and #Matrix is causing trouble on older platforms (especially #Ubuntu) 🤔. We're still figuring out how to solve the rgl problem, unfortunately it depends on the #qpcR package which calculates some of our key parameters 💡.
More work ahead of us.

#rstats

2024-07-19

New publication: Risk assessment of toxic #cyanobacterial blooms in recreational #waters: A comparative study of monitoring #methods. #microsystin #fluorometry #microscopy #qPCR
doi.org/10.1016/j.hal.2024.102

Figure 1 in Schürmann et al. (2024): "Map of The Netherlands with the sampled lakes."
2024-06-01

Explaining the impact of mutations on quantification of SARS-CoV-2 in wastewater. #wastewater #SARS #COVID #wastewatersurveillance #diseasesurveillance #PCR #qPCR nature.com/articles/s41598-024

2024-06-01

Explaining the impact of mutations on quantification of SARS-CoV-2 in wastewater. #wastewater #SARS #COVID #wastewatersurveillance #diseasesurveillance #PCR #qPCR nature.com/articles/s41598-024

Giuseppe MichieliGMIK69@mstdn.science
2024-04-24

#US #FDA, Updates on Highly Pathogenic Avian #Influenza #H5N1 (HPAI), as of April 23 2024, fda.gov/food/alerts-advisories

Based on available information, #pasteurization is likely to inactivate the virus, however the process is not expected to remove the presence of viral #particles. Therefore, some of the samples collected have indicated the presence of HPAI using quantitative polymerase chain reaction (#qPCR) testing.

2024-04-24

1/2 #H5N1

My take:

1. While a #qPCR #may in this case be picking up #unviable rna #viral #fragments - it would be #critical to #share their #results on attempts to #grow_virus from #milk that was #qPCR+ following #pasteurization to #reassure #public

bit.ly/3Uf55p9

Bose-Einstein-KondensatMWNautilus@mstdn.social
2024-02-17
Teresita Porter 🙋🏻‍♀️DNAdataPhile@ecoevo.social
2023-12-21

**A practical workflow for forensic species identification using direct sequencing of real-time PCR products**

link.springer.com/article/10.1

#qPCR #rtPCR #sequencing #DNAbarcoding #forensics

Teresita Porter 🙋🏻‍♀️DNAdataPhile@ecoevo.social
2023-09-12

Environmental DNA reveals the genetic diversity and population structure of an invasive species in the Laurentian Great Lakes

pnas.org/doi/10.1073/pnas.2307

#water #MitochondrialEDNA #NuclearEDNA #qPCR #microsatellites #sequencing #PopulationGenetics #benchmark #fish

Teresita Porter 🙋🏻‍♀️DNAdataPhile@ecoevo.social
2023-07-24

**A global baseline for qPCR-determined antimicrobial resistance gene prevalence across environments**

sciencedirect.com/science/arti

#AMR #AntiMicrobialResistance #qPCR #EnvironmentalMonitoring

Pat TaylorPaddyKTaylor
2023-07-24

So, I'm thinking about good R packages to do analyses of data. Ones that have caught my eye are tidyqpcr, pcr, qPCRtools. Something that gives some really nice and versatile plots or something that could pipe right into is really desired. Anyone have any recommendations?

2023-03-17

Next week starts the 10th Gene Quantification Event #GQ2023 in Freising. Focus Topics are
Sars-Cov-2, Spatial- #Transcriptomics, #LiquidBiopsy & #CNA, Multi-#Omics #Biomarkers

Looking forward to this. We will present some research about #machinelearning on qPCR data (joss.theoj.org/papers/10.21105).

gene-quantification.de/GQ2023/

#qPCR #dPCR #NGS

2023-02-08

#GQ2023 — 10th Gene Quantification Event in #Freising is great because you can learn for example about #NGS, #qPCR, #dPCR, #biomarkers, Spatial-#Transcriptomics, #LiquidBiopsy & Circulating Nucleic Acids by great scientists like Jim #Huggett (#dMIQE), Stephen #Bustin (en.wikipedia.org/wiki/Stephen_), Michael W. #Pfaffl (scholar.google.de/citations?us) or Jo #Vandesompele (famous for #qBase, #geNorm, ...) gene-quantification-2023.event

#cfdna #LiquidBiopsy #spatialtranscriptomics #cancer

2023-01-23

Environmental DNA lets us detect species, but DNA moves & persists in the environment, so a DNA detection may not represent a local, living individual. Our #NewPaper (led by Léonie Suter) uses different DNA fragment lengths to distinguish recently-shed from older krill eDNA

Read the paper here: onlinelibrary.wiley.com/doi/fu

AusAntarctic news summary here: antarctica.gov.au/news/2023/dn

#eDNA #EnvironmentalDNA #qPCR #Antarctic #krill

devSJR :python: :rstats:devSJR@fosstodon.org
2022-11-21

Some colleagues and I have been working for a long time on a review of R packages for the analysis of #qPCR experiments, #dPCR experiments and melting curves. What we can find is that there are a lot of packages and we will probably overlook some. I did my last search with rdrr.io/ and discovered a lot more.

#rstats #PCR

Client Info

Server: https://mastodon.social
Version: 2025.07
Repository: https://github.com/cyevgeniy/lmst