🎩🔍 Ah, yes, a riveting tale of a 200-year-old "bad boy" who single-handedly disrupted the world with... bar charts? 🤔 Because nothing screams rebel like a horizontal axis. Meanwhile, modern data analysts are left wondering if they too can achieve legendary status by inventing the pie chart. 🍰
https://blog.engora.com/2023/05/the-bad-boy-of-bar-charts-william.html #badboy #dataanalysis #barcharts #piecharts #HackerNews #HackerNews #ngated
#piecharts
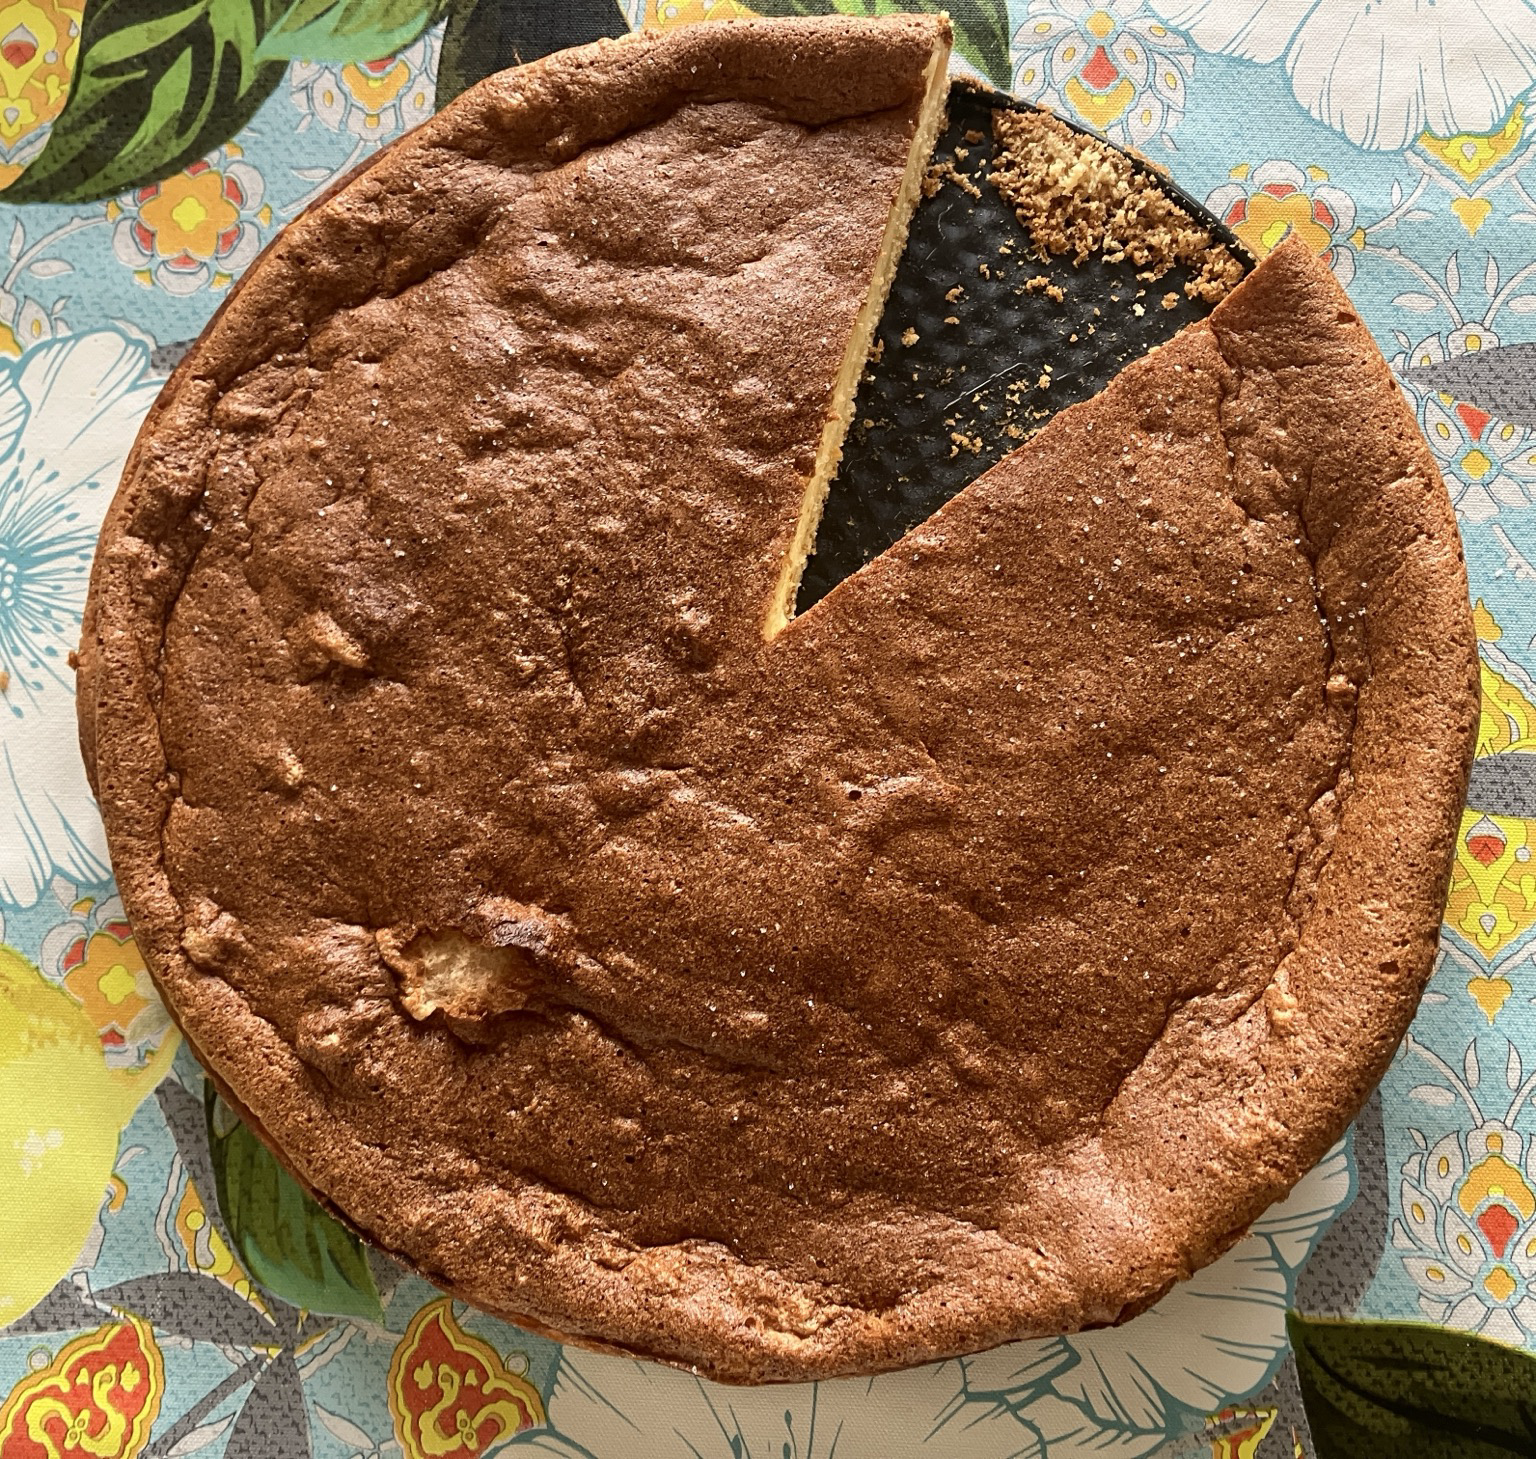
Pie chart
Happy Pi Day! I'm reminded of this old piece on Pie charts: "In Defense of Pie Charts, and Why You Shouldn’t Use Them"
https://medium.com/@kristinhenry/in-defense-of-pie-charts-and-why-you-shouldnt-use-them-df2e8ccb5f76
#statstab #261 Visualizing proportions: A case for pie charts
Thoughts: Not all proportion data is created equal (e.g. % of an area vs counts turned to proportions). But, sometimes pie charts are enough.
> ... useful piece of advice: never, ever, ever use pie charts. Pie charts are the evil instrument that politicians and business people use to cheat on us, to make us believe that a product or a political party is better than that of the competitors. If you want to be honest, stay away from pie charts.
#PieCharts in #PenAndPaperStatistics by #AntonioMarco 🧵
(h/t Morgan at #Balticon/BSFS)
@drazraeltod Balken auf logarithmischen Skalen sind ungefähr so verwirrend wie #Piecharts.
@ElenLeFoll 😭 but now I can never not think of this when I make my students remove (fire?) their pie charts 😩 #piecharts
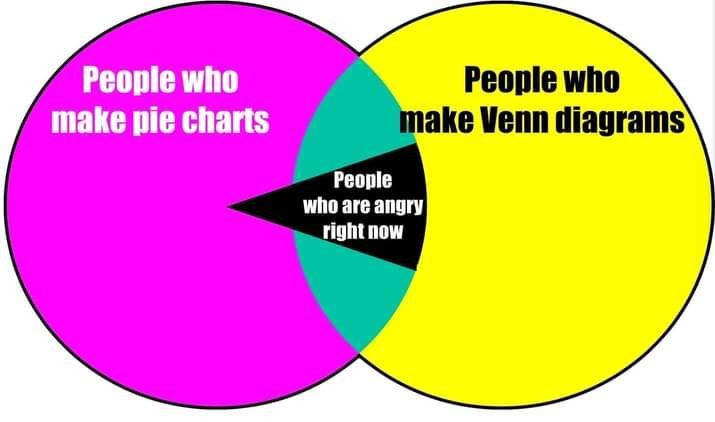
Quality trolling
#ScifiVsReality Pie charts are among the most popular graphics, but most experts avoid #PieCharts. Why? Small percentages are quickly misrepresented and challenging to read. For colour-blind people, the chart is almost impossible to interpret. #Scifi https://buff.ly/2Z9E8IZ
Here’s why you should (almost) never use a pie chart for your data
https://theconversation.com/heres-why-you-should-almost-never-use-a-pie-chart-for-your-data-214576 #statistics #graphics #PieCharts #data #proportion #BarChart
Apparently, this old article of mine is getting some new attention.
https://medium.com/p/df2e8ccb5f76
If you don't have a medium account, here's a friend link: https://kristinhenry.medium.com/in-defense-of-pie-charts-and-why-you-shouldnt-use-them-df2e8ccb5f76?sk=94500fba6dcc32727aefe7306b04d3fe
Suddenly, folks are interested in Pie Charts.
> Cleveland examined how accurately our visual system can process visual elements or “perceptual units” representing underlying data. These elements include markers aligned on the same scale (e.g., #DotPlots, #ScatterPlots, ordinary #BarCharts), the length of lines that are not aligned on the same scale (e.g., stacked bar plots), area (#PieCharts and mosaic plots), angles (also pie charts), shading/color, volume, curvature, and direction...
#WilliamCleveland #RobertMcGill
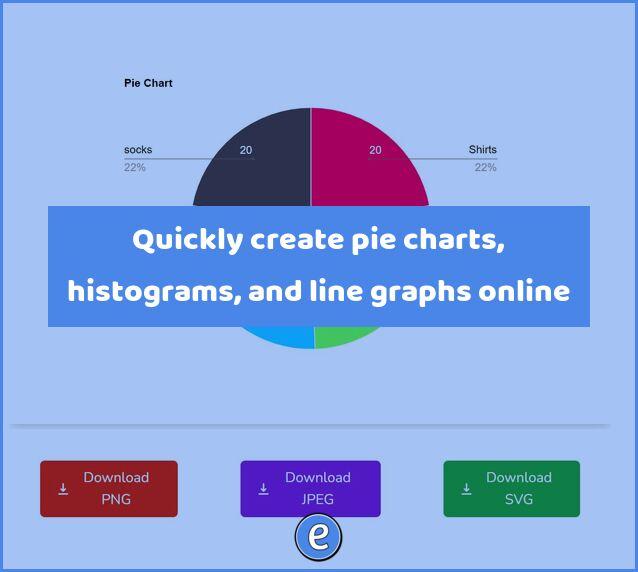
Quickly create pie charts, histograms, and line graphs online
#edtech #education #linegraphs #piecharts #teachers
https://eduk8.me/2023/04/quickly-create-pie-charts-histograms-and-line-graphs-online/
> The results are resoundingly clear—judgements about position relative to a baseline are dramatically more accurate than judgements about angles, area, or length (with no baseline). Hence.. [#Cleveland] suggests that we replace #PieCharts with #BarCharts or #DotPlots and that we substitute stacked bar charts for grouped bar charts.
#SolomonMessing on #EdwardTufte and #DataVisualization
Client Info
Server: https://mastodon.social
Version: 2025.04
Repository: https://github.com/cyevgeniy/lmst