Rebecca Seifried

Map enthusiast by day, archaeologist by night. Into teaching GIS, building geospatial data collections, doing landscape archaeology, exploring post-medieval Greece, and (of course) making maps.

Geospatial Information Librarian at UMass Amherst, Co-Director of the CARTography Project, and soon-to-be Co-Director of the Southern Mani Archaeological Project.

She/her.

Rebecca Seifried boosted:
2023-12-21

#qgis2web announcement!

The qgis2web repository has moved. It is now no longer in my Github account, but under a new qgis2web organization. This should be largely transparent, but take care if you have a local clone - check your upstream repo.

github.com/qgis2web/qgis2web

Also, Andrea has released v3.17.1! github.com/qgis2web/qgis2web/r

Rebecca Seifried boosted:
2023-12-09

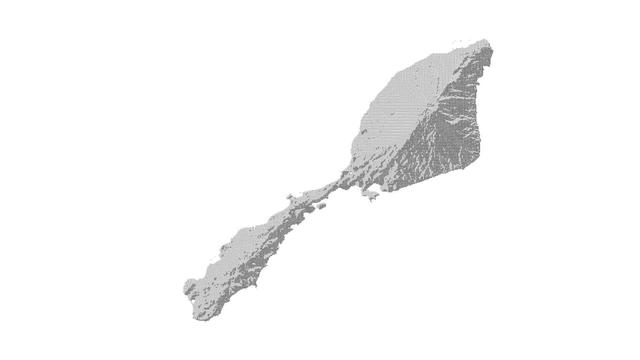
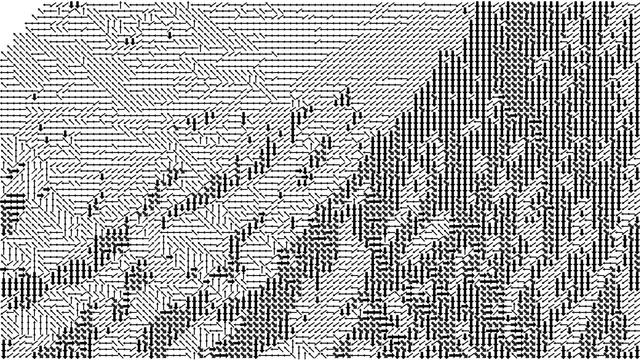
Going for an ascii art look. Jan Mayen, data from Norwegian Polar Institute. Done in :qgis:

Did a D8 flow pointer in #whiteboxtools. This quantizes downslope aspect to 8 directions

Create grid in #qgis. Sample the d8 raster and original dem. Style with 8 different SVG arrow markers rotated around center, using thicker arrows for SE-facing to simulate hillshade. Filter out all the points with 0 elevation to mask out the sea.

zoomed out, a map of Jan Mayen in the north atlantic between Iceland and Greenland.zoomed in, arrows are rotated to show downhill direction in 8 different directions. Arrows are thicker for E, SE and S facing cells to simulate hillshade
Rebecca Seifried boosted:
2023-10-31

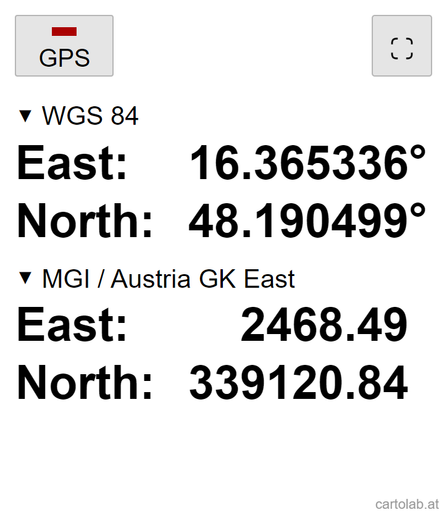
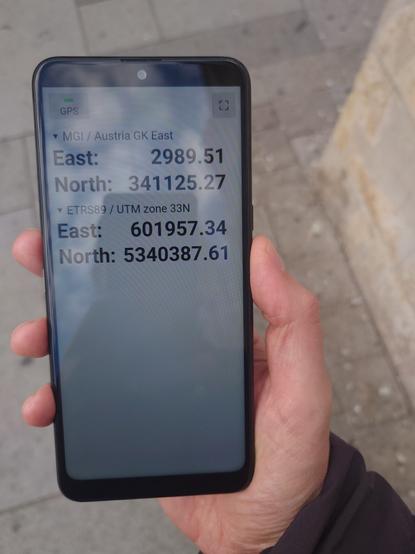
For teaching Coordinate Reference Systems in my GIS/cartography intro course, I made this simple app that can show the current GPS location in two different coordinate systems. It supports all CRS supported by Proj4JS (more than five thousand).

(Yes there is a ton of "coordinate converter" apps out there, but their UI is far too overloaded for my purposes.)

cartolab.at/coords/

Source code is available at github.com/floledermann/coordi

#gis #gischat

Screenshot of the coordinate converter app at cartolab.atPhoto of the coordinate converter app in action
Rebecca Seifried boosted:
2023-10-25

Introducing lonboard: the fastest way to visualize large geospatial vector data from Python.

Here's 3 million points rendered with a unique color and radius per point, in two seconds.

developmentseed.org/blog/2023-
ds.io/lonboard

Rebecca Seifried boosted:
Maria Ruehringermariarue@mapstodon.space
2023-10-25

One more week until the start of the #30DayMapChallenge 😍
This year I am diving for the first time into 3D maps, here is some work in progress.
Anyone else here already preparing and wants to share some work in progress? 😄
#gischat

Rebecca Seifried boosted:
Jeremy Garniauxjeremy@mapstodon.space
2023-10-25

This is Gaza.

A screenshot of a map centered on New York City. Above it, at scale, there's a cartographic polygon representing Gaza.A screenshot of a map centered on Ibiza. Above it, at scale, there's a cartographic polygon representing Gaza.A screenshot of a map centered on Istanbul. Above it, at scale, there's a cartographic polygon representing Gaza.A screenshot of a map centered on the big island of Hawai'i. Above it, at scale, there's a cartographic polygon representing Gaza.
Rebecca Seifried boosted:
2023-10-25

Gaza Strip in maps by BBC: bbc.co.uk/news/world-middle-ea
Always nice to see a focus on #GIS and maps. The 3D population density map is particularly interesting and slightly unusual.
I've seen a few instances of similar maps, and would assume it would need something extra on top of usual GIS programs e.g. Blender? Something that could be piped from #qgis?
#gischat

Rebecca Seifried boosted:
2023-10-02

The themes for the upcoming #30DayMapChallenge 2023 have been published and… I will safely not do it this year 🙂.
Doing it in 2022 was an incredible experience (bbecquet.net/articles/2022/12/), but I mostly remember how exhausted I was at the end. This year I'm already doing some Inktober, I'm still making engraved maps on my own, I don't work in web cartography anymore, I have less free time… a lot of reasons to just sit and watch other people do great things. Good luck to all who will participate!

Rebecca Seifried boosted:
2023-10-02

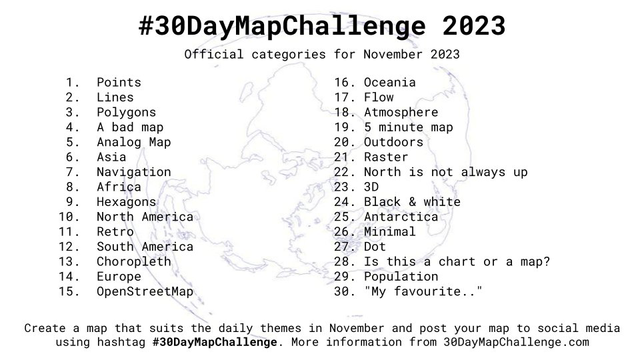
#30DayMapChallenge themes are here. Make (and publish) a map each day of November around a specific prompt. More info on GitHub and 30daymapchallenge.com/

Rebecca Seifried boosted:
2023-10-02

Make a map. Send it to me. If I like it, I'll print it and you'll get a commission if it sells.

Image from Gboard Clipboard
Rebecca Seifried boosted:
2023-10-02

The entire NW-facing side of the Mont Blanc massif (from Aiguille du Tour on the left to the Dômes de Miage on the right), seen from Prarion. #mountains #alps #frenchalps #chamonix #montblanc #glaciers #geology

Rebecca Seifried boosted:
2023-10-01

Visualising the scale of the Solar System at human scale using #qgis, a map of #edinburgh copyright #openstreetmap contributors.

This map shows the scaled down orbits of Mercury, Venus, Earth and Mars.

Imagine the Earth is the size of a snooker ball, 5cm across. With the Sun just outside the Balmoral hotel, a 6m diameter ball of fire.

Imagine holding the Earth as a billiard ball in your hand. And walk briskly. At this scale, you're walking at the speed of light. 😮

Map of Edinburgh. Concentric circles from the Balmoral Hotel represent the orbits of the 4 inner planers (Mercury, Venus, Earth and Mars) as if the Earth was scaled down to the size of a Billiard Ball.
Rebecca Seifried boosted:
2023-09-30

@ianturton Whenever I'm helping a student with ArcGIS, if we have time at the end, I do like to add a quick "And here's how much more easily we could do the same thing in QGIS..."

2023-09-30

@kgjenkins @ianturton 🤯 and here I was running <3.24 and missing out on all the good stuff!

2023-09-29

@ianturton @kgjenkins ha, I usually default to QGIS, too… but in that case you might need to create a .csvt file instead.

2023-09-27

TIL about rasterio, a #Python library for working with #rasters that's a lot easier to install than GDAL. Total gamechanger!

I needed to find out the CRS of a GeoTIFF that #ArcGIS wasn't reading correctly. It was a simple as running this code:

```
import rasterio as rs
dataset = rs.open(‘file.tif')
print(dataset.crs)
```
Documentation: rasterio.readthedocs.io/en/sta

And shout-out to this article that pointed me to it: towardsdatascience.com/reading

Rebecca Seifried boosted:
Simon Kuestenmachersimongerman600@mastodon.au
2023-09-26

This #badgeographyjoke is actually kinda cute.

Rebecca Seifried boosted:
Jeremy Garniauxjeremy@mapstodon.space
2023-09-25

30 minutes isochrone, drawn from Montpellier City Hall.

(isochrone = geographical area drawn from the same travel distance from a source point)

From left to right:
- IGN / geoportail.gouv.fr
- OpenStreetMap / commutetimemap.com / geoapify.com
- Google Maps.

Not sure which one is better, pretty clear which one is worst.

#OpenStreetMap #GoogleMaps #Géoportail #isochrone

A screenshot of an 30 minutes isochrone map from the City Hall of Montpellier, using geoportail.gouv.fr (data from the IGN).A screenshot of an 30 minutes isochrone map from the City Hall of Montpellier, using commutetimemap.com based on OpenStreetMap data.A screenshot of an 30 minutes isochrone map from the City Hall of Montpellier, using Google Maps.
Rebecca Seifried boosted:
2023-09-25

Encountered this real treasure just now via HackerNews: fieggen.com/shoelace/ianknothi

Rebecca Seifried boosted:
2023-09-19

EXIF image metadata has the craziest way to store lat/lon coordinates that I've ever seen... a sequence of 3 (degrees, minutes, seconds) values stored as rational64u numeric types

Screenshot showing latitude stored as a sequence of 3 custom number types.  3 because of degrees, minutes, and seconds.  Each component number is a "rational64u" value, with numerator and denominator values.

Client Info

Server: https://mastodon.social
Version: 2025.04
Repository: https://github.com/cyevgeniy/lmst