Stamen Design

We are a data visualization and cartography studio with over 20 years of experience helping people find and tell more beautiful stories with data. Learn more at stamen.com

Stamen Designstamen@vis.social
2025-05-01

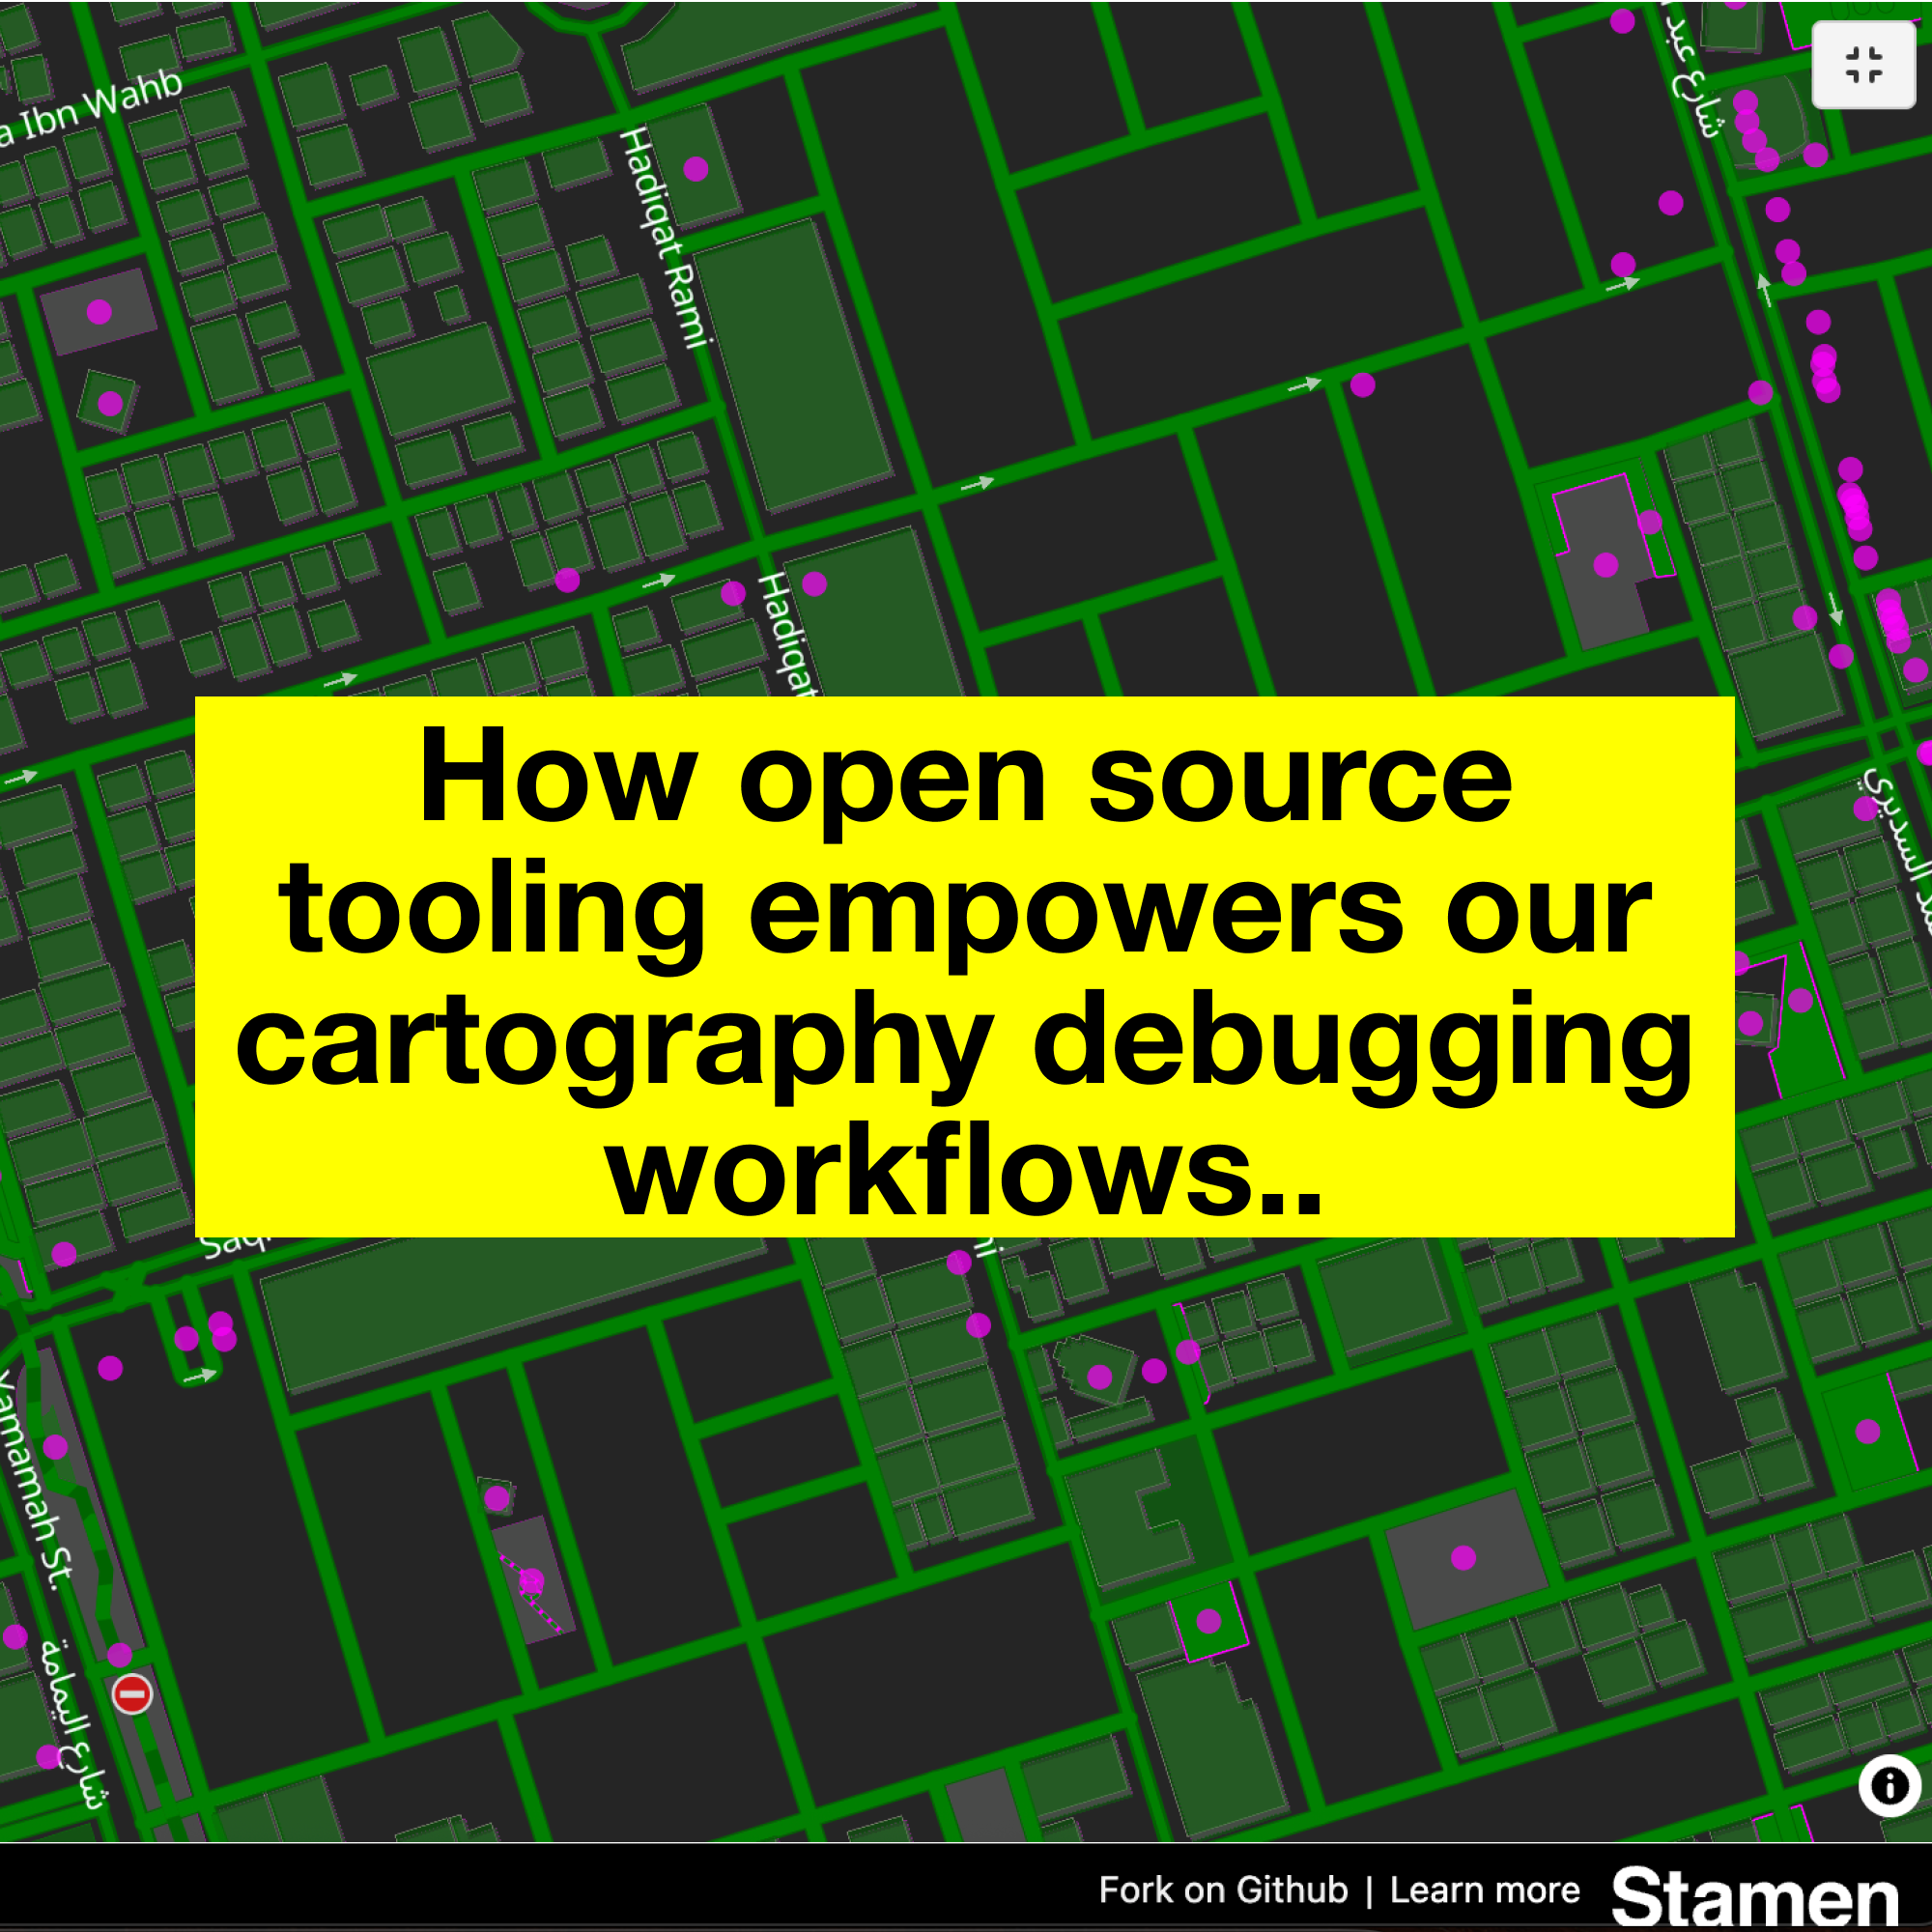
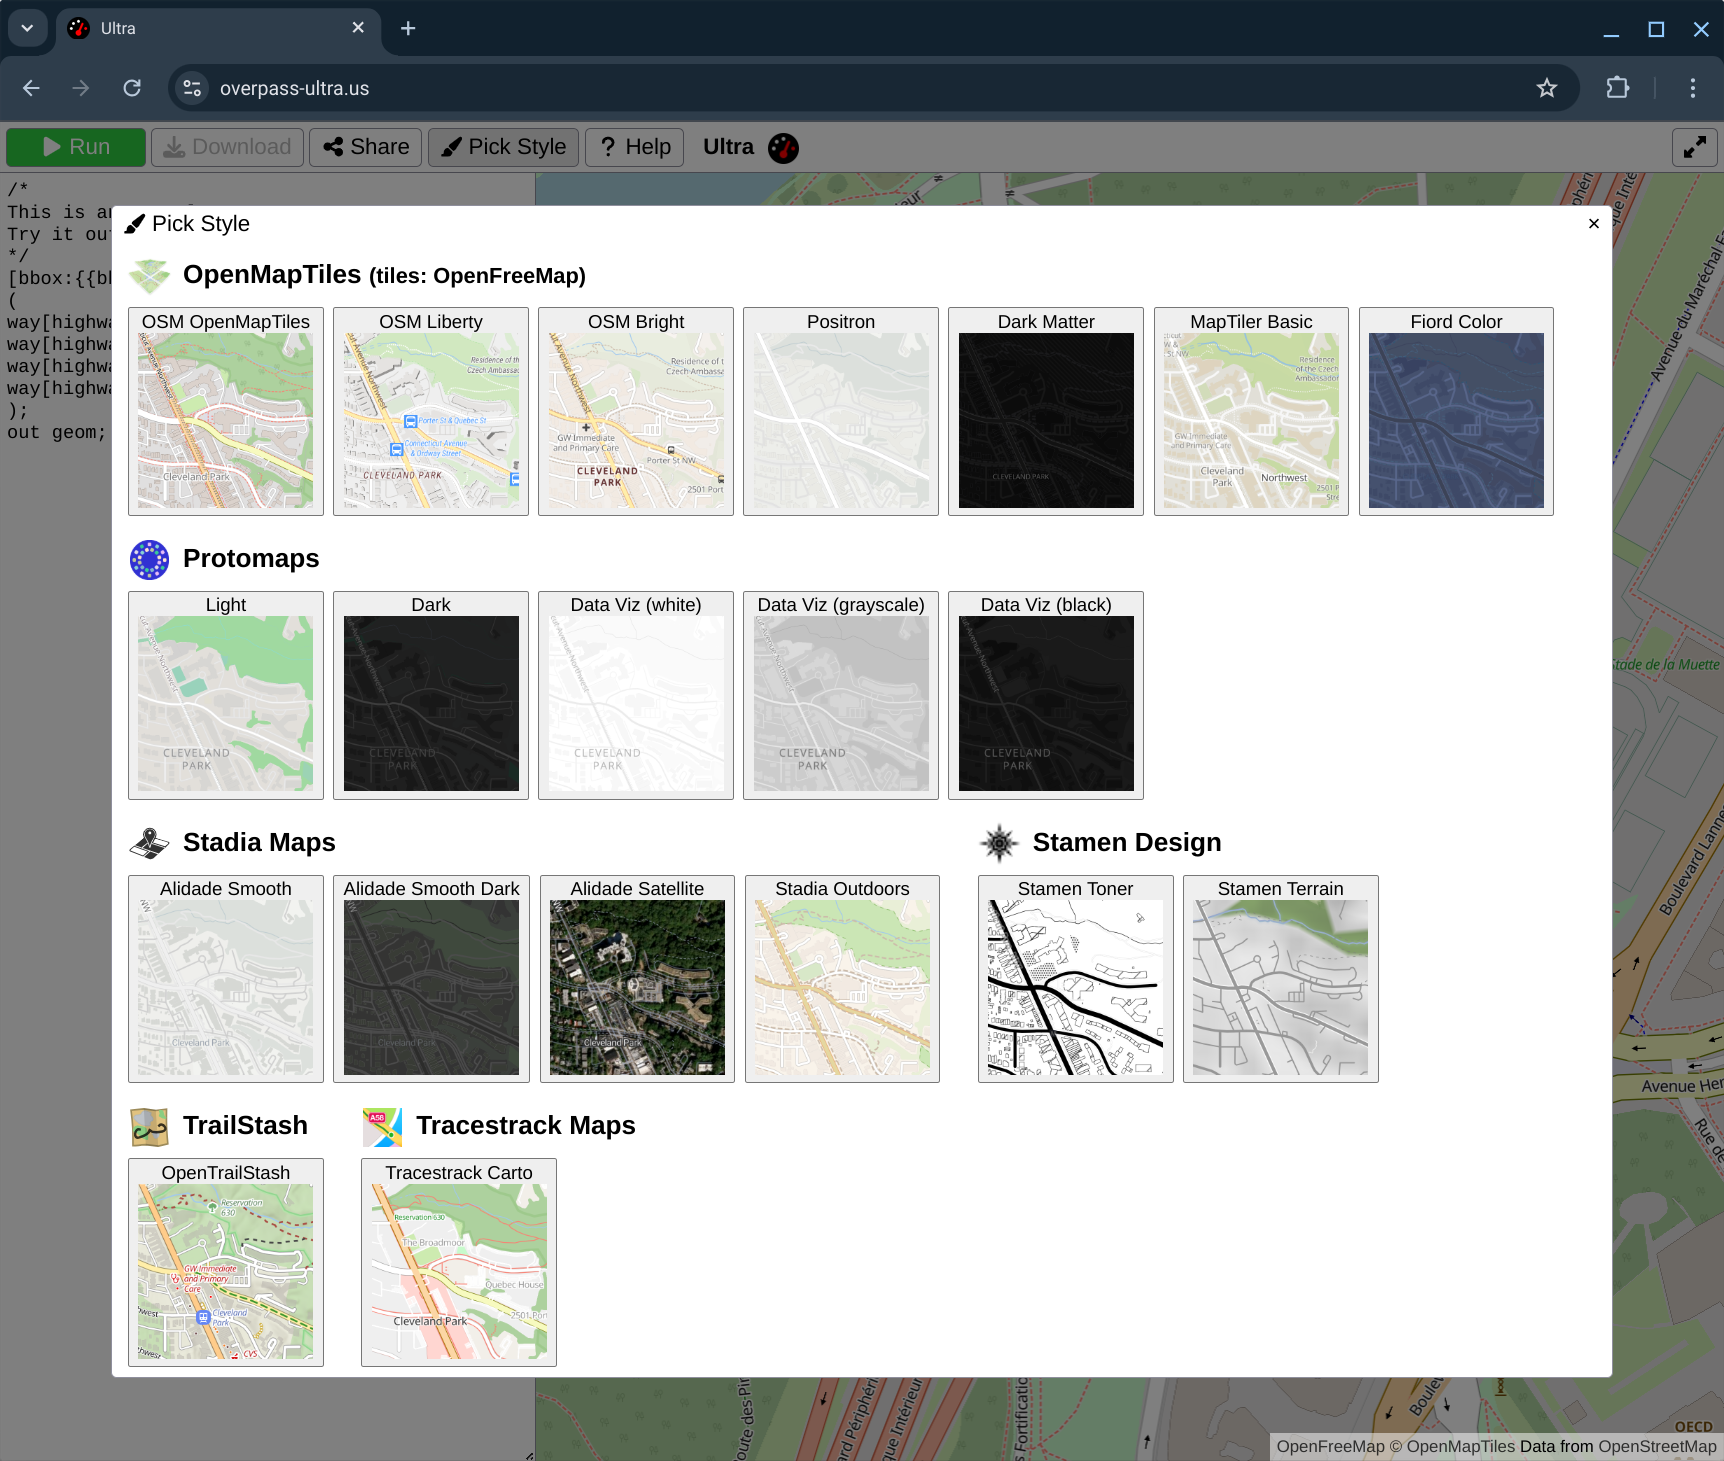
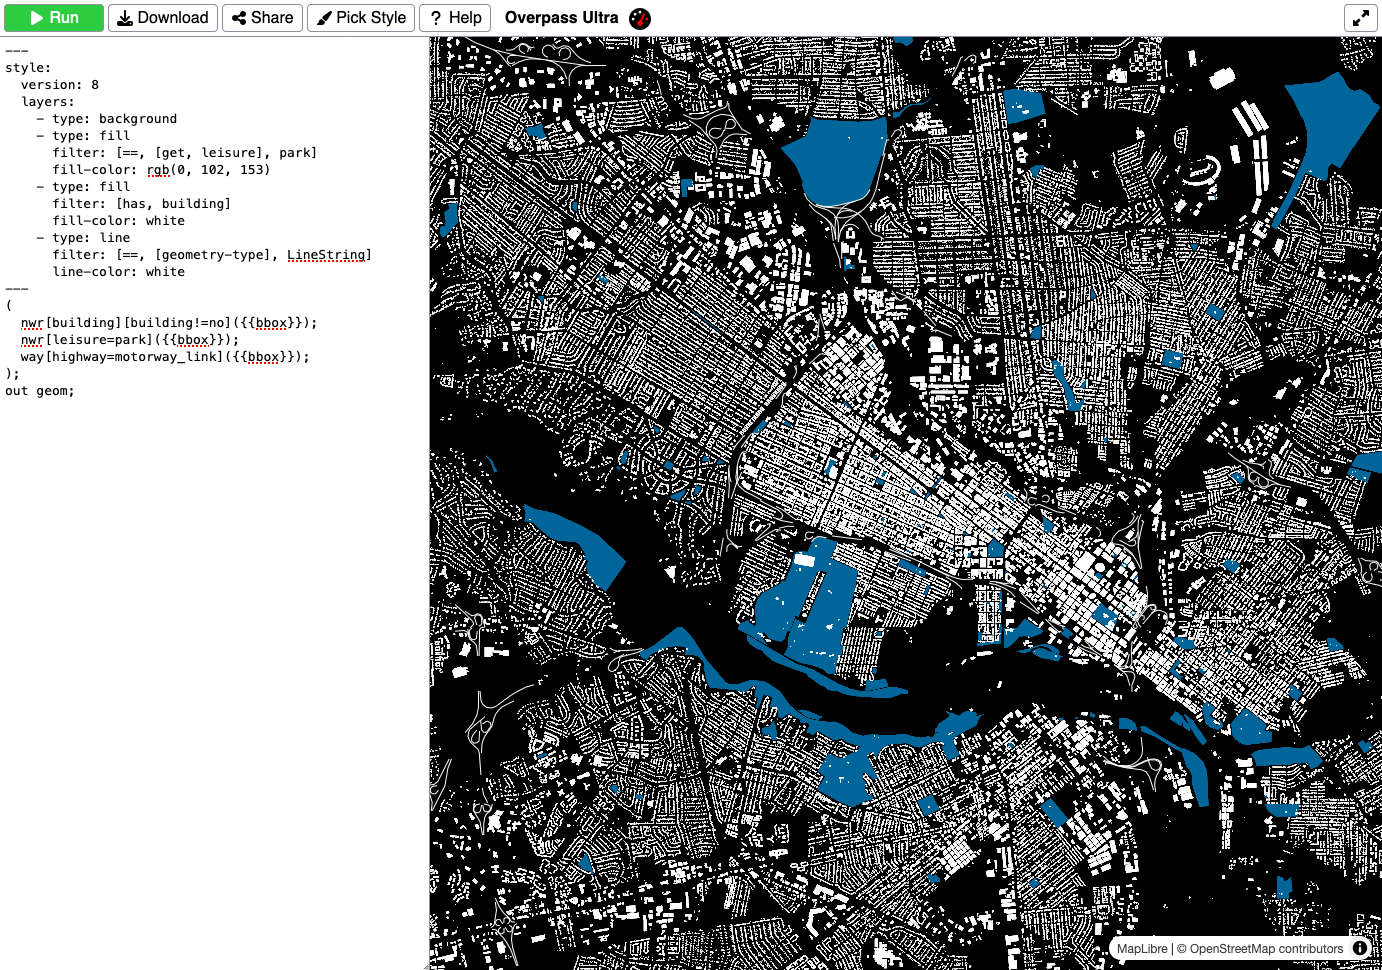
Over the years, Stamen has built and maintained tools of our own to supplement great tools created by larger carto community. Join us along a cartographic debugging journey as we explore how data, tiles, and stylesheets work together to make beautiful maps.

#maps #basemaps #design #cartography #opensource #maplibre #data #bts
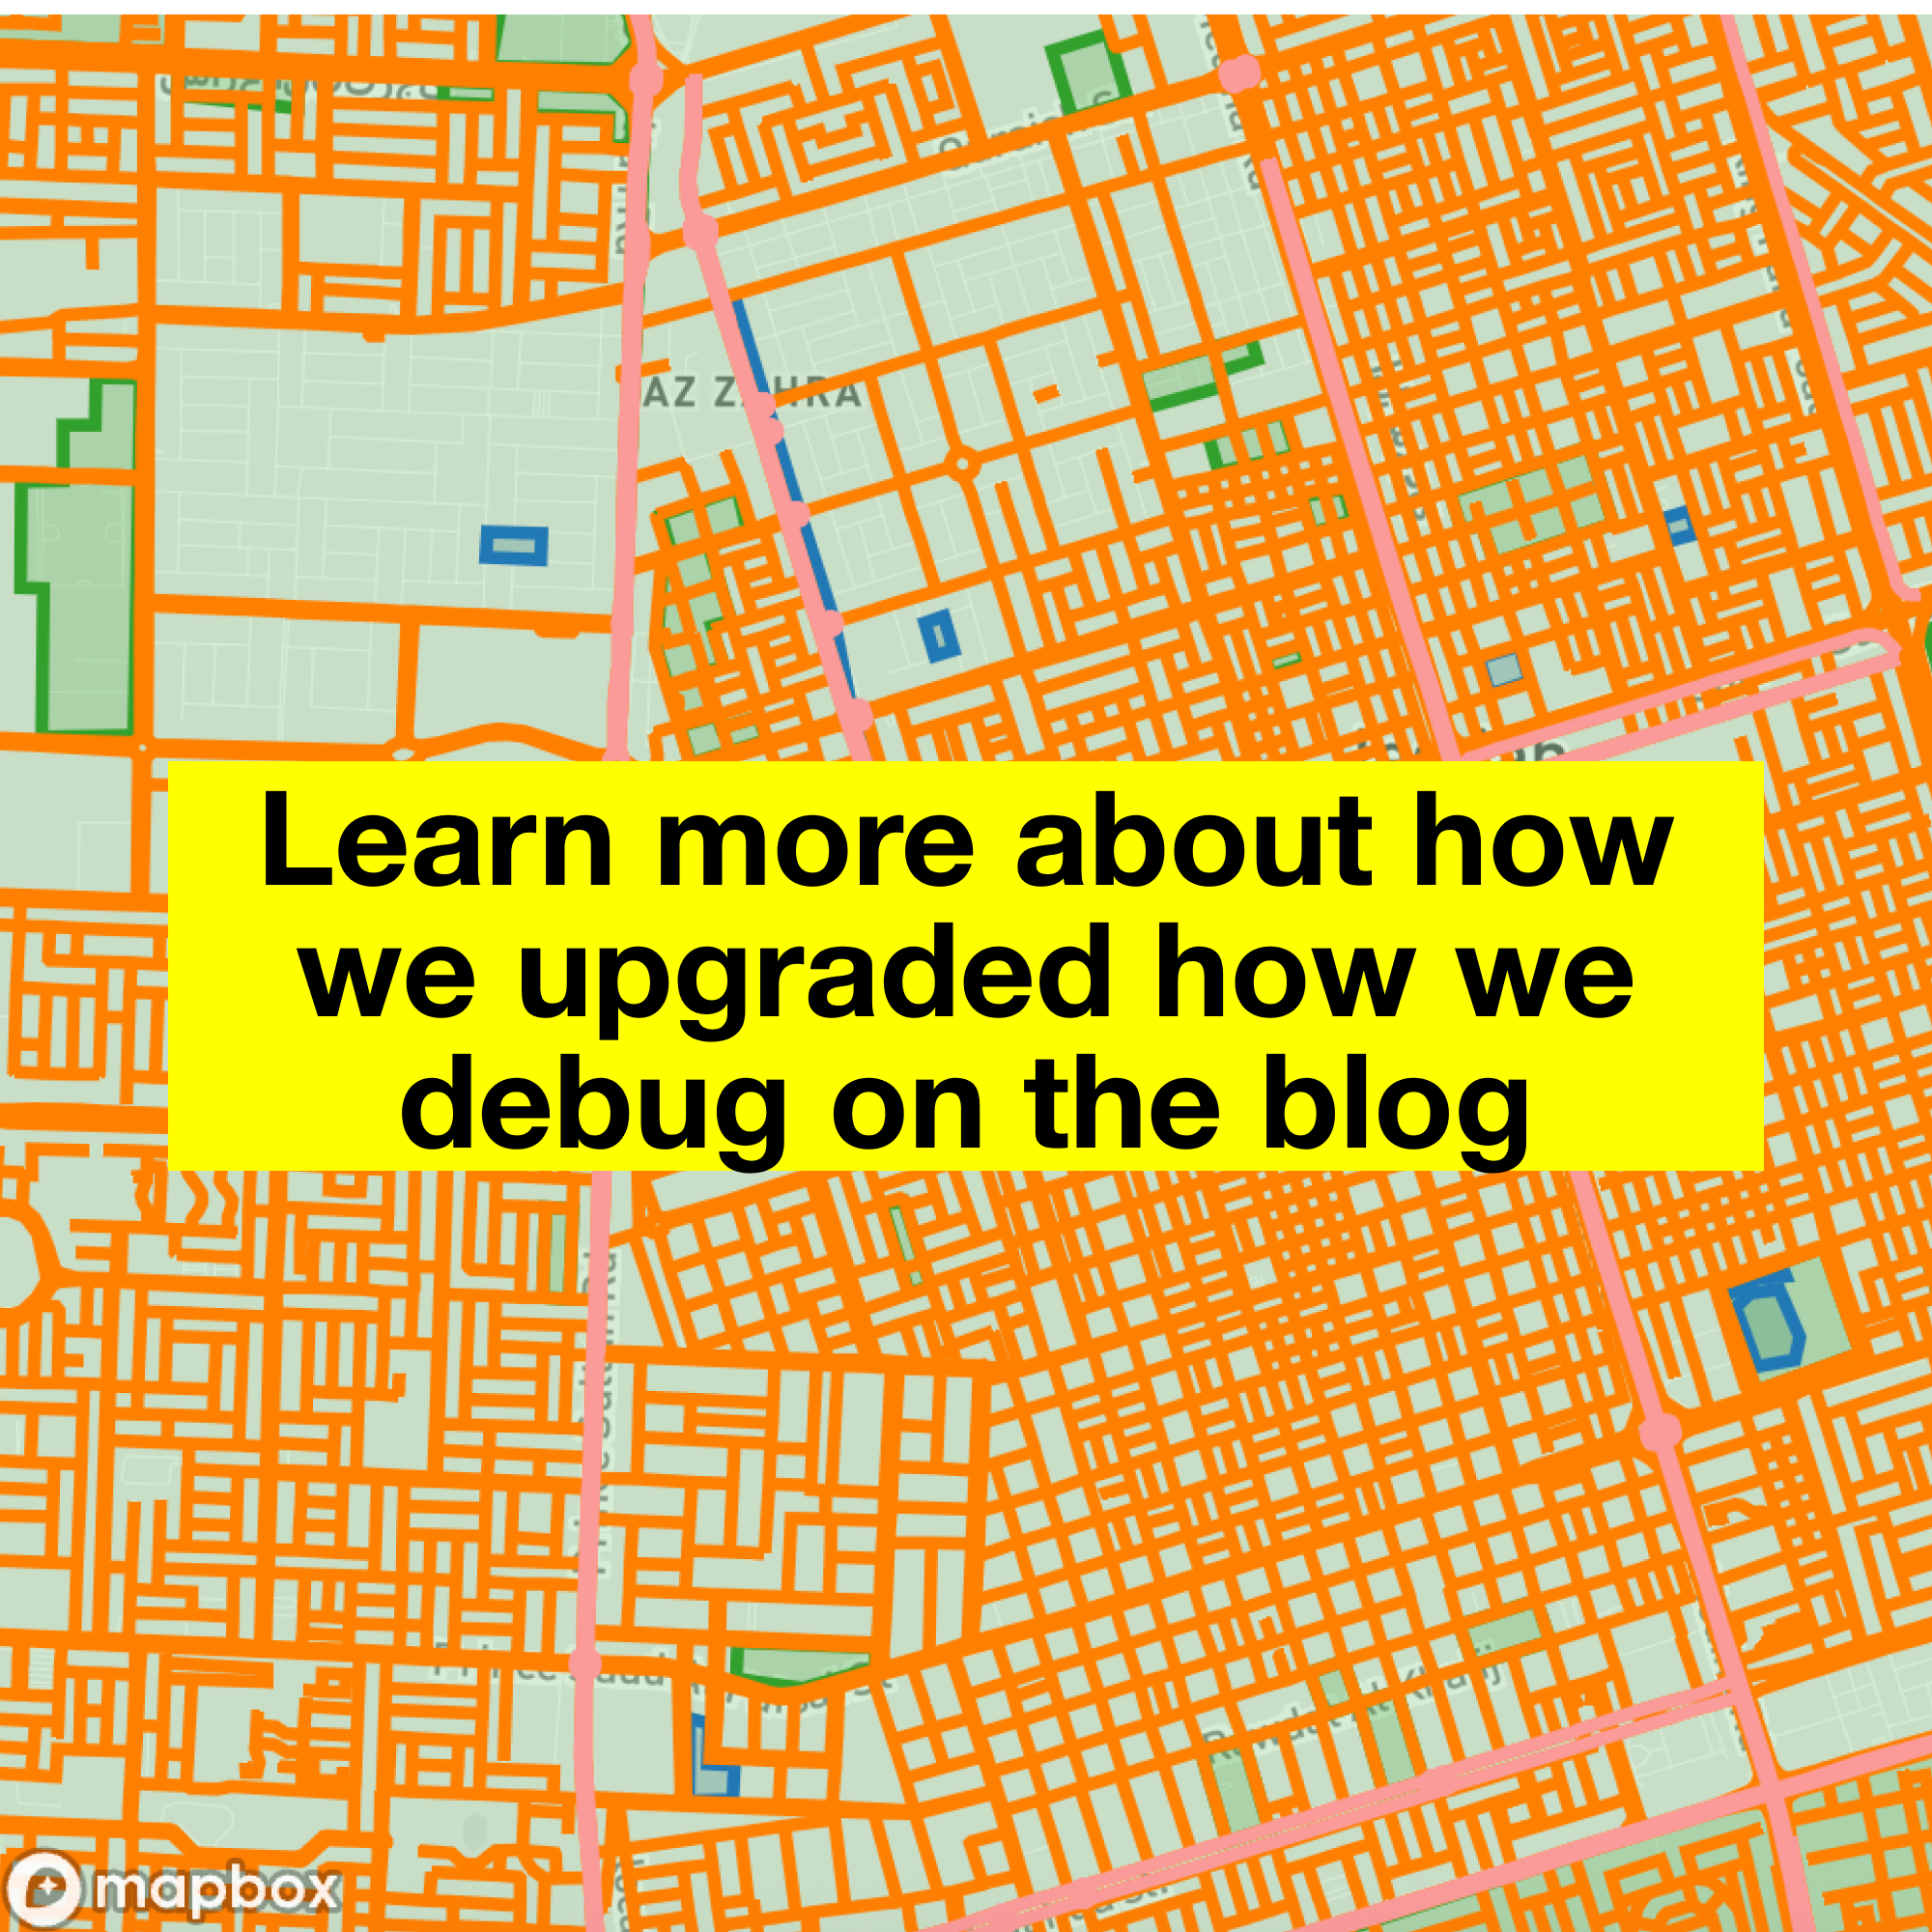
stamen.com/debugging-101-with-

How open source tooling empowers our cartography debugging workflows..by allowing for map style comparison......and interactive data viz to see your map from a difference perspective.Learn more about how we upgraded how we debug on the blog.
Stamen Design boosted:
2025-04-05
Stamen Designstamen@vis.social
2025-03-25

Stamen recently collaborated with the Science Museum to develop an interactive exhibit about The Congruence Engine, a 3-year research effort to digitally connect industrial heritage collections across the UK. Read more about our collaboration, focused on the industrial city of Bradford, on our blog.

stamen.com/navigating-polarize

#dataviz #museums #uk #archive #design #maps #design #cartography #ai #bradford

Telling the story of how technology and people-power unlocked new insights for historiansRead more about The Connection Engine for Science Museum
Stamen Design boosted:
Ahmad Barclaybothness@vis.social
2025-03-18

Ever wanted to waste infinity hours doing tile puzzles of every place in the world? Well, now you can with #AnyMapPuzzle

You can play for free, forever (literally), at bothness.github.io/anymap

Stamen Designstamen@vis.social
2025-03-18

Learn more about the data analysis and visualization tool we helped build for Stanford University's Natural Capital Project:

naturalcapitalproject.stanford

#Stanford #StanfordUniversity #NatCap #NaturalCapital #NaturalCapitalProject

Stamen Designstamen@vis.social
2025-03-07

It’s that time of year! Love it or hate it, #DaylightSavingTime is upon us, and we are listening to our podcast episode from a few years ago with cartographer @awoodruff about his Daylight Saving Time Gripe Assistant Tool. Give it a listen here:

stamen.com/andy-woodruff-savin

#podcast #maps #cartography #DST

Stamen Designstamen@vis.social
2025-03-06

Now on the blog: how we expanded UCSF’s Health Atlas from California (which we first collaborated on in 2019) to the entire US in 2024, including data and design updates across the entire tool.

Read now at stamen.com/taking-ucsfs-health

#maps #basemaps #design #cartography #ucsf #health #choropleth

How data viz and cartography combine to tell the story of health factors and outcomes......with beautiful yet simple choropleth maps......and interactive data viz to explain how variables interact.Learn more about how we upgraded the UCSF Health Atlas on the blog
Stamen Designstamen@vis.social
2025-02-18

Today at Harvard, our own Eric Rodenbeck joins a conversation with Harvard University Graduate School of Design on "Engaging Spaces: Exploring Digital + Analog Responsive Environments"

#Harvard #HarvardGSD #Boston #Design

Master in Design Studies presents OPEN CONVERSATIONS

ENGAGING SPACES: EXPLORING DIGITAL + ANALOG RESPONSIVE ENVIRONMENTS

Allen Sayegh, Eric Rodenbeck, and Marina Otero in conversation with K. Michael Hays, John May, and Malkit Shoshan. 

TUESDAY FEBRUARY 18, 2025 4:00-6:00 PM
GUND HALL, STUBBINS ROOM 112
Stamen Designstamen@vis.social
2025-02-13

On the blog: behind the scenes details on how we’ve migrated Columbia University’s Mapping Historical New York from raster to vector rendering. Read it now on the blog at stamen.com/vector-beeswarm-dot.

#maps #basemaps #design #cartography #columbia #historicalmaps #newyork

A map of New York overlaid with the text "How we did it: vector beeswarm dot density data visualization"A zoomed in screenshot of a spiral of colored dots with the text: "Learn more about the technical details on the blog now"
Stamen Design boosted:
2024-11-24

📣 New styles available on overpass-ultra.us 🎨 All of @stadiamaps's styles, including the legendary @stamen Toner style!

Stamen Designstamen@vis.social
2024-11-14

Now on the blog: a recap of our presentations at the recent North American Cartographic Information Society #NACIS conference (including videos of each talk)!

stamen.com/stamen-at-nacis-202

#nacis2024 #cartography #maps #gischat

Check out our recap of Stamen at NACIS 2024Watch our presentations on the blog now
Stamen Designstamen@vis.social
2024-11-01

The final part of "Maps and visualizations we're keeping an eye on for Election Day" is now up on our blog. Today we're talking about congressional races and the electoral college. Read it now on our blog at stamen.com/maps-and-visualizat

And don't forget to catch up with parts 1 and 2 from earlier this week!

#uspol #uspolitics #election #election2024 #ElectionDay #dataviz #maps #cartography #ElectoralCollege

A banner reading "Part three of our election visualization series is out now!"
Stamen Designstamen@vis.social
2024-10-31

Part two of "Maps and visualizations we're keeping an eye on for Election Day" is now up on our blog. This one is all about key indicators like fundraising and changing demographics. Read it now on our blog at stamen.com/maps-and-visualizat

#uspol #uspolitics #election #election2024 #ElectionDay #dataviz #maps #cartography

A banner that reads "Election maps and and dataviz, part two: indicators is out now" overlaid on a montage of data visualizations
Stamen Designstamen@vis.social
2024-10-30

Today we published the first of a three-part series: "Maps and visualizations we're keeping an eye on for Election Day". Part 1 is all about visualizing political polling! Read it now on our blog at stamen.com/maps-and-visualizat

#uspol #uspolitics #election #election2024 #ElectionDay #dataviz #maps #cartography

A banner reading "Election maps and data visualizations we’re watching this week" overlaid on a montage of election maps and visualizations
Stamen Designstamen@vis.social
2024-10-24
A colorful dot map of New York City with a text banner that reads "Visualize population patterns across historical New York"A colorful spiral pattern visualization with a banner containing the text "Check it out on the blog now!"
Stamen Designstamen@vis.social
2024-10-10

New on our blog: "Using interactivity and animation to bring data-driven mocks to life" by Caroline Carter and Kelsey Taylor

stamen.com/using-interactivity

#interactivity #animation #dataviz #DataVisualization #design

A banner reading "Putting our imagination on the page with design prototyping" overlaid on a montage of maps and data visualizations. The most prominent map shows a dark gray and black globe, glowing with multicolored dots across the cities of East AsiaA banner of text that says "Check it out on the blog now!"
Stamen Design boosted:
2024-08-14

As an amateur cartographer, I do a fair bit of mimicking of other maps & techniques as a way to learn. So when I saw overpass-ultra.us compared to @stamen's map=yes, I was very flattered, and compelled to recreate it. This volume of data takes a second or two for @maplibre to tile with geojson-vt, but then it's smooth as silk.

Here's the query so you can run it yourself for your own city, or tweak colors & data selection: overpass-ultra.us/#m=12.79/37.

#gis #OpenStreetMap #maps

Screenshot of Overpass Ultra with a map of Richmond mimicking Stamen Design's map=yes.
Stamen Designstamen@vis.social
2024-08-09

Happy Birthday #OpenStreetMap!

Today is the 20th birthday of #OSM, the free map of the world created by thousands of volunteers all around the globe.

Stamen has worked with OSM data since the very beginning, and the open-mapping ethos is part of our DNA. A few years ago we wrote a two-part history of Stamen's long relationship with OSM, and you can read it here on our blog:

stamen.com/our-brilliant-frien

Stay tuned for part three of this history, which we will be publishing next week!

A montage of nine colorful maps arrayed in a 3 by 3 grid. Each map is a Stamen project using OpenStreetMap data, styled in a different way. A banner of text on top of the montage reads "Happy 20th birthday OpenStreetMap!" in black Helvetica text on top of a bright yellow banner.
Stamen Designstamen@vis.social
2024-08-07

New on the blog, a deep dive into using OpenStreetMap data to render highway shields on maps:

"Highway Shields On the Open(StreetMap) Road"

stamen.com/highway-shields-on-

#OpenStreetMap #cartography #design #maps

Stamen Designstamen@vis.social
2024-07-23

@alan Thanks to Null Island's many supporters through the years, like @migurski @ajturner @thisisaaronland @stadiamaps and many others not on Mastodon!

Client Info

Server: https://mastodon.social
Version: 2025.04
Repository: https://github.com/cyevgeniy/lmst